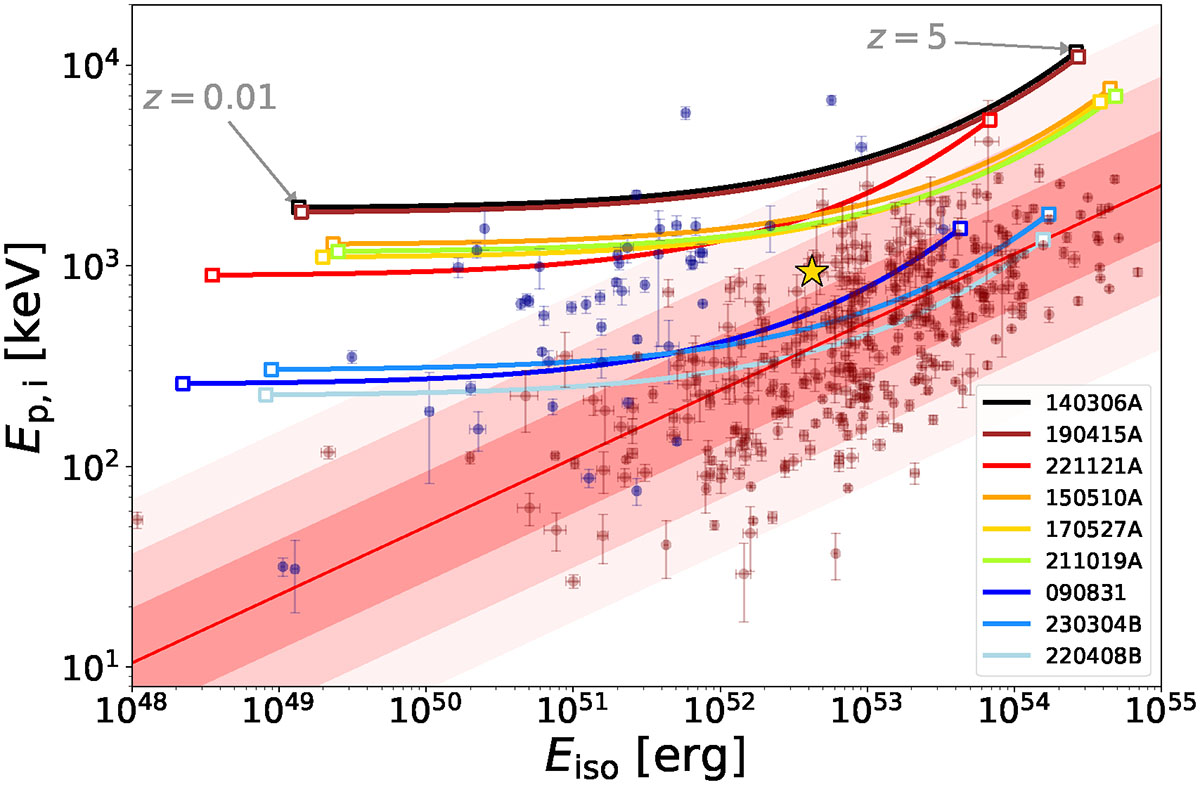
Fig. 2.
Download original image
Tracks of type-I candidates (sample S0) in the Ep,i − Eiso plane as a function of z. The tracks are colour-coded according to their ℒ* values, with darker (lighter) colours corresponding to higher (lower) ℒ*. Blue and brown points represent GRBs from sample SI and SII, respectively. The red line shows the Ep,i − Eiso relation and the shaded areas are the 1-, 2-, and 3-σint regions. The gold star is GRB 230307A.
Current usage metrics show cumulative count of Article Views (full-text article views including HTML views, PDF and ePub downloads, according to the available data) and Abstracts Views on Vision4Press platform.
Data correspond to usage on the plateform after 2015. The current usage metrics is available 48-96 hours after online publication and is updated daily on week days.
Initial download of the metrics may take a while.