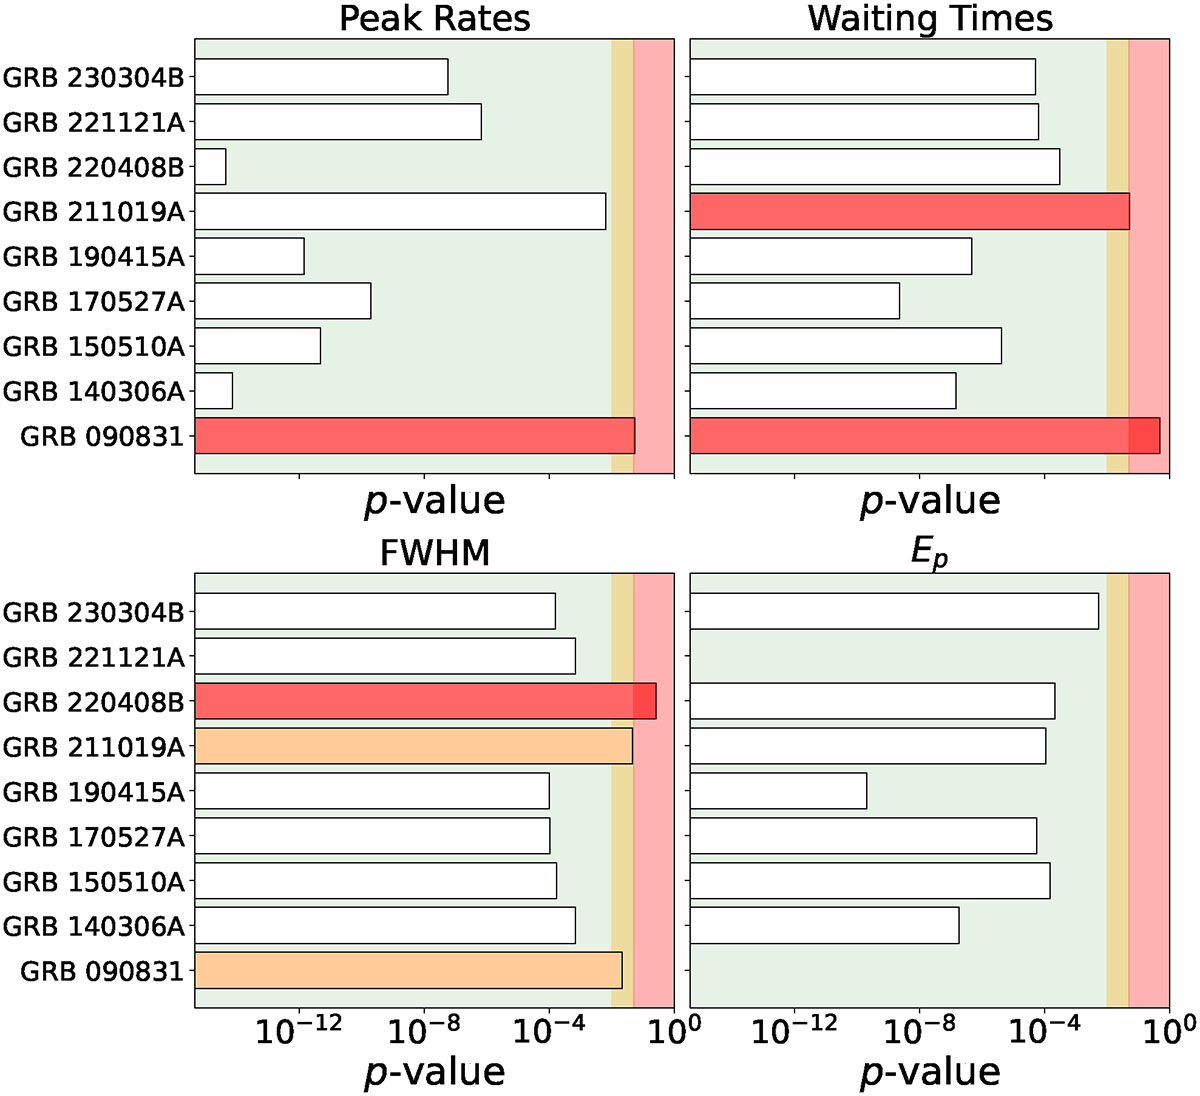
Fig. C.1.
Download original image
From top to bottom panels, left to right: p-values from Pearson correlation tests for the PR, WTs, pulse FWHM, and, when available, the spectral peak energy Ep. Horizontal bars indicate the p-values associated with each correlation test. Green-shaded regions (corresponding to white bars) denote p-values below 0.01, for which the null hypothesis of no temporal trend is rejected. Orange bars correspond to p-values between 0.01 and 0.05, indicating marginal detections of temporal trends. Red bars indicate p-values greater than 0.05, for which the null hypothesis of no temporal evolution cannot be rejected.
Current usage metrics show cumulative count of Article Views (full-text article views including HTML views, PDF and ePub downloads, according to the available data) and Abstracts Views on Vision4Press platform.
Data correspond to usage on the plateform after 2015. The current usage metrics is available 48-96 hours after online publication and is updated daily on week days.
Initial download of the metrics may take a while.