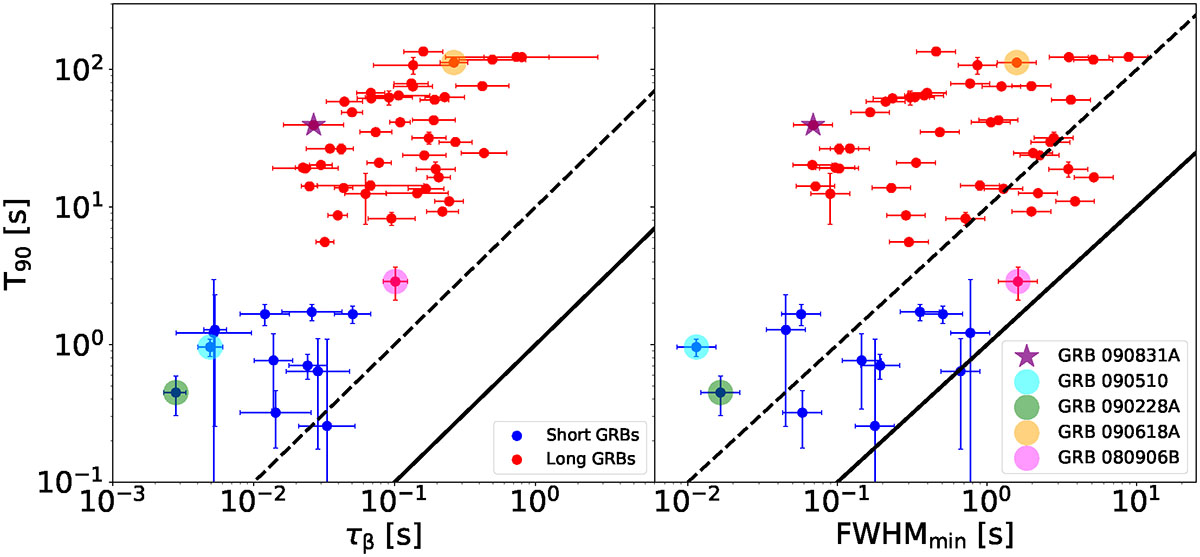
Fig. E.1.
Download original image
Left: MVT-T90 plane, with the MVT (denoted as τβ) values taken from MacLachlan et al. (2013), using their GRB sample. Right: MVT-T90 plane for the same bursts using the MVT values (denoted as FWHMmin) from Maccary et al. (2025). Solid and dashed lines show equality and T90 = 10× MVT. Some bursts are shown with coloured filled circles with the only purpose of highlighting the corresponding location in each plot. GRB 090831A, which belongs to the S0 sample, is identified with a purple star. Evidently, the relative positioning of these bursts remains essentially invariant, regardless of the MVT metric employed.
Current usage metrics show cumulative count of Article Views (full-text article views including HTML views, PDF and ePub downloads, according to the available data) and Abstracts Views on Vision4Press platform.
Data correspond to usage on the plateform after 2015. The current usage metrics is available 48-96 hours after online publication and is updated daily on week days.
Initial download of the metrics may take a while.