| Issue |
A&A
Volume 708, April 2026
|
|
|---|---|---|
| Article Number | A322 | |
| Number of page(s) | 10 | |
| Section | Interstellar and circumstellar matter | |
| DOI | https://doi.org/10.1051/0004-6361/202558684 | |
| Published online | 22 April 2026 | |
Gas chemistry in the dust-depleted inner regions of protoplanetary disks
I. Near-infrared spectra and overtones
1
Max-Planck Institute for extraterrestrial physics (MPE),
Giessenbachstr. 1,
85748
Garching,
Germany
2
Kapteyn Astonomical Institute, University of Groningen,
PO Box 800,
9700
AV
Groningen,
The Netherlands
3
University Observatory, Faculty of Physics, Ludwig-Maximilians-University at Munchen,
Scheinerstr. 1,
81679
Munich,
Germany
4
Max-Planck-Institut fur Astronomie,
Konigstuhl 17,
69117
Heidelberg,
Germany
★ Corresponding author: This email address is being protected from spambots. You need JavaScript enabled to view it.
Received:
19
December
2025
Accepted:
5
March
2026
Abstract
Context. The molecular composition inside the dust-sublimation zones of protoplanetary disks is mostly unknown, but important to our understanding of terrestrial planet formation. A few molecules have been observed from this region, specifically CO, H2O, OH, and SiO. The small surface area makes observing this region difficult; hence, modeling is required to disentangle the innermost disk from regions further out.
Aims. We aim to model a protoplanetary disk around a Herbig-type star including the dust-depleted inner region (≈0.1–0.3 au), investigate the chemistry of this region, and explain existing and future observations.
Methods. We post-processed the dust and gas distribution of a magnetohydrostatic model with the radiation thermochemical code ProDiMo to study the chemistry and to produce observables.
Results. We find that the dust-free inner disk is a molecularly rich environment where, besides CO, we also find H2, H2O, and SiO. The gas-temperature profile is complex and fluctuates between 700 and 2000 K, which is warm enough to produce CO overtone line emission. Next to the CO overtone lines, we also find strong high J-level fundamental CO lines between 4.3 and 4.6 μm. The elemental enrichment of Si due to dust sublimation leads to two orders of magnitude more SiO abundance. The SiO gas has average temperatures of ≈1000 K, resulting in strong SiO overtone emission in the spectral range between 4 and 4.3 μm.
Conclusions. We predict that the gas density in the dust-depleted inner disk is high enough to allow for H2 formation, resulting in a molecularly rich environment. For our representative Herbig model, the dust-depleted inner disk is responsible for at least 90% of the line emission for CO and H2O between 1 and 28 μm. Next to CO overtone lines, SiO overtone lines are expected to be an important tracer of a dust-free inner disk.
Key words: astrochemistry / radiative transfer / protoplanetary disks / ISM: abundances
© The Authors 2026
 Open Access article, published by EDP Sciences, under the terms of the Creative Commons Attribution License (https://creativecommons.org/licenses/by/4.0), which permits unrestricted use, distribution, and reproduction in any medium, provided the original work is properly cited.
This article is published in open access under the Subscribe to Open model.
Open Access funding provided by Max Planck Society.
1 Introduction
The inner regions of protoplanetary disks (within ≈1 au) are important to our understanding of planet formation, as they mark the origin zone of the material that contributes to terrestrial planets. With the advent of GRAVITY on the Very Large Telescope Interferometer (VLTI) (GRAVITY Collaboration 2017), CO overtone line emission from the innermost part at sub-astronomical-unit scales of disks can be spatially resolved. We aim to investigate the chemistry of the dust-sublimation region, in order to further our understanding of the CO overtone line emission using a chemical and physical model of the dust-depleted inner disk.
Close to the star, the gas and dust temperatures in the disk exceed the dust-sublimation temperature (1300–2200 K). The transition zone, where dust grains sublimate, is called the “dust inner rim” (Dullemond & Monnier 2010). The existence of this inner rim was speculated by Natta et al. (2001) and Tuthill et al. (2001). In order to give a correct fit to the spectral energy distribution (SED), they invoked a puffed-up, hot dusty wall. Dullemond et al. (2001) worked out the theory for a puffed-up inner rim, a vertical wall-like structure at the dust sublimation radius (~0.1 au), where grains are heated directly by stellar radiation and sublimate. This inner rim, also known as the dust-sublimation radius, is not the same as the accretion/truncation radius. Inward of this rim, dust cannot exist in thermal equilibrium such that this part of the disk is often called the dust-free or gaseous inner disk. The gaseous inner disk can extend inward to the truncation radius at ~0.03–0.08 au (Bouvier et al. 2007). In classical T Tauri stars, this region is magnetically truncated by strong stellar dipole fields, which disrupt the inner disk and allow gas to accrete along magnetic-field lines onto the star (Koenigl 1991; Hartmann et al. 1994; Bessolaz et al. 2008; GRAVITY Collaboration 2023). From the star, the truncation radius is seen, followed by the corotation radius and then the dust-sublimation radius. In this paper, we use the term “dust-depleted inner disk” for the region between the truncation radius and the dust sublimation radius (GRAVITY Collaboration 2021b).
The inner few astronomical units of a protoplanetary disk were studied through spectroscopy of molecular and atomic lines in the near- and mid-infrared for both T Tauri- and Herbig-type objects. CO, H2O, OH, and hydrogen recombination lines (Br γ) were observed (e.g. Najita et al. 2003; Carr & Najita 2008; Thi et al. 2005; GRAVITY Collaboration 2021a; Banzatti & Pontoppidan 2015). These observations indicate decoupled dust and gas temperatures (Salyk et al. 2008). The first recognized emission to probe the dust-depleted inner disk is the CO overtone emission (Δν = 2, λ = 2.3 μm, e.g. Najita et al. 2007). In a fraction of objects that show CO overtone emission, H2O emission was also detected (Najita et al. 2000; Carr et al. 2004; Thi et al. 2005), and OH was observed in actively accreting sources that have CO overtone and H2O emission (Najita et al. 2007; Carr & Najita 2008). More recently, spectro-astrometric observations with VLT/CRIRES have revealed fundamental ro-vibrational CO emission originating from both an outer and inner disk for a range of targets including T Tauri and Herbig up to three solar masses based on the line broadening of CO emission. Here, outer and inner are two components and do not necessarily correspond to inside and outside the dust-sublimation radius. The inner broad component originates from 0.05–3 au at 50–200 km/s, while the outer narrow component traces distances of 0.1–10 au with velocities of 10–50 km/s (Pontoppidan et al. 2008; Banzatti & Pontoppidan 2015). Furthermore, mid-infrared observations with JWST/MIRI have detected multiple gas-phase species in disks with large dust cavities. The spatial origin of the gas is based on line broadening caused by Keplerian rotation. In the T Tauri system PDS 70, water emission was found at ≈ 0.1 au (Perotti et al. 2023), and in the T Tauri system SY Cha, CO emission was found at ≈0.13 au originating from 1570 K gas (Schwarz et al. 2024). These MIRI observations do not have the required spatial resolution to determine if this gas emission only traces the dust-depleted inner disk.
The first detailed physical models of the dust rim were made by Isella & Natta (2005). They predicted a natural curved inner rim instead of a vertical wall. Magnetohydrodynamic (MHD) simulations coupled with accretion models incorporated the truncation of the dust-depleted inner disk by stellar magnetic fields (Romanova et al. 2003; Bessolaz et al. 2008). In these models, the gas is lifted out of the disk plane along magnetic-field lines and accreted onto the stellar surface, producing hydrogen recombination lines (e.g., Br γ). Thermally driven or magneto-centrifugal winds carry away angular momentum, causing material to accrete onto the star (Ferreira et al. 2006; Suzuki et al. 2010; Bai & Stone 2013).
Observations hint more and more at disk emission that originates from the innermost disk. This raises the question of how much of the observed line emission originates from the dust-depleted inner disk. Proper models including both the dust physics and gas processes are very limited and complex. In this work, we took a first step toward bridging the gap between dust physics and gas chemistry for protoplanetary disks. By creating a physical model that connects both fields, we hope to gain a better understanding of the inner region of protoplanetary disks where dust sublimation plays a role. We approached this by creating a consistent thermochemical model that includes both the dust-depleted inner disk and the classical protoplanetary disk from the sublimation radius onward. To achieve this, we added a dust-depleted gaseous area to the inner disk of the 2D radiation thermochemical disk model called ProDiMo (Woitke et al. 2009; Kamp et al. 2017; Rab et al. 2018; Thi et al. 2020). The dust distribution is taken from the output of a multi-dust species magnetohydrostatic disk model (Flock et al. 2025). This model is based on magneto-rotational instability (MRI), which provides the underlying dust structure. Subsequently, we used ProDiMo to obtain the gas composition, gas temperatures, and spectral predictions.
In Section 2, we explain how the model was constructed, justify our method, and introduce the key parameters and elemental abundances that were used. Section 3 analyzes the physical structure, temperature profile, chemical network, and molecular abundances, and includes simulated spectra for the final model including dust depletion. Section 4 provides a comparison of our model with previous works, including H2 formation pathways, in view of discussing model limitations and areas of improvement for future work.
2 Model
This section explains what the most important parameters and assumptions are for how we coupled two codes and generated a consistent model for studying the chemistry in a dust-depleted inner disk. Subsequently, we describe how we made predictions for molecular emission in the near-IR.
2.1 ProDiMo
ProDiMo1, short for protoplanetary disk model (Woitke et al. 2009; Kamp et al. 2017; Rab et al. 2018; Thi et al. 2020) is a 2D radiation thermochemical disk code that models the physical and chemical structures of protoplanetary disks. In this work, we created three different models in a stepwise approach. The first model is the standard Herbig-type ProDiMo. For the second and third models, the physical density setup is based on the output from a 2D multi-dust-species magnetohydrostatic model, M001, from Flock et al. (2025). We used the output from this model as underlying structure in ProDiMo, using the interface of Rab et al. (2022, see Section 2.2). This model contains a more physically realistic density structure for the four-dust-species: corundum (Al2O3), iron (Fe), forsterite (Mg2SiO4), and enstatite (MgSiO3). Then, ProDiMo was used to calculate the gas thermal balance and chemistry until a steady-state solution was found. In the photon-dominated upper layers of a disk, the chemical timescales in the dust-depleted inner disk are of less than one year (Fig. 1). The chemical relaxation time shows the longest time needed to reach steady state per gridpoint. In the dust-depleted region (<0.4 AU), the chemistry is completely radiation driven, mostly ion-neutral, and therefore very fast. The moment dust is abundant, the chemistry is dominated by neutral-neutral reactions and takes longer to reach steady state. The average time to reach steady state in the observable part of the disk is less than one year. Zsom et al. (2011) found the radial-drift timescale for dust to be on the order of 2 × 10⁴ years at 1 AU, such that the timescales at 0.1 au are on the order of ≈102−103 years. Furthermore, they find the viscous timescale to be longer than the radial-drift timescale. From this, we assumed the gas in the inner disk to be in steady state, such that we were able to run our steady-state chemistry model on top of the output from the magnetohydrostatic model.
2.2 Dust-depleted inner disk setup
In order to use the dust density and gas-to-dust ratio of model M001 (Flock et al. 2025) in ProDiMo, we had to make sure that the grid aligns with our ProDiMo grid. The model M001 has a grid of Nr × Nθ = 2304 × 216, which is downsized by interpolation in logspace to a grid size of Nr × Nz = 500 × 200, which is sufficient for calculating the chemistry. Most of our grid points are allocated to the inner few astronomical units and the dust rim to make sure our resolution is high enough to resolve the temperature profile of the disk properly. We subsequently used the interpolated dust density and gas-to-dust ratio as input for ProDiMo. Model M001 uses different dust densities for each of the included dust species. In ProDiMo, this is simplified to have a combined dust density, where we took the total dust-mass fraction and applied it to the whole disk. The magnetohydrostatic model has four dust species with high sublimation temperatures, which are expected to be the main dust component of the dust rim. The mass ratio of these species was calculated within the magnetohydrostatic model using GGchem (Woitke et al. 2018a; Flock et al. 2025). The model M001 has a disk extending from 0.1 to 100 au, which we adopted. Table 1 shows the main parameters used in ProDiMo, where the stellar and dust parameters were adopted from M001.
Figure 2 shows the standard Herbig star-disk model extending from 0.1 to 100 au with a typical density structure generated using ProDiMo. This model does not extend interior to 0.3 AU, where the dust temperature is high enough that it is consistent with the dust sublimation radius. The density of the innermost part in this model would not be realistic if we were to simply extrapolate the density of dust and gas. The red hatched region has dust depletion, but we cannot model this self-consistently using only ProDiMo. ProDiMo was used to model dust-depleted regions, such as in transitional disks or disks with an inner cavity (Woitke et al. 2019), but not for modeling the gas disk within the dust-sublimation radius.
There have been ProDiMo models where this region was constructed trough a rounded rim (Woitke et al. 2024) or a second zone (Woitke et al. 2019), but our model is the first one created through proper dust physics.
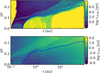 |
Fig. 1 Chemical-relaxation timescale, τchem (top), and cooling-relaxation timescale, τcool (bottom), for our model including a dust-free inner environment. The dashed blue line indicates where the visual extinction reaches unity (AV = 1). |
2.3 Chemical network for warm chemistry
We adapted the large DIANA chemical network with 235 gas and ice species (Kamp et al. 2017). For this network, we used the reaction rate compilation UMIST2012 (McElroy et al. 2013) and the additional rates from ChaiTea (Kanwar et al. 2025). The latter includes three-body reactions, which are very important for the high-density (n⟨H⟩ > 1012 cm−3, dashed yellow line in Fig. 2) region of the inner disk. Klarmann et al. (2017) studied the presence of poly-aromatic hydrocarbon species (PAHs) or quantum-heated particles (QHPs) in the inner region of disks. In their models, the QHP flux does not originate from the dust-depleted inner disk, such that PAHs including QHPs do not survive the conditions of the dust-depleted inner disk. Hence, the PAHs were removed from the network, resulting in a total of 228 species.
Parameters of ProDiMo.
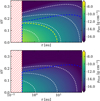 |
Fig. 2 Gas and dust density of a typical ProDiMo Herbig disk model. The red hatched area is generally not modeled as it is beyond the expected dust rim at 0.3 au. The dashed blue line indicates where the visual extinction reaches unity (AV = 1), the white dashed contours align with the values on the color bar. The dashed yellow line indicates where n⟨H⟩ = 1012 cm−3. |
Elemental abundances.
2.4 Elemental abundances
Typically in ProDiMo, so-called metal-depleted-gas elemental abundances are used (Kamp et al. 2017) to account for elements that are part of the refractory dust distribution. However, as we treated the elemental abundances in a self-consistent way by introducing dust sublimation, solar abundances from Asplund et al. (2021) were adopted. The elemental depletion in the gas is based on the dust-mass fractions provided by Flock et al. (2025) (Table 2). In the region where 99% or more of the dust is sublimated, we assumed that all elements that are normally locked in dust return to the gas phase resulting in solar abundances (C/O = 0.59). In the outer disk region, where dust is less than 99% depleted, we reduced our elemental gas budget with the elements in the dust (Table 1). From the dust-mass fraction, we find that 20% of our oxygen is locked in dust, resulting in a C/O ratio of 0.74 in the outer disk. The selection of dust species does not contain any carbonaceous grains, nor do we have any refractory sulfur species. However, including these for the outer disk would not change our conclusions for the inner disk. Aluminum was not considered here, despite corundum being a dust species, as this element was not included in our gas phase chemistry.
2.5 Molecular line emission and spectra
Beyond the typical molecular data in ProDiMo (Woitke et al. 2024), we included a selection of lines for H2O from the Hitran2020 database (Mikhailenko et al. 2020; Gordon et al. 2022) and SiO from the ExoMol database (Yurchenko et al. 2022). This line selection allowed us to include many additional lines between 1 and 5 μm for H2O. The lines in question were used in both gas heating and cooling and to predict observables. Using H2O from Hitran2020 instead of the LAMDA database (Schöier et al. 2005) limited us to LTE calculations. However, as the number density in the dust-depleted inner disk is high enough (n⟨H⟩ ~ 1012−1014 cm−3) with respect to the critical density (n⟨H⟩ ≈ 1013 cm−3 at 5 μm, Banzatti et al. 2023), LTE is a good approximation for H2O. We tested the effect of LTE versus non-LTE treatment of H2O in the model and found that the difference in emitted line fluxes is small, but the added highly energetic H2O lines between 1 and 5 μm provide a significant amount of gas cooling in the dust-depleted inner disk. Hence, even though non-LTE is the better treatment for line emission in lower density regions, we think the LTE model is more accurate for the inner disk.
Line predictions in ProDiMo are often made using the escape probability method (Woitke et al. 2018b). Within ProDiMo, the escape probability is also used as an approximate radiative-transfer method to compute the molecular non-LTE level populations of each grid point. The model assumes that a photon produced in a transition has a probability of escaping. The escape of this photon regulates the cooling rate. Once the level populations are known for the full grid, ProDiMo uses these with continuum opacities to create spectra for the whole disk. This method uses the probability of photons reaching the disk’s surface only in the vertical direction. This method is not exact, as it ignores opacity blending and disk inclination. However, it provides a very good estimate for near- and mid-IR spectra at zero-degree inclination (Woitke et al. 2018b). Proper observables, including line cubes and predictions for GRAVITY will be in an upcoming paper.
2.6 Different model setups
The ProDiMo model with the dust-depleted inner disk was step-wise constructed to ensure that the underlying physics and chemistry are understood. In this paper, we show three different models that were all setup using the parameters in Table 1.
In the first model (Figure 2), the dust and gas density were set up using the standard surface-density power law, but the disk was cut at 0.3 au. In the second model, the dust and gas distribution from M001 were used. For the third model, we used the model set up with the dust and gas distribution from M001, and the elemental abundances in the dust-depleted inner disk were enriched to be the solar values shown in Table 2.
Using the first two models, we introduce the physical structure of the dust-depleted inner disk and study how the gas temperature changes. The second and third models are used to illustrate the importance of enhancing the elemental abundances of O, Si, Fe, and Mg in the dust-depleted region for the spectral profile of the first SiO overtone band. For the third and most complete model, we carried out a deeper analysis and studied the chemical network, molecular species abundances, vertical temperature profile, and provide spectral predictions for the first CO overtone and the first SiO overtone band.
3 Results
3.1 Disk structure of the inner 1 AU
Previous ProDiMo models generally do not include the small dust-depleted inner region, but instead have the dust-sublimation radius as the inner radius (see Fig. 2). Figure 3 shows that our new model provides information about the dust-free environment between ~0.1 and 0.35 au in the midplane at z/r = 0. Due to the more physical dust rim shape in the upper disk layers, this region is radially more extended, that is, in the 0.1–0.5 au range. The dust-depleted inner disk is not completely dust free, but it has a dust-to-gas ratio at least three orders of magnitude lower with respect to the outer disk (third panel of Fig. 3).
The first and third models were not made for direct comparison, but they do have the same disk mass and stellar parameters. The scale height is different, so the upper layers are shifted vertically. However, the density and temperature contours in the midplane for the outer disk (>1 AU) are at approximately the same radius (e.g., the contours in Figs. 2 and 3. Similarly, in the temperature profile (Fig. 4) the 100 K contour only shifted by 0.3 au.
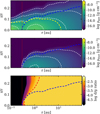 |
Fig. 3 Gas density, dust density, and dust-to-gas ratio of our model with the dust-depleted inner disk included. The vertical dotted red line indicates where the standard model is cut. The dashed blue line indicates where the visual extinction reaches unity (AV = 1), the dashed white contours align with the values on the color bar, and the dashed red contour in the bottom panel indicates the outer boundary of the dust-depleted inner disk. The dashed yellow line indicates where n⟨H⟩ = 1012 cm−3. |
3.2 Temperature profile of the inner disk
Figure 4 shows that the dust-free inner disk (R < 0.3 au) has a complex temperature profile. This pattern originates from the gas heating and cooling balance and is a direct result from the density structure and chemistry. Regions can have similar gas temperatures, but completely different dominant heating and cooling processes. The model has 119 heating and 111 cooling processes.
Figure 5 shows how the gas temperature and several species change as a function of gas density for a vertical cut at 0.165 au (the vertical red line in the bottom panel of Fig. 4), with the midplane being on the left side. There are three points where the gas-temperature profile inverses. The low (≈700 K) gas temperature in the midplane of the dust-free inner disk is mostly caused by H2O line cooling. H2O can exist as a consequence of self-shielding and because of the high gas density. The first temperature reversal happens when the gas density drops below ρgas ≈ 4 × 10⁻¹¹ g cm−3. At this density, Fe is no longer neutralized through collisions with electrons or H−. This leads to background heating by FeII lines. Background heating is the radiative heating that is caused by direct excitation through stellar optical and near-IR radiation (Woitke et al. 2009). Background heating is dominated by stellar photons, as the dust emission is negligible. This heating causes a small (≈50 K) gas-temperature increase. The lower density also decreases the efficiency of the three-body reaction in forming H2. This causes the H2O and H2 abundances to drop, thus decreasing the cooling rate. H2O is responsible for ≥97% of the total gas cooling inside the dust-free inner disk, where H2O is abundant.
As the H2O abundances decrease, the temperature increases until it reaches a maximum at ρgas ≈ 2 × 10⁻¹¹ g cm−3. The heating and cooling balance here shows two key heating mechanisms; photodissociation heating and chemical heating are balanced by the rotational and ro-vibrational line cooling of CO. Photodissociation heating is linearly and chemical-heating quadratically dependent on the gas density. As the gas density decreases, the heating becomes less efficient compared to the linearly dependent cooling. This causes a slow decrease in the gas temperature, until the final temperature reversal is reached at z/r = 0.085 (r,z = 0.165, 0.0149 au), ρgas ≈ 3.2 × 10⁻¹³ g cm−3. At higher densities, CO is efficiently cycled by forming HCO and CO2 and photo-dissociating back to CO. However, if the density drops below ρgas ≈ 3.2 × 10⁻¹³ g cm−3, the formation rates decrease, leading to lower CO abundances in the surface regions. Having no efficient coolants and being exposed to the stellar and ISM radiation, the gas temperature increases toward the disk’s surface.
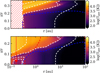 |
Fig. 4 Top panel shows the temperature profile of a standard ProDiMo model and the bottom shows the temperature profile of our model that includes a dust-depleted inner disk and increased inner-disk gas-phase elemental abundances (see Table 2). The dashed blue line indicates where the visual extinction reaches unity (AV = 1); the white contours show the gas temperatures of 100, 1000, and 10 000 K. The vertical red line indicates where the temperature is analyzed in Fig. 5 and the red dot is the grid point at which the chemistry is analyzed (Fig. 6). |
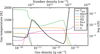 |
Fig. 5 Vertical cut of the 2D disk at r = 0.165 au, showing the gas temperature and molecular abundances with respect to the gas and number density. The left axis indicates the gas temperature, and the right axis shows the relative molecular abundance for selected species important to the heating and cooling balance. The midplane is the left y-axis at ρgas ≈ 2.15 × 10⁻¹⁰ [g cm−3]. |
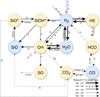 |
Fig. 6 Reaction network of steady-state chemistry at r = 0.165 au and z = 0.0061 au, where Tgas = 780 K. The abundances for the species marked in blue are shown in Fig. 7, and their formation and destruction reactions are described in more detail and shown in Table 3, 4, 5 & 6. |
3.3 Chemical network of the hot inner disk
We analyzed the chemistry in the model with increased elemental abundances for the dust-depleted region of the inner disk. We find several abundant molecules besides CO that can form at high (>750 K) temperatures. Abundant H2 is produced in the absence of dust. The presence of H2 leads to the formation of many molecules, especially abundant H2O. Specifically for this model, we also find high abundances for gaseous SiO in the dust-depleted inner disk due to the solar Si abundance. All of these molecular species are connected in steady state. We analyzed a specific grid point that is on the boundary of the hot and cold gas reservoir and has a high abundance of H2O. Figure 6 shows the chemical-reaction network in steady state for r = 0.165 au, z = 0.0061 au, z/r = 0.0371, Tgas = 780 K, and ρgas = 6.55 × 10⁻¹¹ g cm−3.
Table 3 shows the dominant formation and destruction reactions for H2 in steady state. There are six different pathways to create H2. For four of these formation reactions, the reverse rate is higher. This left us with only two efficient pathways to create H2; the three-body reaction and the gas-phase associative detachment reaction (reactions (3) and (5), Table 3). The three-body reaction is the most important reaction in regions that have a gas density above ρgas ≈ 2 × 10⁻¹¹ g cm−3, and the associative Article number, page 6 of 10 detachment dominates in less dense regions. The latter cannot sustain high abundances of H2 (see Fig. 5). For the three-body reactions, M is defined as a collective species representing the third body, which is approximated by adding the abundances for H, H2, and He (M = nH + nH2 + nHe). The relative abundance (ϵ(x)) is defined as the ratio of the number density of the respective species to the number density (n⟨H⟩). ϵ(x) = nx/n⟨H⟩, where the number density is calculated as n⟨H⟩ = nH + 2nH2.
CO, H2O, and SiO are almost never chemically destroyed to atoms. Figure 6 shows that they are all connected. Besides the atoms making up these species (H, C, O, Si), only two molecular species are needed to chemically form these three molecules: H2 and OH. At the selected grid point, SiO is not stable and has a low (5 × 10⁻⁸) relative abundance. At lower temperatures (<900 K), oxygen is preferentially incorporated into H2O instead of SiO. To have abundant SiO, we require the destruction of H2O.
Between 0.4 and 0.7 au, the midplane shows a CO-poor region (second panel of Fig. 7). This is an artifact from running steady-state chemistry. However, this region is below the Av = 1 line and therefore not observable; it does not impact any results shown in the paper.
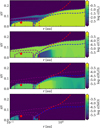 |
Fig. 7 Abundances of H2, CO, H2O, and SiO for the model with solar-abundance gas-phase abundances in the inner disk. The purple contour shows where the gas temperature is 1000 K, the red contour shows where the dusty disk starts, and the dashed blue line indicates where the visual extinction reaches unity (AV = 1). The red dot indicates the grid point at which the chemistry was analyzed. |
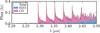 |
Fig. 8 Escape probability spectra showing the first CO overtone lines. This model includes dust depletion and elemental enrichment in the inner disk and was convolved using a spectral resolving power of 3000. |
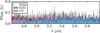 |
Fig. 9 Escape probability spectra showing the H2O and CO lines between 4.6 and 6 μm. This model includes dust depletion and elemental enrichment in the inner disk and was convolved using a spectral resolving power of 3000. |
3.4 Elemental enrichment of the dust-depleted inner disk
The elemental enrichment of O, Mg, Si, and Fe causes changes to the chemistry and heating-cooling balance. The enrichment changes the gas temperature in the water-dominated region by less than 5% and the gas temperature in the warm CO layer by less than 10%. However, the increase in elemental abundance for Si results in about two orders of magnitude higher SiO gas abundances in the dust-depleted inner disk (see Fig. 7).
3.5 Near-IR spectral predictions
The elemental enrichment of Si has a strong effect on the near-IR emission spectrum for the first SiO overtone. Using the escape probability method, we calculated near-IR emission spectra where the object is assumed to be at a distance of 387 pc. We chose this distance to put our predictions into context with regard to JWST observations by Kaeufer et al. (2026). However, we emphasize that our model was not adapted to match the properties of that disk. We simulated the first CO overtone emission using the escape probability between 2.2 and 2.5 μm (Fig. 8).
As a result of including all water lines, we created a quasi-continuum of water at around 5 μm. Figure 9 shows how densely the water lines are populated. As mentioned before, the escape probability spectra do not include the disk rotational broadening or opacity overlap. If these additional effects are taken into account, the quasi continuum will be even stronger.
We also simulated the first SiO overtone emission between 3.8 and 4.6 μm, along with CO, H2O, OH, and CO2 for both a model where the elements in the inner have been enhanced and one where these are not enhanced (Fig. 10). We find that all of our SiO overtone emission depends on the enhancement of the elemental abundances, while the CO overtone is hardly affected by the difference in elemental abundance. Next to the SiO overtone, we find four very strong peaks for high J (J > 60) ro-vibrational CO line transitions of the fundamental band. These emission features can be seen in Fig. 10 between 4.3 and 4.6 μm. We elaborate on them further in the discussion.
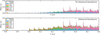 |
Fig. 10 Escape probability spectra from our disk model showing the first SiO overtone lines originating from the dust-depleted inner disk of a model with and without elemental enhancement convolved using a spectral resolving power of 3000. The black line shows the combined spectra of molecules in the model, and the colors indicate how much of the flux originates from specific molecules. |
4 Discussion
4.1 Comparing to previous ProDiMo models
In typical ProDiMo models (e.g,. Kamp et al. 2023; Woitke et al. 2024), it is common to enhance the gas density such that the dust-to-gas mass ratio is (d/g) = 0.001 for the inner 10 au. This adjustment was needed to match the observed Spitzer mid-IR molecular line strengths (Meijerink et al. 2009; Woitke et al. 2018b). We find that at least 90% of the line emission for CO and H2O between 1 and 28 μm originates from the dust-depleted inner disk within 0.3 au. A d/g ratio of 0.001 can be obtained naturally in disk models that include full dust evolution and settling (Greenwood et al. 2019). In our self-consistent models, the d/g ratio is ≈10−10 in the dust-depleted inner disk, while beyond 0.4 au the d/g ratio is 0.0046. The canonical d/g ratio is 0.01, but as a result of the underlying MHD model we only include a narrow range of dust-grain sizes, excluding part of the dust reservoir. However, using only this range is fine for this work as the continuum flux in the near-to-mid-IR wavelength range is regulated by 0.1–5 μm sized grains (Jang et al. 2025).
4.2 Comparison to existing observations
Kaeufer et al. (2026) observed the Herbig star HD 35929 as part of the MINDS program (Kamp et al. 2023; Henning et al. 2024). They found strong gas-phase molecular line emission for SiO between 8 and 8.7 μm. They found molecular column densities that suggest the disk has a low dust opacity and/or a low d/g ratio. Many of their emission lines are spectrally resolved, placing the gas emission near the star at a typical distance of 0.1–0.2 au. They also detected mid-IR water emission and derived a temperature of ≈850 K. We find that our model predicts the fundamental SiO emission to be a factor of two to three, and our H2O emission between 5 and 7 micron is about a factor of five to seven stronger than what they observed. Our modeled water spectrum is so densely populated with lines that it produces a pseudo-continuum when convolved to MIRI/MRS spectral resolution. We also predict that the first overtone band of SiO (4–4.3 μm) has a similar flux strength to the fundamental band. This could be observed either with JWST/NIRSPEC or from the ground with VLTI/CRIRES. There is not yet a detection of the first SiO overtone for Herbig-type disks in the literature; it has only been detected in disks around massive evolved stars (Kraus et al. 2015).
4.3 Condensation and sublimation
Figure 4 shows that inside the dust-depleted inner disk the gas cools down to below 700 K (Tgas = 680 K at r = 0.22 au, z/r = 0.04). At these temperatures, we expect most dust species to re-condensate. The hypothetical region in which dust can exist in both the gaseous and solid state is often called the thermostat region (Min et al. 2011; McClure et al. 2025). An open question for this dust-depleted region is whether the temperatures at which dust is sublimated and condensated are the same or even similar. In an environment with a low d/g ratio and the presence of intense radiation fields, dust might sublimate at lower temperatures compared to an environment where d/g = 0.01.
4.4 Temperature jump with respect to the radial hydrogen column density
An important region in protoplanetary-disk modeling is the transition between the ionized, UV-irradiated disk atmosphere and the UV-shielded midplane layers. Simplified chemistry models coupled with hydrodynamics predict atomic hydrogen column densities of N⟨H⟩ ≈ 1019 cm−2 (Nakatani et al. 2018a,b), which marks the extreme-UV absorption layer and H+-H transition. Flores-Rivera et al. (2020) marked the X-Ray/far-UV absorption layer at a radial hydrogen column density of N⟨H⟩ = 1022 cm−2. This value is only valid for radii larger than 1 au, as it depends on the presence of dust. In our models, the latter defines the important transition in which the gas temperature increases above 1000 K in almost the entire disk atmosphere from 1 to 10 au, as seen in Fig. 4. We calculated and confirmed that in our thermochemical model a radial hydrogen column density of N⟨H⟩ ≈ 1019 cm−2 lies very close to the H+-H transition. For the H-H2 transition, however, we did not find the transition at exactly N⟨H⟩ = 1022cm−2, but we found a range for the radial column density that changes with radius. Figure 11 shows how this transition changes with respect to the radial column density. We find that between 1 and 10 au the transition changes from a radial column density of N⟨H⟩ ≈ 8 × 1022cm−2 at 1 au to N⟨H⟩ ≈ 5 × 1021cm−2 at 10 au.
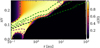 |
Fig. 11 Atomic hydrogen abundance, with the 1000 K temperature contour in purple. In green we show the radial hydrogen column density contours for 1019, 1021, 1022, and 1023 cm−2. |
4.5 The MRI assumption’s validity for the whole inner disk
The magnetohydrostatic model we used as a foundation for the dust and gas density is dependent on the gas temperature. Using ProDiMo, we recalculated the gas temperature including the chemistry. This gave us a region with low (≈700 K) temperatures in part of the inner disk, contrary to what the hydrostatic model finds. Our temperatures are low enough for a small part of the Fe in the gas to be neutral, as can be seen in Fig. 5. MRI relies on the magnetic fields being coupled to disk material, and this requires ionized gas. Our midplane gas temperatures can perhaps even lead to dust re-condensation (see Sect. 4.3). Both of these effects can suppress MRI-driven turbulence and non-ideal MHD effects (Lesur et al. 2023). In order to properly test if the MRI assumptions hold with respect to chemical-cooling timescales, we had to run the gas chemistry inside the magnetohydrostatic model.
4.6 High J-level CO emission lines
Figure 10 shows very strong CO emission peaks between 4.3 and 4.6 μm. This emission originates from high (>60) J-level line transitions. In the model the molecular data for higher level rotational states are calculated by extrapolation (Thi et al. 2013). In the future, the validity of these extrapolations needs to be revisited.
4.7 H2 formation in a dust-depleted environment
Studies on H2 formation in high-temperature and dust-poor environments are limited. Thi & Bik (2005) proposed three reaction pathways to produce H2 in the absence of dust. All three are included in our model. Their three-body reaction, H + H + H → H2 + H, was included as H + H + M → H2 + M, where M is the combined density of H, H2, and He. They found that the three-body reaction becomes important at hydrogen densities above n⟨H⟩ ≈ 1012 cm−3. Kanwar et al. (2025) found that to produce abundant H2 through three-body reactions, a density of n⟨H⟩ ≈ 1012 cm−3 is not enough, and we need at least n⟨H⟩ ≈ 1013 cm−3. We confirm that our model requires at least n⟨H⟩ ≈ 1013 cm−3 (see Fig. 5) to turn H molecular.
Sternberg et al. (2021) investigated the formation of H2 in cold (100 K) dust-free gas. All of their formation pathways are included in the existing ProDiMo network. Other studies of dust-free H2 formation focus mostly on low-density primordial dust-free gas, where H2 is predominantly produced through the gas-phase associative detachment reaction, H− + H → H2 + e−. Even though our model does not have any regions of cold dust-free gas, this reaction is also important at higher temperatures as it is our second most important H2 formation reaction after the three-body reaction.
4.8 CO overtone emission
In Fig. 8, we show that our model produces CO overtone emission. Because GRAVITY is an interferometric instrument that can only observe relative flux, there is no direct comparison we can make. However, the object for which we compared our fundamental mid-IR SiO fluxes has also been observed with X-shooter. Ilee et al. (2014) found that the relative flux of the first CO overtone bandhead in HD 35929 is roughly 10% of the continuum. Our scaled model shows a CO overtone peak flux of ≈15% relative to the continuum. This is a very good agreement given that we did not aim to fit this object. Next to the CO overtone emission, we also produce some weak water lines in this wavelength region. Such weak water lines have only been observed once in 51Oph (Thi et al. 2005). In future studies, we will use this model to create interferometric observables for GRAVITY, inserting linecubes from the model into a GRAVITY simulator.
4.9 Gas opacity
The underlying magnetohydrostatic model (M001) by Flock et al. (2025) does include gas opacity to calculate the location of the inner dust rim. However, the value used, κgas = 10−6 cm2/g, is on the low side and considered to be an average gray opacity that is constant across temperature and wavelength. A recent work by Cecil et al. (2026) used the same modeling code as Flock et al. (2025), and they show how increasing the gas opacity will move the dust rim inward. This shift of the dust rim will likely lower the expected line emission. However, for the current model, the K-band half-light radius matches very well with GRAVITY YSO observations (Flock et al. 2025). Hence, we do expect the dust rim to be around 0.35 au for this type of disk.
Currently, the gas opacity is not included in the dust radiative transfer for our ProDiMo model. This is why our visual extinction (AV) = 1 reaches the midplane when dust sublimates (see Fig. 3). However, gas opacity effects are treated within the chemistry through self-shielding for the most important molecules (Woitke et al. 2024). This shielding effect is also considered for the heating and cooling balance. The predicted spectra account for the gas optical depth based on the specific molecular vertical gas column density.
4.10 Modeling limitations and future improvements
The model has several technical limitations, which we list below:
Many of the chemical rates we used in our model are uncertain, as these have not been measured for high temperatures. In future works, we plan to investigate if including combustion chemistry or three-body reactions for larger molecules are important for the chemical inventory of the dust depleted inner disk;
We used self-shielding for all molecules on itself. However, with the exception of C, H2, and CO, species cannot shield different molecular species, a process also called alien shielding. In the radiation-rich environment of interest to us, the shielding is very important to keep molecules from being photodissociated. Thus, future studies should include alien shielding for more molecules;
The inner radius of our model was set at 0.1 au. This is not for a physical reason, but a direct consequence that the underlying magnetohydrostatic model stops here. For future models, we would like to include the disk up to the corotation radius. The effect on the predicted line fluxes should be small, as the emitting surface area is at most 12.5% larger in the most extreme scenario, where the inner radius extends all the way to the stellar surface.
5 Conclusion
In this work, we made the first steps toward accurately modeling the inner regions of protoplanetary disk including a realistic dust distribution based on dust sublimation. The presented model combines a magnetohydrostatic simulation with a radiation thermochemical disk model to include both dust physics and gas chemistry. Our main results are listed below following:
The dust-depleted inner disk gas is chemically rich, showing large abundances of H2, CO, H2O, and SiO, which are the result of a self-consistent chemical model;
The inner disk has a complex temperature profile. In the absence of dust, the heating and cooling of the gas is dominated by molecular lines, such that the chemistry becomes crucial. We find that H2O is a very efficient coolant in the dense midplane region, cooling it down to ≈700 K;
We find that the dust-depleted inner disk (0.1–0.3 AU) in our model is responsible for at least 90% of the emitted line fluxes for CO and H2O between 1 and 28 μm;
A large reservoir of abundant gas-phase H2O (ϵ(H2O) = 1.98 × 10⁻⁴) is present in the dust-depleted inner disk. This hot H2O produces a pseudo-continuum in the spectrum between 4.6 to 6 μm when convolved to MIRI/MRS spectral resolution. Taking the possibility of this into account is important to properly fit observations;
In our self-consistent inner thermochemical disk model, the gas temperatures are high enough to produce the commonly observed first CO overtone line emission;
We can reproduced the recently observed SiO mid-IR emission reported by Kaeufer et al. (2026) if we increase the elemental abundances to include the material from sublimated dust. This suggests that observing the fundamental and/or first overtone lines of SiO are strong indications of a dust-free inner disk, where Si has been returned to the gas phase.
In future studies, we will focus on modeling specific Herbig-type disks and creating proper synthetic observables for GRAVITY+ and JWST. We will also expand our model to T Tauri-type disks.
Acknowledgements
The authors are grateful to the referee for a constructive and positive report that improved the paper. J.B., C.H.R. and P.C. gratefully acknowledge the funding by the Max Planck Society. CHR acknowledges the support of the Deutsche Forschungsge-meinschaft (DFG, German Research Foundation) Research Unit “Transition discs”-325594231.
References
- Asplund, M., Amarsi, A. M., & Grevesse, N. 2021, A&A, 653, A141 [NASA ADS] [CrossRef] [EDP Sciences] [Google Scholar]
- Bai, X.-N., & Stone, J. M. 2013, ApJ, 769, 76 [Google Scholar]
- Banzatti, A., & Pontoppidan, K. M. 2015, ApJ, 809, 167 [NASA ADS] [CrossRef] [Google Scholar]
- Banzatti, A., Pontoppidan, K. M., Pére Chávez, J., et al. 2023, AJ, 165, 72 [CrossRef] [Google Scholar]
- Bessolaz, N., Zanni, C., Ferreira, J., Keppens, R., & Bouvier, J. 2008, A&A, 478, 155 [NASA ADS] [CrossRef] [EDP Sciences] [Google Scholar]
- Bouvier, J., Alencar, S. H. P., Harries, T. J., Johns-Krull, C. M., & Romanova, M. M. 2007, in Protostars and Planets V, eds. B. Reipurth, D. Jewitt, & K. Keil, 479 [Google Scholar]
- Carr, J. S., & Najita, J. R. 2008, Science, 319, 1504 [Google Scholar]
- Carr, J. S., Tokunaga, A. T., & Najita, J. 2004, ApJ, 603, 213 [NASA ADS] [CrossRef] [Google Scholar]
- Cecil, M., Flock, M., Malygin, M. G., et al. 2026, A&A, 707, A296 [NASA ADS] [CrossRef] [EDP Sciences] [Google Scholar]
- Dullemond, C. P., & Monnier, J. D. 2010, ARA&A, 48, 205 [Google Scholar]
- Dullemond, C. P., Dominik, C., & Natta, A. 2001, ApJ, 560, 957 [NASA ADS] [CrossRef] [Google Scholar]
- Ferreira, J., Dougados, C., & Cabrit, S. 2006, A&A, 453, 785 [NASA ADS] [CrossRef] [EDP Sciences] [Google Scholar]
- Flock, M., Chrenko, O., Ueda, T., et al. 2025, A&A, 701, A259 [NASA ADS] [CrossRef] [EDP Sciences] [Google Scholar]
- Flores-Rivera, L., Flock, M., & Nakatani, R. 2020, A&A, 644, A50 [NASA ADS] [CrossRef] [EDP Sciences] [Google Scholar]
- Gordon, I. E., Rothman, L. S., Hargreaves, R. J., et al. 2022, J. Quant. Spec. Radiat. Transf., 277, 107949 [NASA ADS] [CrossRef] [Google Scholar]
- GRAVITY Collaboration (Abuter, R., et al.) 2017, A&A, 602, A94 [NASA ADS] [CrossRef] [EDP Sciences] [Google Scholar]
- GRAVITY Collaboration (Koutoulaki, M., et al.) 2021a, A&A, 645, A50 [NASA ADS] [CrossRef] [EDP Sciences] [Google Scholar]
- GRAVITY Collaboration (Perraut, K., et al.) 2021b, A&A, 655, A73 [NASA ADS] [CrossRef] [EDP Sciences] [Google Scholar]
- GRAVITY Collaboration (Soulain, A., et al.) 2023, A&A, 674, A203 [NASA ADS] [CrossRef] [EDP Sciences] [Google Scholar]
- Greenwood, A. J., Kamp, I., Waters, L. B. F. M., Woitke, P., & Thi, W.-F. 2019, A&A, 626, A6 [NASA ADS] [CrossRef] [EDP Sciences] [Google Scholar]
- Hartmann, L., Hewett, R., & Calvet, N. 1994, ApJ, 426, 669 [Google Scholar]
- Henning, T., Kamp, I., Samland, M., et al. 2024, PASP, 136, 054302 [NASA ADS] [CrossRef] [Google Scholar]
- Ilee, J. D., Fairlamb, J., Oudmaijer, R. D., et al. 2014, MNRAS, 445, 3723 [Google Scholar]
- Isella, A., & Natta, A. 2005, A&A, 438, 899 [NASA ADS] [CrossRef] [EDP Sciences] [Google Scholar]
- Jang, H., Arabhavi, A. M., Kaeufer, T., et al. 2025, A&A, 703, A53 [NASA ADS] [CrossRef] [EDP Sciences] [Google Scholar]
- Kaeufer, T., Waters, R., Gasman, D., et al. 2026, MNRAS, 545, staf2056 [Google Scholar]
- Kamp, I., Thi, W.-F., Woitke, P., et al. 2017, A&A, 607, A41 [NASA ADS] [CrossRef] [EDP Sciences] [Google Scholar]
- Kanwar, J., Woitke, P., Kamp, I., Rimmer, P., & Helling, C. 2025, A&A, 698, A294 [NASA ADS] [CrossRef] [EDP Sciences] [Google Scholar]
- Kamp, I., Henning, T., Arabhavi, A. M., et al. 2023, Faraday Discuss., 245, 112 [NASA ADS] [CrossRef] [Google Scholar]
- Klarmann, L., Benisty, M., Min, M., et al. 2017, A&A, 599, A80 [NASA ADS] [CrossRef] [EDP Sciences] [Google Scholar]
- Koenigl, A. 1991, ApJ, 370, L39 [Google Scholar]
- Kraus, M., Oksala, M. E., Cidale, L. S., et al. 2015, ApJ, 800, L20 [Google Scholar]
- Lesur, G., Flock, M., Ercolano, B., et al. 2023, in Astronomical Society of the Pacific Conference Series, 534, Protostars and Planets VII, eds. S. Inutsuka, Y. Aikawa, T. Muto, K. Tomida, & M. Tamura, 465 [Google Scholar]
- McClure, M. K., Van’t Hoff, M., Francis, L., et al. 2025, Nature, 643, 649 [Google Scholar]
- McElroy, D., Walsh, C., Markwick, A. J., et al. 2013, A&A, 550, A36 [NASA ADS] [CrossRef] [EDP Sciences] [Google Scholar]
- Meijerink, R., Pontoppidan, K. M., Blake, G. A., Poelman, D. R., & Dullemond, C. P. 2009, ApJ, 704, 1471 [Google Scholar]
- Mikhailenko, S., Kassi, S., Mondelain, D., & Campargue, A. 2020, JQSRT, 245, 106840 [Google Scholar]
- Min, M., Dullemond, C. P., Kama, M., & Dominik, C. 2011, Icarus, 212, 416 [Google Scholar]
- Najita, J., Carr, J. S., & Mathieu, R. D. 2003, ApJ, 589, 931 [NASA ADS] [CrossRef] [Google Scholar]
- Najita, J. R., Edwards, S., Basri, G., & Carr, J. 2000, in Protostars and Planets IV, eds. V. Mannings, A. P. Boss, & S. S. Russell, 457 [Google Scholar]
- Najita, J. R., Carr, J. S., Glassgold, A. E., & Valenti, J. A. 2007, in Protostars and Planets V, eds. B. Reipurth, D. Jewitt, & K. Keil, 507 [Google Scholar]
- Nakatani, R., Hosokawa, T., Yoshida, N., Nomura, H., & Kuiper, R. 2018a, ApJ, 857, 57 [NASA ADS] [CrossRef] [Google Scholar]
- Nakatani, R., Hosokawa, T., Yoshida, N., Nomura, H., & Kuiper, R. 2018b, ApJ, 865, 75 [Google Scholar]
- Natta, A., Prusti, T., Neri, R., et al. 2001, A&A, 371, 186 [NASA ADS] [CrossRef] [EDP Sciences] [Google Scholar]
- Perotti, G., Christiaens, V., Henning, T., et al. 2023, Nature, 620, 516 [NASA ADS] [CrossRef] [Google Scholar]
- Pontoppidan, K. M., Blake, G. A., van Dishoeck, E. F., et al. 2008, ApJ, 684, 1323 [NASA ADS] [CrossRef] [Google Scholar]
- Rab, C., Güdel, M., Woitke, P., et al. 2018, A&A, 609, A91 [NASA ADS] [CrossRef] [EDP Sciences] [Google Scholar]
- Rab, C., Weber, M., Grassi, T., et al. 2022, A&A, 668, A154 [NASA ADS] [CrossRef] [EDP Sciences] [Google Scholar]
- Romanova, M. M., Ustyugova, G. V., Koldoba, A. V., Wick, J. V., & Lovelace, R. V. E. 2003, ApJ, 595, 1009 [Google Scholar]
- Salyk, C., Pontoppidan, K. M., Blake, G. A., et al. 2008, ApJ, 676, L49 [NASA ADS] [CrossRef] [Google Scholar]
- Schöier, F. L., van der Tak, F. F. S., van Dishoeck, E. F., & Black, J. H. 2005, A&A, 432, 369 [Google Scholar]
- Schwarz, K. R., Henning, T., Christiaens, V., et al. 2024, ApJ, 962, 8 [NASA ADS] [CrossRef] [Google Scholar]
- Sternberg, A., Gurman, A., & Bialy, S. 2021, ApJ, 920, 83 [NASA ADS] [CrossRef] [Google Scholar]
- Suzuki, T. K., Muto, T., & Inutsuka, S.-i. 2010, ApJ, 718, 1289 [NASA ADS] [CrossRef] [Google Scholar]
- Thi, W. F., & Bik, A. 2005, A&A, 438, 557 [NASA ADS] [CrossRef] [EDP Sciences] [Google Scholar]
- Thi, W. F., van Dalen, B., Bik, A., & Waters, L. B. F. M. 2005, A&A, 430, L61 [NASA ADS] [CrossRef] [EDP Sciences] [Google Scholar]
- Thi, W. F., Kamp, I., Woitke, P., et al. 2013, A&A, 551, A49 [NASA ADS] [CrossRef] [EDP Sciences] [Google Scholar]
- Thi, W. F., Hocuk, S., Kamp, I., et al. 2020, A&A, 635, A16 [NASA ADS] [CrossRef] [EDP Sciences] [Google Scholar]
- Tuthill, P. G., Monnier, J. D., & Danchi, W. C. 2001, Nature, 409, 1012 [NASA ADS] [CrossRef] [Google Scholar]
- Woitke, P., Kamp, I., & Thi, W.-F. 2009, A&A, 501, 383 [NASA ADS] [CrossRef] [EDP Sciences] [Google Scholar]
- Woitke, P., Helling, C., Hunter, G. H., et al. 2018a, A&A, 614, A1 [NASA ADS] [CrossRef] [EDP Sciences] [Google Scholar]
- Woitke, P., Min, M., Thi, W. F., et al. 2018b, A&A, 618, A57 [NASA ADS] [CrossRef] [EDP Sciences] [Google Scholar]
- Woitke, P., Kamp, I., Antonellini, S., et al. 2019, PASP, 131, 064301 [NASA ADS] [CrossRef] [Google Scholar]
- Woitke, P., Thi, W. F., Arabhavi, A. M., et al. 2024, A&A, 683, A219 [NASA ADS] [CrossRef] [EDP Sciences] [Google Scholar]
- Yurchenko, S. N., Tennyson, J., Syme, A.-M., et al. 2022, MNRAS, 510, 903 [Google Scholar]
- Zsom, A., Sándor, Zs., & Dullemond, C. P. 2011, A&A, 527, A10 [NASA ADS] [CrossRef] [EDP Sciences] [Google Scholar]
Version 3, Revision: 605e5c51 2025/08/04.
All Tables
All Figures
|
Fig. 1 Chemical-relaxation timescale, τchem (top), and cooling-relaxation timescale, τcool (bottom), for our model including a dust-free inner environment. The dashed blue line indicates where the visual extinction reaches unity (AV = 1). |
| In the text | |
|
Fig. 2 Gas and dust density of a typical ProDiMo Herbig disk model. The red hatched area is generally not modeled as it is beyond the expected dust rim at 0.3 au. The dashed blue line indicates where the visual extinction reaches unity (AV = 1), the white dashed contours align with the values on the color bar. The dashed yellow line indicates where n⟨H⟩ = 1012 cm−3. |
| In the text | |
|
Fig. 3 Gas density, dust density, and dust-to-gas ratio of our model with the dust-depleted inner disk included. The vertical dotted red line indicates where the standard model is cut. The dashed blue line indicates where the visual extinction reaches unity (AV = 1), the dashed white contours align with the values on the color bar, and the dashed red contour in the bottom panel indicates the outer boundary of the dust-depleted inner disk. The dashed yellow line indicates where n⟨H⟩ = 1012 cm−3. |
| In the text | |
|
Fig. 4 Top panel shows the temperature profile of a standard ProDiMo model and the bottom shows the temperature profile of our model that includes a dust-depleted inner disk and increased inner-disk gas-phase elemental abundances (see Table 2). The dashed blue line indicates where the visual extinction reaches unity (AV = 1); the white contours show the gas temperatures of 100, 1000, and 10 000 K. The vertical red line indicates where the temperature is analyzed in Fig. 5 and the red dot is the grid point at which the chemistry is analyzed (Fig. 6). |
| In the text | |
|
Fig. 5 Vertical cut of the 2D disk at r = 0.165 au, showing the gas temperature and molecular abundances with respect to the gas and number density. The left axis indicates the gas temperature, and the right axis shows the relative molecular abundance for selected species important to the heating and cooling balance. The midplane is the left y-axis at ρgas ≈ 2.15 × 10⁻¹⁰ [g cm−3]. |
| In the text | |
|
Fig. 6 Reaction network of steady-state chemistry at r = 0.165 au and z = 0.0061 au, where Tgas = 780 K. The abundances for the species marked in blue are shown in Fig. 7, and their formation and destruction reactions are described in more detail and shown in Table 3, 4, 5 & 6. |
| In the text | |
|
Fig. 7 Abundances of H2, CO, H2O, and SiO for the model with solar-abundance gas-phase abundances in the inner disk. The purple contour shows where the gas temperature is 1000 K, the red contour shows where the dusty disk starts, and the dashed blue line indicates where the visual extinction reaches unity (AV = 1). The red dot indicates the grid point at which the chemistry was analyzed. |
| In the text | |
|
Fig. 8 Escape probability spectra showing the first CO overtone lines. This model includes dust depletion and elemental enrichment in the inner disk and was convolved using a spectral resolving power of 3000. |
| In the text | |
|
Fig. 9 Escape probability spectra showing the H2O and CO lines between 4.6 and 6 μm. This model includes dust depletion and elemental enrichment in the inner disk and was convolved using a spectral resolving power of 3000. |
| In the text | |
|
Fig. 10 Escape probability spectra from our disk model showing the first SiO overtone lines originating from the dust-depleted inner disk of a model with and without elemental enhancement convolved using a spectral resolving power of 3000. The black line shows the combined spectra of molecules in the model, and the colors indicate how much of the flux originates from specific molecules. |
| In the text | |
|
Fig. 11 Atomic hydrogen abundance, with the 1000 K temperature contour in purple. In green we show the radial hydrogen column density contours for 1019, 1021, 1022, and 1023 cm−2. |
| In the text | |
Current usage metrics show cumulative count of Article Views (full-text article views including HTML views, PDF and ePub downloads, according to the available data) and Abstracts Views on Vision4Press platform.
Data correspond to usage on the plateform after 2015. The current usage metrics is available 48-96 hours after online publication and is updated daily on week days.
Initial download of the metrics may take a while.