Fig. 7
Download original image
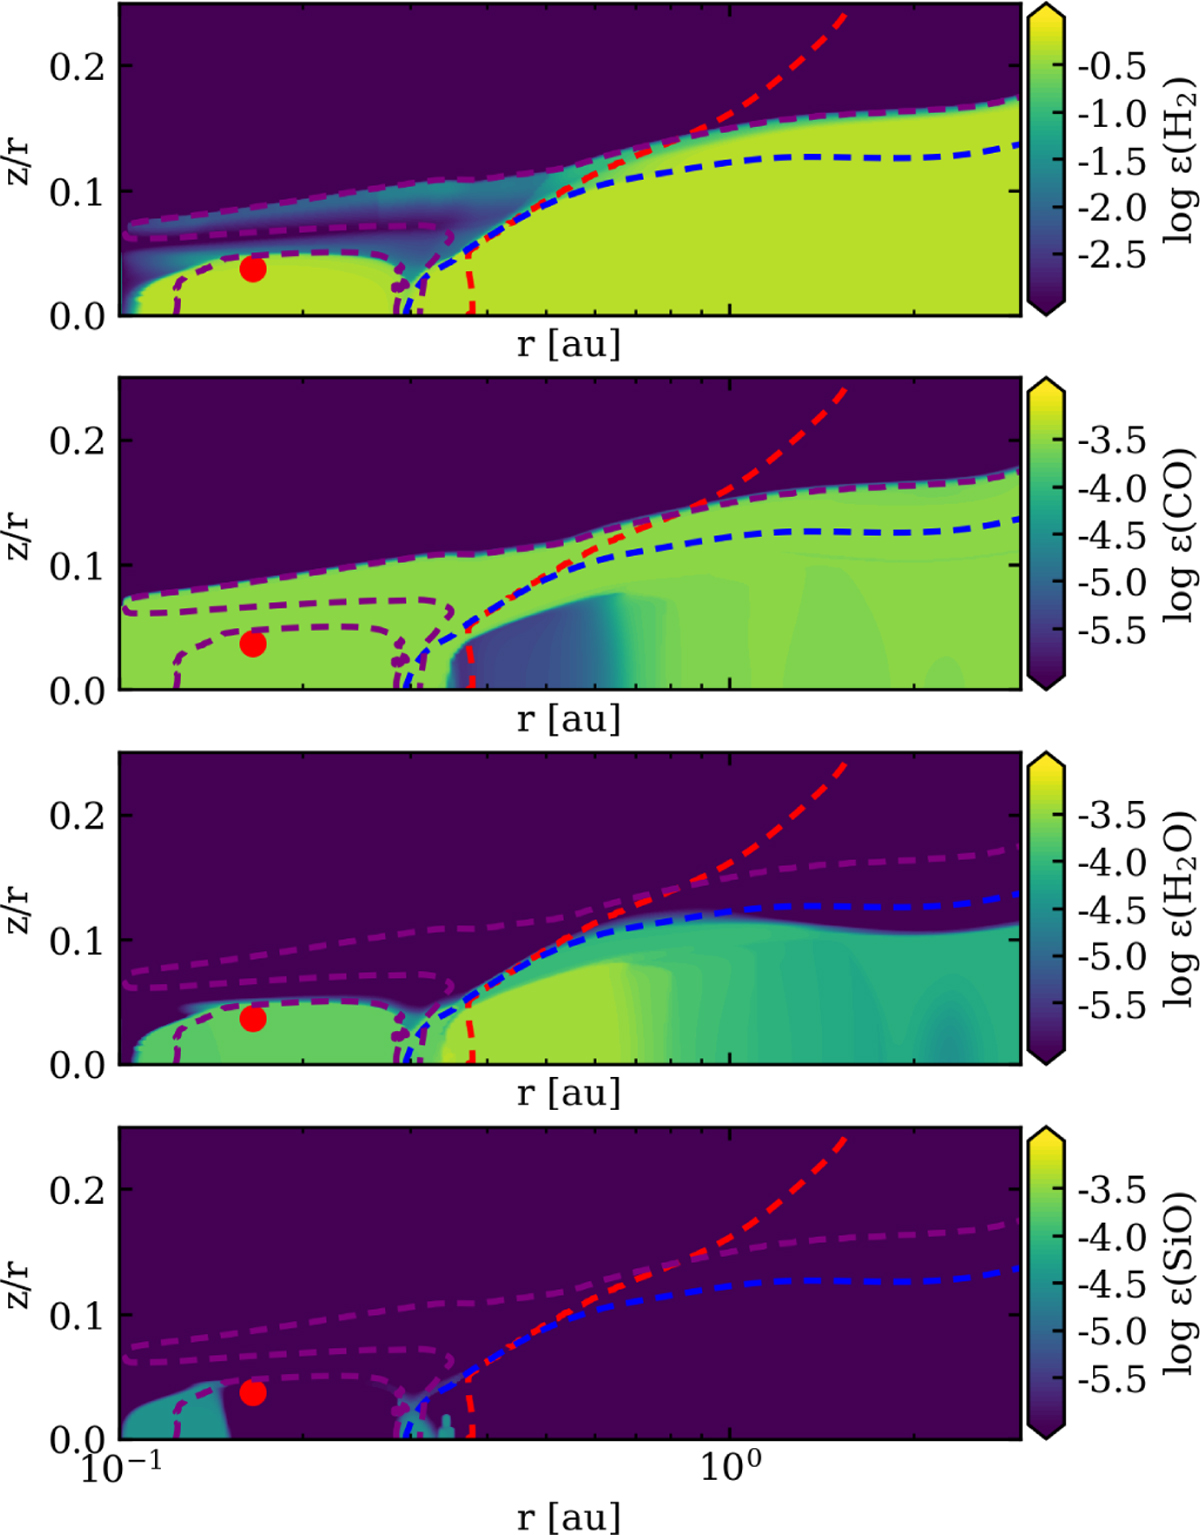
Abundances of H2, CO, H2O, and SiO for the model with solar-abundance gas-phase abundances in the inner disk. The purple contour shows where the gas temperature is 1000 K, the red contour shows where the dusty disk starts, and the dashed blue line indicates where the visual extinction reaches unity (AV = 1). The red dot indicates the grid point at which the chemistry was analyzed.
Current usage metrics show cumulative count of Article Views (full-text article views including HTML views, PDF and ePub downloads, according to the available data) and Abstracts Views on Vision4Press platform.
Data correspond to usage on the plateform after 2015. The current usage metrics is available 48-96 hours after online publication and is updated daily on week days.
Initial download of the metrics may take a while.