Fig. 4
Download original image
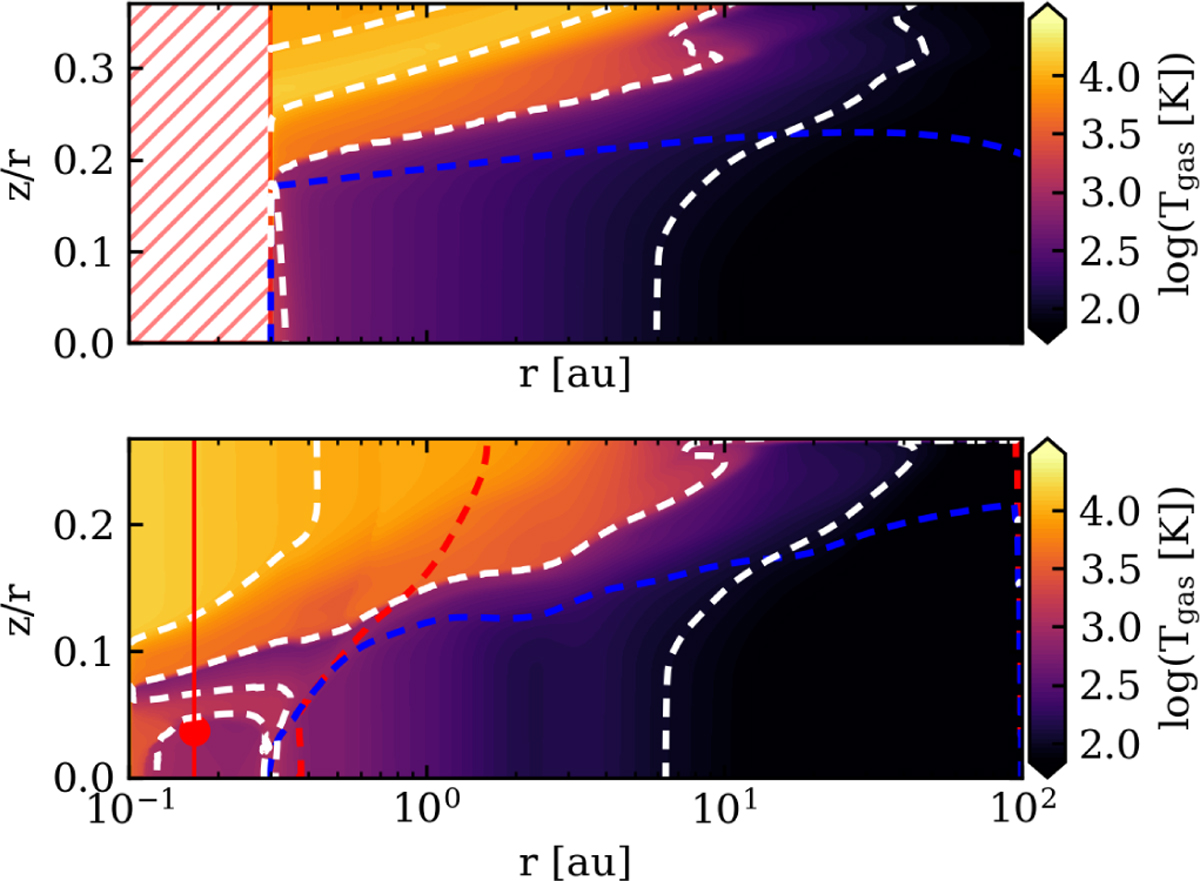
Top panel shows the temperature profile of a standard ProDiMo model and the bottom shows the temperature profile of our model that includes a dust-depleted inner disk and increased inner-disk gas-phase elemental abundances (see Table 2). The dashed blue line indicates where the visual extinction reaches unity (AV = 1); the white contours show the gas temperatures of 100, 1000, and 10 000 K. The vertical red line indicates where the temperature is analyzed in Fig. 5 and the red dot is the grid point at which the chemistry is analyzed (Fig. 6).
Current usage metrics show cumulative count of Article Views (full-text article views including HTML views, PDF and ePub downloads, according to the available data) and Abstracts Views on Vision4Press platform.
Data correspond to usage on the plateform after 2015. The current usage metrics is available 48-96 hours after online publication and is updated daily on week days.
Initial download of the metrics may take a while.