| Issue |
A&A
Volume 699, July 2025
|
|
|---|---|---|
| Article Number | A373 | |
| Number of page(s) | 12 | |
| Section | Interstellar and circumstellar matter | |
| DOI | https://doi.org/10.1051/0004-6361/202554959 | |
| Published online | 23 July 2025 | |
Inner disc and circumplanetary material in the PDS 70 system: Insights from multi-epoch, multi-frequency ALMA observations
1
Université Côte d’Azur, Observatoire de la Côte d’Azur, CNRS, Laboratoire Lagrange,
France
2
Max-Planck-Institut für Astronomie,
Königstuhl 17,
69117
Heidelberg,
Germany
3
Departamento de Astronomía, Universidad de Chile,
Camino El Observatorio 1515,
Las Condes, Santiago,
Chile
4
Dipartimento di Fisica, Università degli Studi di Milano,
Via Celoria 16,
Milano,
Italy
5
National Astronomical Observatory of Japan,
2-21-1 Osawa, Mitaka,
Tokyo
181-8588,
Japan
6
Department of Astronomical Science, The Graduate University for Advanced Studies,
SOKENDAI, 2-21-1 Osawa, Mitaka,
Tokyo
181-8588,
Japan
7
Mullard Space Science Laboratory, University College London,
Holmbury St Mary, Dorking,
Surrey
RH5 6NT,
UK
8
Center for Astrophysics, Harvard & Smithsonian,
60 Garden Street,
Cambridge,
MA
02138,
USA
9
Department of Astronomy, University of Florida,
Gainesville,
FL
32611,
USA
10
Department of Physics and Astronomy, Rice University,
6100 Main Street, MS-108,
Houston,
TX
77005,
USA
11
Department of Earth, Atmospheric, and Planetary Sciences, Massachusetts Institute of Technology,
Cambridge,
MA
02139,
USA
★ Corresponding author: This email address is being protected from spambots. You need JavaScript enabled to view it.
Received:
1
April
2025
Accepted:
4
June
2025
Abstract
Context. The two giant protoplanets directly detected in the dust-depleted cavity of PDS 70 offer a unique opportunity to study the processes of ongoing planet formation. The planets have been detected both in IR thermal light and in the Hα line, indicating that they are actively accreting material from their surroundings.
Aims. We calibrated and analysed archival Atacama Large Millimeter/subMillimeter Array (ALMA) band 6 and 7 observations of PDS 70 to detect circumplanetary material in independent datasets taken at different epochs in 2019, 2021, and 2023 and assess its possible motion.
Methods. We performed 2D visibility modelling of the high-resolution ALMA band 6 (∼0.11′′ × 0.08′′) and band 7 (∼0.05′′ × 0.05′′) dust continuum emission of the outer disc. After subtracting the model from the data, we imaged the dust continuum emission in the cavity of PDS 70 at multiple epochs.
Results. We re-detect the compact dust emission around PDS 70 c in all our datasets in band 6 and 7, with a more than 3.8σ significance, and tentatively detect compact emission around PDS 70 b at ∼3σ in the band 6 datasets, with a peak emission of 59 ± 17 μJy/beam and 46 ± 14 μJy/beam. We find the astrometric relative position of the compact emission around PDS 70 c to be consistent with the expected position of the planet in the 2019–2023 time range. We measure a peak flux difference of up to 64 ± 34 μJy/beam at a 1σ confidence level for the continuum emission coming from the region around PDS 70 c and perform a Bayesian test on our measurements, finding that they are not consistent with significant variable emission. We find no evidence of flux variability in the inner disc. We measure the dust mass of the material co-located with PDS 70 c and the inner disc to be in the range of 0.008−0.063 M⊕ and 0.04−0.31 M⊕, respectively, consistent with previous measurements. Additionally, we obtain band 6–7 spectral indices of 2.5 ± 1.2 and 3.2 ± 0.5 for the dust emission around PDS 70 c and in the inner disc, respectively, suggesting the inner disc emission is dominated by optically thin dust.
Key words: planets and satellites: formation / protoplanetary disks / planet-disk interactions
© The Authors 2025
 Open Access article, published by EDP Sciences, under the terms of the Creative Commons Attribution License (https://creativecommons.org/licenses/by/4.0), which permits unrestricted use, distribution, and reproduction in any medium, provided the original work is properly cited.
This article is published in open access under the Subscribe to Open model. This email address is being protected from spambots. You need JavaScript enabled to view it. to support open access publication.
1 Introduction
In the past decade, observing facilities like the Very Large Telescope (VLT) and the Atacama Large Millimeter/submillimeter Array (ALMA) and detection techniques have pushed forward the field of planet formation by unveiling an astounding variety of substructures in protoplanetary discs, such as gaps, spirals, rings, and clumps (Garufi et al. 2018; Long et al. 2018a; Andrews 2020; Benisty et al. 2023). A possible interpretation for the origin of these substructures consists of newly born planets still forming in protoplanetary discs and interacting with them (Bae et al. 2023; Paardekooper et al. 2023). However, many of those substructures have only remained speculatively associated with planets, as the direct detection of planets has remained challenging, with most candidate detections still debated (e.g., Currie et al. 2017; Rameau et al. 2017). So far only two protoplanets are firmly confirmed and are hosted in the cavity of the transition disc of PDS 70 (Haffert et al. 2019). With a mass of 0.8 M⊙ and an age of 5.4 Myr (Müller et al. 2018), PDS 70 is a T Tauri star situated in the Upper Centaurus Lupus association (Pecaut & Mamajek 2016), at a distance of 112.4 pc (Gaia Collaboration 2021). The two giant protoplanets, PDS 70 b and c, have been detected through multiple tracers, confirming the planetary nature of their emission (Keppler et al. 2018; Müller et al. 2018; Close et al. 2025), making PDS 70 an ideal system with which to directly study the interaction between the planets and the hosting disc (Bae et al. 2019; Toci et al. 2020).
Summary of the data used in this work.
The disc surrounding PDS 70 shows a cavity, an outer ring with an inner shoulder, and an over-brightness in the millimetre regime in the north-west (Hashimoto et al. 2012; Long et al. 2018b; Keppler et al. 2019; Doi et al. 2024). Additionally, it features millimetre emission co-located with PDS 70 c, interpreted as a compact circumplanetary disc (CPD), and diffuse dust emission detected around PDS 70 b (Isella et al. 2019; Benisty et al. 2021). Based on the same observations, the system shows variability in the morphology of the inner disc (Casassus & Cárcamo 2022) as well as in the small dust reservoir of the inner disc, as is shown by the spectral analysis of the James Webb Space Telescope (JWST) and Spitzer data performed by Jang et al. (2024); Perotti et al. (2023); Liu et al. (2025). The inner disc emission is suggestive of dust filtration from the outer ring to the innermost regions of the system, with the largest grains trapped in the ring pressure maxima and the smaller grains able to filter through the gap and replenish the inner disc, as is shown in the models from Pinilla et al. (2024).
In this paper, we present new high-angular-resolution ALMA band 6 (∼0.15 × 0.09′′) and 7 (∼0.07 × 0.06′′) observations of PDS 70. With these new data, obtained at multiple epochs, we aim to re-detect and confirm the presence of the emission colocated with the planets and measure its relative astrometric motion compared to the expected planets’ motion. In order to perform these measurements, we provide a detailed model of the outer disc, fitting for the geometrical and morphological properties of the disc in the visibility plane. Additionally, we analyse the continuum properties of the emission inside the cavity of PDS 70, providing estimates of the dust masses and the spectral index associated with the CPD around PDS 70 c and the inner disc.
This paper has the following structure. In Sect. 2, we present the observations and describe the calibration procedure. In Sect. 3, we introduce the methods we used to model the data, while in Sect. 4 we present our results and in Sect. 5 we discuss them. We summarise our findings in Sect. 6.
2 Observations
This work makes use of multiple datasets from different ALMA programmes, which we categorised based on their observing frequency and the date of their long-baseline (LB) observations.
Since our primary focus is to spatially resolve the compact emission around planet c and study its motion, we focus on the LB observations taken within one month. We do not apply the same restriction to the short-baseline (SB) observations as they do not spatially resolve the emission in the vicinity of the planets. A summary of all datasets used in this study is shown in Table 1, while Table A.1 in the appendix provides the observing log for the new ALMA datasets presented in this work for the first time. We performed the calibration using version 6.2.1.7 of the CASA software (CASA Team et al. 2022).
Combining all available band 7 programmes, we built three blocks of data, which we label ‘B7 2019’, ‘B7 2021’, and ‘B7 2023’. B7 2019 uses LB data taken in 2019 and short baselines taken in 2016. B7 2021 combines SB and LB data taken in July and August 2021. Finally, B7 2023 includes SB and LB data taken in March and June 2023, respectively. In band 6, we use two blocks of data, ‘B6 2021 LF’ with a median frequency of 220 GHz with LB data taken in July 2021 and SB data taken in March 2020, and ‘B6 2021 HF’ corresponding to a median frequency of 260 GHz, with LB data taken in June 2021 and SB data taken in March 2020. We detail the calibration procedure for all ALMA programmes below and refer to Table 1 for the combination of programmes that constitute the blocks of data described above.
Band 7: the calibration of data from 2015.1.00888.S and 2018.A.00030.S to build B7 2019 is described in Benisty et al. (2021), and for 2022.1.01695.S in Rampinelli et al. (2025). For data from 2018.1.01774.S and 2021.1.00782.S, we followed the iterative self-calibration following the exoALMA pipeline (Loomis et al. 2025). First, spectral regions covering the following lines: 13CO (3 − 2, v = 330.59 GHz), CS (7 − 6, v = 342.88 GHz), HC15N (4 − 3, v = 344.20 GHz), SO (88 − 77, v = 344.31 GHz), H13 CN (4 − 3, v = 345.34 GHz), and 12CO (3 − 2, v = 345.80 GHz), were flagged and the remaining channels were averaged. Then, an initial phase-only self-calibration was applied for each execution block (EB) and all EBs were aligned using the exoALMA alignment procedure (Loomis et al. 2025), which regrids the EBs onto a common u v grid with natural weighting, retaining only overlapping grid cells and applying phase shifts to minimise visibility differences. The EBs with a total flux deviation of >4% were rescaled to the total flux measured in the SB EB with the highest signal-to-noise ratio (S/N). The SB EBs were concatenated and four rounds of phase-only self-calibration were executed with solution intervals progressively shortened from the full EB duration to 360s, 120s, and finally 60s. All EBs including the longer baselines were then combined. Five rounds of phase-only self-calibration were similarly applied by progressively reducing the solution interval from the full EB duration down to 30s. Finally, after CLEANing down the data to the 1σ threshold using the tclean() task of the CASA software (Högbom 1974; Cornwell 2008), amplitude and phase self-calibration were performed with an EB-long solution interval. As is shown in Table 1, the 2018.1.01774.S and 2021.1.00782 data were then combined with other datasets to form the B7 2021 and B7 2023 data blocks.
We proceeded similarly for programme 2019.1.01138.S (single EB). As a first step, spectral lines in the band 7 frequency range were flagged (Rampinelli et al. 2025): HC15N (4−3, v = 344.20 GHz), SO (88−77, v = 344.31 GHz), H13 CN (4−3, v = 345.34 GHz), HCN (4−3, v = 354.51 GHz), 12CO (3−2, v = 345.80 GHz), and HCO+ (4−3, v = 356.73 GHz). The remaining unflagged data were then averaged into 250 MHz-wide channels. An initial phase-only self-calibration round over the entire EB duration was applied to the EB, combining all scans and spectral windows.
To build the B7 2021 block, the July 2021 EB from 2018.1.01774.S was then aligned with the 2019.1.01138.S EB using the exoALMA alignment procedure (Loomis et al. 2025). No flux rescaling was applied, as total flux differences remained within 4%, accounting for the slight frequency offset between the two programmes (mean frequency of 338 GHz for 2018.1.01774.S and 350 GHz for 2019.1.01138.S). The two EBs were then concatenated, and phase-only self-calibration was applied in multiple rounds, progressively shortening the solution intervals (EB-long, 360s, 120s, 60s, 30s, 18s). After this, the data were cleaned down to 1σ, and two rounds of amplitude and phase self-calibration were performed, combining polarisations and spectral windows. The first round used EB-long solution intervals, while the second used scan-long intervals.
To build B7 2023, the SB datasets from programme 2021.1.00782.S were combined with the LB data from programme 2022.1.01695.S following a similar procedure for the alignment as is described above. No flux rescaling applied, as total flux differences remained within 4%, accounting for the slight frequency offset (mean frequency of 338 GHz for 2021.1.00782.S and 350 GHz for 2022.1.01695.S).
Band 6: for the band 6 datasets, the calibration procedures are detailed in Facchini et al. (2021), Law et al. (2024), and Rampinelli et al. (2024). These datasets include two distinct spectral set-ups: a lower-frequency one at ∼220 GHz (B6 2021 LF) and a higher-frequency set-up centred at ∼260 GHz (B6 2021 HF).
Finally, all datasets were averaged to one channel per spectral window and binned into 30s time intervals. They were then all aligned using the exoALMA alignment procedure (Loomis et al. 2025), with the B7 2023 dataset serving as the reference.
3 Methods
As the emission of the cavity is faint and partly overlapping with the outer disc, we first modelled the outer disc. After subtracting the model from the data, we obtained residual maps that contain a clear signal from the cavity. We characterised the morphological structure of the continuum emission with the code galario (Tazzari et al. 2018), fitting the visibility data assuming a 2D parametric intensity model and following a Markov chain Monte Carlo (MCMC) approach implemented with the package emcee (Foreman-Mackey et al. 2013). Following this procedure, we can constrain both the geometrical parameters of the outer disc, specifically the inclination, i, the position angle, PA, and the offsets (ΔRA, ΔDec) between the disc and the phase centres, as well as the morphological parameters specific to the chosen model.
We defined our model brightness distribution as follows:
 (1)
(1)
where GR(f, r, σ) is an axisymmetric Gaussian ring centred in r with a radial width, σ, and peak flux, f, while GA(f, r, σr, θ, σθ) is a Gaussian arc centred in (r, θ) with a radial width, σr, azimuthal width, σθ, and peak flux, f. We considered two Gaussian components to model the outer ring in order to replicate the inner shoulder seen in the observations, while we used the arc to reproduce the overdensity in the north-west of the ring.
We performed a preliminary exploration of the parameter space with emcee using uniform priors, sampling all the parameters linearly with the exception of f1, f2, and  , which were sampled logarithmically. As an initial step we used 100 walkers over ∼103 steps. We then set the best fit parameters, computed as the median of the posterior distribution from this preliminary exploration, as initial guesses for the fiducial emcee run. For each dataset we set up 250 walkers and 104 steps. We discarded the first 25% steps as burn-in. We show the full set of best fit parameters in Table B.1 and report the adopted priors in Appendix B. We then subtracted the best-fit galario model evaluated at the same uv points of the observations from the observed data in order to obtain the residuals. We assumed that the uncertainties introduced with this subtraction were dominated by the ALMA flux uncertainties that we discuss in Sect. 4. Additionally, we performed a test run with 100 walkers and 1000 steps on the B7 2019 dataset, adding a central Gaussian, G(f0, σr,0), to our model. We checked that the resulting best-fit parameters were within 1σ uncertainties of the ones obtained in our fiducial run, which implies that the errors introduced by not fitting for the inner disc in our models are negligible.
We imaged the data, the best-fit galario model, and the residuals for each dataset using the tclean() task of the CASA software using a robust parameter of 1.0 (B7 2019, B7 2021) and 0.0 (B7 2023, B6 2021 LF, B6 2021 HF), chosen to provide the best balance between resolution and sensitivity, and produced 1024 × 1024 pixels images with a pixel size of 0.01′′ in band 7 and 512 × 512 pixels images with a pixel size of 0.02′′ in band 6. To avoid negative point-source components in the CLEAN models, we created tailored masks for each image around the 3σ contours of the outer ring, inner disc, and the compact emission co-located with PDS 70 c and CLEANed the images down to 1σ using a very conservative gain parameter of 0.02. Our fiducial images have the following resolutions (in mas): B7 2019, 52x45; B7 2021, 60x45; B7 2023, 72x62; B6 2021 LF, 115x89; and B6 2021 HF, 110x79 (see Table 2).
In the following, when measuring the peak intensity we estimate its uncertainty by adding in quadrature the Root Mean Square (RMS) noise of the image together with the 10% ALMA flux calibration error for band 6 and 71. When measuring flux densities in a given region, instead, we measure the flux density in the same area centred on random locations outside of the disc emission and compute the standard deviation, according to the procedure presented in Rampinelli et al. (2024), and add it in quadrature to the 10% ALMA flux calibration error.
Disc continuum properties and geometrical parameters.
4 Results
We show in Fig. 1 the main results of the continuum analysis. In the left column we present the continuum images for all datasets. We report the main continuum properties together with the disc geometrical parameters in Table 2. The values we find for the inclination and the position angle are within 1∘ of the ones obtained in Keppler et al. (2019); Benisty et al. (2021); Aizawa et al. (2024), with this difference most likely due to the different methodologies used. Benisty et al. (2021) also estimate an offset of ΔRA = 12 mas and ΔDec = 15 mas using frank (Jennings et al. 2020), similar to the values Aizawa et al. (2024) obtain with their methodology. Both methods assume the disc emission to be axisymmetric, which might explain the discrepancy with the offsets (ΔRA, ΔDec) we obtain from our 2D fit. In all our datasets we observe the well-known structure of PDS 70: a cavity, an outer ring with an inner shoulder, and an asymmetric overbrightness in the north-west. However, the band 6 datasets also show the presence of a fainter overbrightness in the south-west of the outer ring. While the morphological structure of the ring appears unchanged at different epochs, the emission in the cavity, seen in an inset for each plot, shows a variable morphology. This can be in part explained by the S/N inside the cavity, defined as the ratio of the inner disc peak emission and the image RMS, for the 2021 dataset, which is ∼35 and ∼50% lower than the S/N of the 2019 and 2023 datasets, respectively, and the different beam size in the 2023 dataset. In the middle and right columns, we show the CLEAN images of the galario model and residuals. The residual images should be interpreted differently in two distinct spatial regions, the outer ring and the cavity, which are indicated using the 7σ contours of the continuum emission from the observations. The residuals in the outer disc show deviations from our disc model, while the residuals in the cavity provide information on the emission from the inner disc and the dust in the vicinity of the two planets.
Outer ring. The best-fit models for the outer ring feature a broad ring at r1 ∼ 0.64−0.68′′ (72−77 au) with a radial halfwidth of σ1 ∼0.07−0.09′′ (8−10 au), a narrow ring centred in r2 ∼ 0.47−0.50′′ (53−56 au) with a radial half-width of σ2 ∼ 0.03−0.06′′ (3−7 au), representing the shoulder, and an arc at  ∼ 0.63−0.70′′(71−79 au) and
  ∼ 135−142∘, which accounts for the asymmetric emission (see Table B.1). Here we note that an azimuthal shift of 7 deg from the 2019 to the 2023 epoch matches the Keplerian speed of PDS 70 c, suggesting that this substructure might be related to the planet.
Most of the residuals in the outer ring of the B7 2019 and 2021 datasets are lower than 3σ, showing that our model is able to explain the global structure of the outer disc of PDS 70. The B7 2023 and both B6 2021 datasets, instead, show stronger residuals along the major axis. Our results are consistent with the analysis of PDS 70 presented in Aizawa et al. (2024), in which they first apply an axisymmetric model to the emission of the disc and then fit a parametric model to the asymmetry in the residuals, finding a similar pattern of positive and negative residuals in the region surrounding the asymmetry. We note in all our datasets the presence of strong (>5σ) residuals colocated with the asymmetry in the north-west. These residuals are characterised by multiple positive and negative peaks up to ∼6σ (B7 2021), ∼7σ (B7 2019), ∼9σ (B7 2023, B6 2021 LF), and ∼11σ (B6 2021 HF). This implies that the morphology of the asymmetry is more complex than a simple 2D Gaussian in the radial and azimuthal direction. After convolving the three band 7 images with a Gaussian beam to the resolution of the B7 2023 dataset using the imsmooth task of the CASA software, we checked that the morphology of the residuals is consistent across the different epochs on a qualitative level, with the main differences most likely due to the different uv coverage of the datasets. Additionally, both B6 datasets show similarly strong (∼10σ) localised residuals in the south-west of the outer ring. The presence of these residuals localised only around the semimajor axis can possibly be explained as an optical depth effect arising in inclined discs (Doi & Kataoka 2021).
Circumplanetary material. In Fig. 2 we show the residuals inside the cavity. We detect compact dust emission co-located with PDS 70 c (csmm for brevity) in all our datasets with at least a 5σ significance for band 7 and a 3.8σ significance for band 6. As previous publications were based on the same datasets, this allows one to re-detect with independent and new datasets the presence of dust in the vicinity of the planets, confirming previous observations (Isella et al. 2019; Benisty et al. 2021; Casassus et al. 2021). The compact source, csmm, is unresolved in all the datasets at the resolution of our observations, consistent with it originating in a compact object. We report the continuum properties of csmm in Table 3. For the B7 2019 dataset, we measure a peak flux emission of 94 ± 18 μJy/beam, compatible within 1σ with the value of 81 ± 5 μJy/beam obtained for the dataset LB19+SB16 by Benisty et al. (2021), where our larger uncertainty takes into account the ALMA flux calibration errors. We then quantified the variability of csmm across the different epochs in band 7, using the peak intensity as the emission is unresolved. In order to perform a consistent comparison between the different datasets, we first used the task imsmooth of the CASA software to convolve the images with a Gaussian beam to the resolution of the B7 2023 images. We measure a peak intensity for csmm of 88 ± 17 μJy/beam, 153 ± 29 μJy/beam, and 127 ± 23 μJy/beam for B7 2019, B7 2021, and B7 2023, respectively, within 1σ error bars of the estimates from our fiducial images. Thus, we measure a tentative (∼2σ) peak intensity variability of 64 ± 34 μJy/beam between the 2019 and 2021 epochs, and a peak intensity difference of −26 ± 37 μJy/beam and 39 ± 29 μJy/beam between the 2021, 2023 and 2019, 2023 epochs, respectively. However, as these values are taken at a 1σ confidence level, they can still be compatible with no variable emission. We additionally performed a Bayesian test using emcee, assuming that the peak intensity of csmm is a constant value, F0, across the three epochs and considering the presence of an excess noise, σ0, so that the uncertainty of each peak flux measurement is given by  , with σi, obs the uncertainty of the measured peak flux. If our measurements are compatible with a constant flux, we expect to find σ0 = 0, whether a non-zero σ0 would indicate the presence of variability. We set up emcee with 100 steps and let it run for 4000 steps, sampling F0 linearly and σ0 logarithmically, with priors of [90, 200] μJy/beam and [log10 1, log10 1000], respectively. We find 1σ confidence intervals of [101, 133] μJy/beam and [2, 35] for F0 and σ0, respectively, further suggesting that the emission from csmm is not variable.
csmm continuum properties.
Inner disc continuum properties.
Assuming that the emission is optically thin, the dust mass can be estimated following Hildebrand (1983)
 (2)
(2)
where d is the distance to the source, v the observed frequency, Fv the integrated flux density, κv the dust absorption coefficient, Bv the Planck function, and T the temperature of the source. If the emission is optically thick, the mass estimate from Eq. (2) should be considered only as a lower limit. We computed the integrated flux density, Fv, inside an elliptical area with twice the beam semi-major and semi-minor axes centred on the brightest pixel. We followed the same approach as Benisty et al. (2021) to estimate the dust mass of csmm for all of the epochs considered in this work, assuming that the emission is due to either 1 mm or, mimicking the case in which the larger grains are trapped in the ring and only the smaller grains coupled with the gas can flow inside the cavity (Bae et al. 2019), 1 μm dust sized grains. In the former case, we assume a typical dust opacity of 3.63 cm2 g−1 (DSHARP composition, Birnstiel et al. 2018). Otherwise, we consider a dust opacity of 0.79 cm2 g−1 (DSHARP composition, Birnstiel et al. 2018), typically associated with 1 μm particles. We assume a temperature of T = 26 K, considering the contribution of viscous heating and irradiation from the accreting star and planet (for a detailed derivation see Benisty et al. 2021) and find dust masses consistent with the ones obtained by Benisty et al. (2021) (Table 3).
Around PDS 70 b we detect diffuse emission (∼3σ) in the band 7 datasets, as in Benisty et al. (2021). In the band 6 datasets, instead, we marginally detect (∼3σ) for the first time compact emission co-located with the predicted position of PDS 70 b, connected to the inner disc, with a peak emission of 59 ± 17 μJy/beam and 46 ± 14 μJy/beam for B6 2021 LF and B6 2021 HF, respectively. The non-detection of a compact source in band 7 might be associated with a low local spectral index. We provide an upper limit to this spectral index by measuring the peak emission inside the 3σ contours of the compact emission in B6 2021 LF and B6 2021 HF, and in the same region of B7 2021 after smoothing the image with a Gaussian beam to the same resolution of B6 2021 LF using the task imsmooth of the CASA software. We measure a peak intensity of 106 ± 40 μJy/beam in band 7, and compute a conservative 3σ spectral index upper limit2 of α < 3.0 and α < 5.8 for the lower and higher frequency band 6 datasets, respectively. However, we note that these upper limits should be treated with care as the compact source is not well separated from the inner disc in band 6 and the emission could be contaminated by material from the inner disc.
Inner disc. We performed the same continuum analysis on the inner disc and report our results in Table 4. In this case the emission is resolved, so we created a single elliptical mask covering the 3σ emission of the inner disc in B7 2023 and applied it to all the band 7 datasets. We repeated the process for band 6 using B6 2021 HF as the reference dataset for the mask. The flux density we obtain for the B7 2019 dataset is within the error bars of the value measured in Benisty et al. (2021). We find no evidence of variability for the inner disc of PDS 70, as our flux density estimates are consistent within the error bars across the different epochs we consider. We measured the dust mass of the inner disc following the same procedure we used for csmm, considering an average temperature of T = 22 K from the model used in Benisty et al. (2021). Our estimates are consistent with the range 0.08−0.36 M⊕ reported in Benisty et al. (2021), with the dust masses extracted from the band 6 observations being roughly half of the ones from band 7. In Fig. 2 we visually compare the morphology of the inner disc by overlaying the 3σ contour of the B7 2023 residuals on all the other datasets. If we approximate the 1σ mask with a Gaussian, the radius of the inner disc is in the range 0.10−0.14 arcsec (11−16 au), with the B7 2021 datasets likely underestimating the extent of the inner disc due to the lower S/N and the band 6 featuring a slightly larger extent compared to the other datasets, probably due to the lower angular resolution. Casassus & Cárcamo (2022) report two clumps in the inner disc at 0.03–0.04 arcsec (Clump 1) and 0.08 arcsec (Clump 2) at two different epochs (2017 and 2019). We re-detect Clump 1 at ∼7σ and Clump 2 at ∼4σ in the B7 2019 dataset (see left panel of Fig. C.1). However, we note that subtracting the test model that includes the central Gaussian we do not detect any clump with at least a 3σ significance in the region of the inner disc, similarly to the residuals in Aizawa et al. (2024). Due to the lower S/N of the B7 2021 dataset, a direct comparison with the previous epoch is not straightforward, making it unclear if the morphology of the inner disc is due to noise fluctuations or dust substructures. In the B7 2021 dataset, we do not detect clumps in the regions where we expect to see Clump 1 and Clump 2 assuming Keplerian rotation (Casassus & Cárcamo 2022) (see Appendix C). We do not resolve any clump in the B7 2023 datasets, likely due to the lower angular resolution.
csmm astrometry.
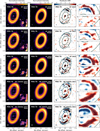 |
Fig. 1 Left to right: continuum images with insets showing a zoom in the cavity; CLEANed galario model images; CLEANed residual images; zoom on the northern (1) and southern (2) sides of the outer ring residuals. Contours start at 3σ and increase by 1σ. The green ellipses approximate the 7σ contours of the continuum data. The datasets are ordered from band 7 to band 6 and by epoch from top to bottom. |
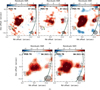 |
Fig. 2 Zoom of the residuals in the cavity from Fig.1. (a) Band 72019 (left panel), 2021 (middle panel), and 2023 (right panel) datasets. (b) Band 62021 datasets at 220 GHz (left panel) and 260 GHz (right panel). The solid contours start from the 3σ emission and increase by 1σ, while the dashed contours correspond to the 3σ emission from the B7 2023 dataset and are overlaid on the other datasets for comparison. The white plus sign marks the centre of the disc, corrected with the galario offset. The green circles and purple diamonds represent the expected position in July 2019 (dark), July 2021 (medium), and May 2023 (light) obtained from the orbital fit of PDS 70 b and c (Wang et al. 2021), respectively. The error bars are smaller than the markers. |
5 Discussion
5.1 csmm astrometry
We can use ALMA interferometric data to compute the position of csmm and a possible motion with time. We focus only on the band 7 datasets for this analysis due to their higher resolution. Although we cannot observe the star or the planets themselves, preventing us from obtaining absolute astrometric measurements, we can still define a relative co-ordinate system. We decided to centre our reference frame on the centre of the disc corrected with the galario offset. In doing so, we assumed that the centre fitted with galario coincides with the location of the star. We computed the expected position of both PDS 70 b and c using the orbital fitting tool3 presented in Wang et al. (2021) and overlay them in Fig. 2. The emission from csmm overlaps with the expected planet positions at all three epochs.
To quantify the possible motion of csmm, we fitted a Gaussian to the CLEANed residual images in the region around csmm using the CASA task imfit and used the co-ordinates of the centre resulting from the fit to estimate its position at different epochs. In Table 5 we report the offset in Right Ascension (RA) and Declination (Dec) of both the expected position of PDS 70 c and the measured position of csmm. The astrometric accuracy of the relative position of csmm between epochs is directly related to the accuracy of the relative alignment between the different datasets. For the angular resolution of our observations, we estimate this accuracy to be within 1 mas, based on the offset uncertainties from our galario best fit models (see Table B.1). To this systematic uncertainty, we added in quadrature the uncertainty related to the identification of the peak of PDS 70 c, which can be computed as θFWHM/S/N/0.9, with the assumption that the emission is close to a point-source, where we consider the full width at half maximum (FWHM) of the beam (θFWHM), the S/N of csmm, and a 0.9 factor to account for a 10% signal decorrelation4. We chose to employ a conservative estimate of this accuracy by considering the S/N of csmm instead of that of the entire image. With a S/N of 6.4, 5.6, and 6.7 and a beam FWHM of 52, 60, and 72 mas for the 2019, 2021, and 2023 datasets, respectively, we find an astrometric accuracy of 9 mas, 12 mas, and 12 mas, respectively. We obtain a total displacement of 35 ± 15 mas (∼2σ significance) between the 2019 and 2021 epochs and 44 ± 15 mas (∼3σ significance) between the 2019 and 2023 epochs, with the peak intensity moving compatibly to the orbital solution of planet c by Wang et al. (2021). We note that Close et al. (2025) report Hα detections of the two planets of PDS 70, with one epoch (2023) overlapping with the ones considered in this work and consistent with the location of csmm. This suggests that csmm is possibly co-moving with the planet, further strengthening the circumplanetary material scenario suggested in Benisty et al. (2021), but further observations at a high angular resolution in a few years will be necessary to confirm such tentative motion.
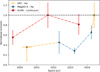 |
Fig. 3 Comparison between the normalised Hα fluxes of PDS 70 c observed with HST (orange diamonds, Zhou et al. 2021, 2025) and MagAO-X (blue diamonds, Close et al. 2025) and the normalised ALMA continuum peak flux of csmm (red dots, this work). The dashed black line highlights the maximum of the normalisation. |
5.2 csmm variability
Recent multi-epoch Hα detections of PDS 70 c using the Hubble Space Telescope (HST) (Zhou et al. 2021, 2025) and the MagAO-X instrument (Close et al. 2025) have shown evidence of variability. Indeed, these measurements have revealed an increase in flux of a factor 2.3 between the 2023 and 2024 epochs observed with the MagAO-X instrument, and an additional ∼40% increase from the ground-based detection to the most recent HST observation, taken a few weeks later. In Fig. 3 we compare the normalised fluxes reported in Zhou et al. (2021, 2025); Close et al. (2025) with the normalised peak intensities of csmm we measure in our ALMA images. A similar trend in the continuum emission is tentatively observed, although our measurements are statistically compatible, with no significant variable emission (see Sect. 4), and the lack of ALMA observation of the 2024 epoch prevents a proper comparison. The tentatively inferred variable nature of the emission of csmm could be due to a variety of physical mechanisms. Firstly, the mass advection from the protoplanetary disc to the circumplanetary environment can readily change its radius. A 40% difference in radius can easily explain a factor of two difference in flux density, in particular for optically thick thermal emission. Secondly, within the assumption of thermal emission, the increase in peak intensity by a factor of ∼2 that we measure with the ALMA data can be associated with an increase in temperature by the same factor, as is explained in Casassus & Cárcamo (2022). In the assumption that variability in the temperature structure is directly connected to the accretion luminosity onto the planet, we can outline the following argument. Considering the relation, Lacc ∝ T4, between temperature, T, and accretion luminosity, Lacc, and that the accretion luminosity scales with the Hα luminosity with a power-law index of ∼0.95 for planetary mass accretion rates (Aoyama et al. 2021), the sub-millimetre variability would imply a variability in Hα luminosity by a factor of ∼20. The measured Hα fluxes show an increase of >3, which is not as prominent. However, the lack of simultaneous ALMA and Hα observations limits the interpretation of the results. Simultaneous observations of PDS 70 c tracing both Hα and ALMA continuum emission are needed in order to confirm a possible correlation between the variability of these two tracers.
5.3 Spectral index
Observations at different frequencies of PDS 70 can be used to estimate a spectral index. A detailed study of the spatial variations in the spectral index in PDS 70 was conducted in Doi et al. (2024), in which band 3 and 7 ALMA data were combined to suggest dust azimuthal and radial accumulation within the northwest dust overdensity in the outer ring. In this work, since we can detect and resolve the emission from the inner disc, csmm, and the outer disc, we focus on the spectral index between band 6 and band 7.
Given two frequencies, νB6 and νB7, with their associated flux density, FB6 and FB7, the spectral index is given by
 (3)
(3)
which can be generalised to
 (4)
(4)
where F0 is a normalisation factor. We calculated the spectral index in three different regions: the entire disc ( ), the inner disc(
 ), and csmm(
 ). For the first two regions, we considered the flux density from Tables 2 and 4. For the unresolved source, csmm, instead we used the task imsmooth of the CASA software to smooth our fiducial images with a Gaussian beam to the same resolution of the B6 2021 LF dataset5. We measured a peak intensity of csmm of 95 ± 18 μJy/beam, 172 ± 30 μJy/beam, 140 ± 24 μJy/beam, 54 ± 17 μJy/beam, and 55 ± 14 μJy/beam for B7 2019, B7 2021, B7 2023, B6 2021 LF, and B6 2021 HF, respectively, and used these estimates to compute the spectral index of csmm. Here we note that the peak emission we measure in these images is within 1σ of the values measured from the fiducial images (as expected for unresolved emission) with the exception of the band 72021 dataset, which might suffer from contamination by the inner disc or diffuse emission.
Spectral index.
We then estimated the spectral index for each region using all the datasets simultaneously by fitting Eq. (4) with the curve_fit function of the scipy module (Virtanen et al. 2020). We show the results of the fit in Fig. D.1. We obtain spectral indices of  ,
,  , and
, and  . The spectral index estimate for csmm is affected by large uncertainties due to the emission variability in band 7. As a result, for the circumplanetary material we also computed the spectral index for each epoch individually using Eq. (3) and we report the results we obtain in Table 6.
Assuming that the emission is caused entirely by thermal emission from dust and neglecting self-scattering (Zhu et al. 2019), there are two possible scenarios. If the dust is optically thick, the emission is characterised by a black body spectral index of α = 2 in the Rayleigh-Jeans limit. In the optically thin regime, instead, the spectral index will be given by α = β + 2, with β depending on the properties of the dust grains (see Fig. 4 and 10 from Birnstiel et al. 2018).
The spectral index of the inner disc  and the absence of variability in the single epoch estimates we measure indicate that the sub-millimetre emission is likely dominated by optically thin dust. By performing dust evolution and radiative transfer models of PDS 70, Pinilla et al. (2024) found that the inner disc is long-lived only if small grains (smaller than 0.1 μm) are diffused along with the gas into the gap carved by the two planets, in contrast to the larger grains trapped inside the ring. They computed the SED in the range of [0.45−7.50] mm and predicted spectral indices of
  and
and  for the entire disc and the inner disc, respectively, which are within the 1σ error bars of our measurements. This filtration process showcases the impact that massive planets at a large orbital separation can have on the terrestrial planet-forming potential of inner discs.
6 Conclusions
In this paper we present new high-resolution band 7 and band 6 observations of PDS 70. By performing 2D modelling of the dust emission in visibility space we:
Obtain a detailed model of the outer disc morphology of PDS 70. The residuals show the presence of complex substructures inside the region of the asymmetry.
Re-detect the compact dust emission around PDS 70 c both in band 7 (345−355 GHz) with >5σ and band 6 (220−260 GHz) with >3σ, confirming previous detections (Isella et al. 2019; Benisty et al. 2021; Casassus & Cárcamo 2022), and marginally detect (3σ) compact emission colocated with PDS 70 b in band 6 for the first time.
Measure an astrometric displacement of the material around PDS 70 c over three epochs consistent with the predicted positions of the planet (Wang et al. 2021).
Tentatively measure a peak intensity difference of up to 64 ± 34 μJy/beam at a 1σ confidence level for the region around PDS 70 c and perform a Bayesian test on our measurements, finding that they are not consistent with significant variable emission, while we do not find evidence of flux variability for the inner disc.
Observe variable morphology of the inner disc and resolve substructures for two epochs. We re-detect the clumps proposed in Casassus & Cárcamo (2022) in the same dataset, but we do not detect them in the following epochs. However, after subtracting a Gaussian model for the inner disc emission, we do not detect any clump with a more than 3σ significance.
Estimate the dust masses from the continuum integrated fluxes associated with both the emission around PDS 70 c and the inner disc. The results we obtain are consistent with previous estimates (Benisty et al. 2021).
Compute an integrated spectral index of
 ,
,  , and
, and  for the inner disc, the entire disc, and the material detected around PDS 70 c, respectively.
Acknowledgements
We thank the anonymous referee for their feedback that helped improving this paper. M.B. acknowledges Marco Tazzari for the development of Galario. This project has received funding from the European Research Council (ERC) under the European Union’s Horizon 2020 research and innovation programme (PROTOPLANETS, grant agreement No. 101002188). S.F. acknowledges financial contributions by the European Union (ERC, UNVEIL, 101076613), and by PRIN-MUR 2022YP5ACE. L.R. is funded by the European Union (ERC, UNVEIL, 101076613). Views and opinions expressed are, however, those of the author(s) only and do not necessarily reflect those of the European Union or the European Research Council. Neither the European Union nor the granting authority can be held responsible for them. L.P. gratefully acknowledges support by the ANID BASAL project FB210003 and ANID FONDECYT Regular 1221442. P.C. acknowledges support by the ANID BASAL project FB210003 This work was supported by a Grant-in-Aid for JSPS Fellows, grant No. JP23KJ1008 (T.C.Y.). This paper makes use of the following ALMA data: ADS/JAO.ALMA#2015.1.00888.S, ADS/JAO.ALMA#2018.A.00030.S, ADS/JAO.ALMA#2018.1.01774.S, ADS/JAO.ALMA#2019.1.01138.S, ADS/JAO.ALMA#2019.1.01619.S, ADS/JAO.ALMA#2021.1.00782.S, ADS/JAO.ALMA#2022.1.01695.S. ALMA is a partnership of ESO (representing its member states), NSF (USA) and NINS (Japan), together with NRC (Canada), NSTC and ASIAA (Taiwan), and KASI (Republic of Korea), in cooperation with the Republic of Chile. The Joint ALMA Observatory is operated by ESO, AUI/NRAO and NAOJ.
Appendix A Observations
In Table A.1 we report the observing log associated with the ALMA datasets presented for the first time in this paper.
Log of the ALMA observations presented in this work.
Appendix B Visibility Modelling
In Table B.1 we summarise the best fit parameters resulting from our visibility modelling of PDS 70 band 7 and 6 observations. We have adopted the following priors: log10 f1 = [8.0, 11.0], r1 = [0, 1.0] arcsec, σr,1 = [0, 1.0] arcsec, log10 f2 = [8.0, 11.0], r2 = [0, 1.0] arcsec, σr,2 = [0, 1.0] arcsec, log10 ![Mathematical equation: $f^{\rm a}_1=[8.0, 11.0]$](/articles/aa/full_html/2025/07/aa54959-25/aa54959-25-eq41.png) ,
, ![Mathematical equation: $r^{\rm a}_1=[0, 1.0]$](/articles/aa/full_html/2025/07/aa54959-25/aa54959-25-eq42.png) arcsec,
arcsec, ![Mathematical equation: $\sigma^{\rm a}_{r,1}=[0, 1.0]$](/articles/aa/full_html/2025/07/aa54959-25/aa54959-25-eq43.png) arcsec,
arcsec, ![Mathematical equation: $\theta^{\rm a}_1=[120, 180]$](/articles/aa/full_html/2025/07/aa54959-25/aa54959-25-eq44.png) arcsec,
arcsec, ![Mathematical equation: $\sigma^{\rm a}_{\theta,1}=[0, 45]$](/articles/aa/full_html/2025/07/aa54959-25/aa54959-25-eq45.png) arcsec, i = [0, 90] deg, PA = [0, 180] deg, ΔRa = [−2.0, 2.0] arcsec, ΔDec=[−2.0, 2.0] arcsec. For the test run, we additionally considered the following priors for the inner Gaussian: log10 f0 = [8.0, 11.0], σr,0 = [0, 1.0] arcsec
arcsec, i = [0, 90] deg, PA = [0, 180] deg, ΔRa = [−2.0, 2.0] arcsec, ΔDec=[−2.0, 2.0] arcsec. For the test run, we additionally considered the following priors for the inner Gaussian: log10 f0 = [8.0, 11.0], σr,0 = [0, 1.0] arcsec
galario best fit parameters
Appendix C Inner Disc Clumps
In Fig. C.1 we show the left and middle panels of Fig. 2a, with additional labels to point out the position of the clumps proposed in Casassus & Cárcamo (2022). We show the location where we re-detect Clump 1 and Clump 2 in the B7 2019 dataset using white and black dashed circles, respectively. For the B7 2021 dataset, we use the same circles to show the regions where we expect to detect the two clumps assuming Keplerian rotation. In the region associated with Clump 2 we tentatively see the presence of compact emission with <3σ significance, although it is dominated by noise due to the low S/N of this dataset, whether we do not detect any clump in the region associated with Clump 1.
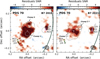 |
Fig. C.1 Same as left an middle panels of Fig. 2a, with additional labels to identify Clump 1 and Clump 2. The dashed white and black circles represent the location where we re-detect Clump 1 and Clump 2, respectively, in the B7 2019 dataset (left panel), and their expected position assuming Keplerian rotation in the B7 2021 dataset (right panel). |
Appendix D Spectral Index
In Fig. D.1 we show the Spectral Energy Distribution (SED) of the CPD and inner disc of PDS 70 using the datasets considered in this Article and we compare it with the best fit model of the spectral index.
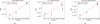 |
Fig. D.1 SED for the band 6 and 7 fluxes. a) SED of the full disc emission. b) SED of the csmm emission. c) SED of the inner disc emission around PDS 70 c. The black dots represent the measured fluxes reported in Tables 3–4, while the red line represent the best fit for the spectral index. |
References
- Aizawa, M., Muto, T., & Momose, M., 2024, MNRAS, 532, 1361 [Google Scholar]
- Andrews, S. M., 2020, ARA&A, 58, 483 [Google Scholar]
- Aoyama, Y., Marleau, G.-D., Ikoma, M., & Mordasini, C., 2021, ApJ, 917, L30 [CrossRef] [Google Scholar]
- Bae, J., Zhu, Z., Baruteau, C., et al. 2019, ApJ, 884, L41 [NASA ADS] [CrossRef] [Google Scholar]
- Bae, J., Isella, A., Zhu, Z., et al. 2023, ASP Conf. Ser., 534, 423 [NASA ADS] [Google Scholar]
- Benisty, M., Bae, J., Facchini, S., et al. 2021, ApJ, 916, L2 [NASA ADS] [CrossRef] [Google Scholar]
- Benisty, M., Dominik, C., Follette, K., et al. 2023, ASP Conf. Ser., 534, 605 [NASA ADS] [Google Scholar]
- Birnstiel, T., Dullemond, C. P., Zhu, Z., et al. 2018, ApJ, 869, L45 [CrossRef] [Google Scholar]
- CASA Team, Bean, B., Bhatnagar, S., et al. 2022, PASP, 134, 114501 [NASA ADS] [CrossRef] [Google Scholar]
- Casassus, S., & Cárcamo, M., 2022, MNRAS, 513, 5790 [NASA ADS] [CrossRef] [Google Scholar]
- Casassus, S., Christiaens, V., Cárcamo, M., et al. 2021, MNRAS, 507, 3789 [CrossRef] [Google Scholar]
- Close, L. M., Males, J. R., Li, J., et al. 2025, AJ, 169, 35 [Google Scholar]
- Cornwell, T. J., 2008, IEEE J. Selected Topics Signal Process., 2, 793 [NASA ADS] [CrossRef] [Google Scholar]
- Currie, T., Brittain, S., Grady, C. A., Kenyon, S. J., & Muto, T., 2017, Res. Notes Am. Astron. Soc., 1, 40 [Google Scholar]
- Doi, K., & Kataoka, A., 2021, ApJ, 912, 164 [NASA ADS] [CrossRef] [Google Scholar]
- Doi, K., Kataoka, A., Liu, H. B., et al. 2024, ApJ, 974, L25 [Google Scholar]
- Facchini, S., Teague, R., Bae, J., et al. 2021, AJ, 162, 99 [NASA ADS] [CrossRef] [Google Scholar]
- Foreman-Mackey, D., Hogg, D. W., Lang, D., & Goodman, J., 2013, PASP, 125, 306 [Google Scholar]
- Gaia Collaboration (Brown, A. G. A., et al.,) 2021, A&A, 649, A1 [NASA ADS] [CrossRef] [EDP Sciences] [Google Scholar]
- Garufi, A., Benisty, M., Pinilla, P., et al. 2018, A&A, 620, A94 [NASA ADS] [CrossRef] [EDP Sciences] [Google Scholar]
- Haffert, S. Y., Bohn, A. J., de Boer, J., et al. 2019, Nat. Astron., 3, 749 [Google Scholar]
- Hashimoto, J., Dong, R., Kudo, T., et al. 2012, ApJ, 758, L19 [Google Scholar]
- Hildebrand, R. H., 1983, QJRAS, 24, 267 [NASA ADS] [Google Scholar]
- Högbom, J. A., 1974, A&AS, 15, 417 [Google Scholar]
- Isella, A., Benisty, M., Teague, R., et al. 2019, ApJ, 879, L25 [Google Scholar]
- Jang, H., Waters, R., Kaeufer, T., et al. 2024, A&A, 691, A148 [NASA ADS] [CrossRef] [EDP Sciences] [Google Scholar]
- Jennings, J., Booth, R. A., Tazzari, M., Rosotti, G. P., & Clarke, C. J., 2020, MNRAS, 495, 3209 [Google Scholar]
- Keppler, M., Benisty, M., Müller, A., et al. 2018, A&A, 617, A44 [NASA ADS] [CrossRef] [EDP Sciences] [Google Scholar]
- Keppler, M., Teague, R., Bae, J., et al. 2019, A&A, 625, A118 [NASA ADS] [CrossRef] [EDP Sciences] [Google Scholar]
- Law, C. J., Benisty, M., Facchini, S., et al. 2024, ApJ, 964, 190 [NASA ADS] [CrossRef] [Google Scholar]
- Liu, Y., Li, D., Wang, H., et al. 2025, ArXiv e-prints [arXiv:2501.05913] [Google Scholar]
- Long, F., Pinilla, P., Herczeg, G. J., et al. 2018a, ApJ, 869, 17 [Google Scholar]
- Long, Z. C., Akiyama, E., Sitko, M., et al. 2018b, ApJ, 858, 112 [NASA ADS] [CrossRef] [Google Scholar]
- Loomis, R. A., Facchini, S., Benisty, M., et al. 2025, ApJ, 984, L7 [Google Scholar]
- Müller, A., Keppler, M., Henning, T., et al. 2018, A&A, 617, L2 [Google Scholar]
- Paardekooper, S., Dong, R., Duffell, P., et al. 2023, ASP Conf. Ser., 534, 685 [NASA ADS] [Google Scholar]
- Pecaut, M. J., & Mamajek, E. E., 2016, MNRAS, 461, 794 [Google Scholar]
- Perotti, G., Christiaens, V., Henning, T., et al. 2023, Nature, 620, 516 [NASA ADS] [CrossRef] [Google Scholar]
- Pinilla, P., Benisty, M., Waters, R., Bae, J., & Facchini, S., 2024, A&A, 686, A135 [NASA ADS] [CrossRef] [EDP Sciences] [Google Scholar]
- Rameau, J., Follette, K. B., Pueyo, L., et al. 2017, AJ, 153, 244 [Google Scholar]
- Rampinelli, L., Facchini, S., Leemker, M., et al. 2024, A&A, 689, A65 [NASA ADS] [CrossRef] [EDP Sciences] [Google Scholar]
- Rampinelli, L., Facchini, S., Leemker, M., et al. 2025, A&A, 698, A115 [NASA ADS] [CrossRef] [EDP Sciences] [Google Scholar]
- Tazzari, M., Beaujean, F., & Testi, L., 2018, MNRAS, 476, 4527 [Google Scholar]
- Toci, C., Lodato, G., Christiaens, V., et al. 2020, MNRAS, 499, 2015 [NASA ADS] [CrossRef] [Google Scholar]
- Virtanen, P., Gommers, R., Burovski, E., et al. 2020, https://doi.org/10.5281/zenodo.4406806 [Google Scholar]
- Wang, J. J., Vigan, A., Lacour, S., et al. 2021, AJ, 161, 148 [Google Scholar]
- Zhou, Y., Bowler, B. P., Wagner, K. R., et al. 2021, AJ, 161, 244 [NASA ADS] [CrossRef] [Google Scholar]
- Zhou, Y., Bowler, B. P., Sanghi, A., et al. 2025, ApJ, 980, L39 [Google Scholar]
- Zhu, Z., Zhang, S., Jiang, Y.-F., et al. 2019, ApJ, 877, L18 [NASA ADS] [CrossRef] [Google Scholar]
See Sect. 10.2.6 in the ALMA Technical Handbook https://almascience.nrao.edu/proposing/technical-handbook/
In this estimate we use the face value for the band 6 flux and the face value plus 3σ for the non detection in band 7.
See Sect. 10.5.2 in the ALMA Technical Handbook https://almascience.nrao.edu/proposing/technical-handbook/
As the resolution in band 6 is lower by a factor of ∼2, we CLEANed the band 7 datasets using an uv-taper to reach a similar resolution before applying the Gaussian smoothing.
All Tables
All Figures
|
Fig. 1 Left to right: continuum images with insets showing a zoom in the cavity; CLEANed galario model images; CLEANed residual images; zoom on the northern (1) and southern (2) sides of the outer ring residuals. Contours start at 3σ and increase by 1σ. The green ellipses approximate the 7σ contours of the continuum data. The datasets are ordered from band 7 to band 6 and by epoch from top to bottom. |
| In the text | |
|
Fig. 2 Zoom of the residuals in the cavity from Fig.1. (a) Band 72019 (left panel), 2021 (middle panel), and 2023 (right panel) datasets. (b) Band 62021 datasets at 220 GHz (left panel) and 260 GHz (right panel). The solid contours start from the 3σ emission and increase by 1σ, while the dashed contours correspond to the 3σ emission from the B7 2023 dataset and are overlaid on the other datasets for comparison. The white plus sign marks the centre of the disc, corrected with the galario offset. The green circles and purple diamonds represent the expected position in July 2019 (dark), July 2021 (medium), and May 2023 (light) obtained from the orbital fit of PDS 70 b and c (Wang et al. 2021), respectively. The error bars are smaller than the markers. |
| In the text | |
|
Fig. 3 Comparison between the normalised Hα fluxes of PDS 70 c observed with HST (orange diamonds, Zhou et al. 2021, 2025) and MagAO-X (blue diamonds, Close et al. 2025) and the normalised ALMA continuum peak flux of csmm (red dots, this work). The dashed black line highlights the maximum of the normalisation. |
| In the text | |
|
Fig. C.1 Same as left an middle panels of Fig. 2a, with additional labels to identify Clump 1 and Clump 2. The dashed white and black circles represent the location where we re-detect Clump 1 and Clump 2, respectively, in the B7 2019 dataset (left panel), and their expected position assuming Keplerian rotation in the B7 2021 dataset (right panel). |
| In the text | |
|
Fig. D.1 SED for the band 6 and 7 fluxes. a) SED of the full disc emission. b) SED of the csmm emission. c) SED of the inner disc emission around PDS 70 c. The black dots represent the measured fluxes reported in Tables 3–4, while the red line represent the best fit for the spectral index. |
| In the text | |
Current usage metrics show cumulative count of Article Views (full-text article views including HTML views, PDF and ePub downloads, according to the available data) and Abstracts Views on Vision4Press platform.
Data correspond to usage on the plateform after 2015. The current usage metrics is available 48-96 hours after online publication and is updated daily on week days.
Initial download of the metrics may take a while.