Fig. C.1
Download original image
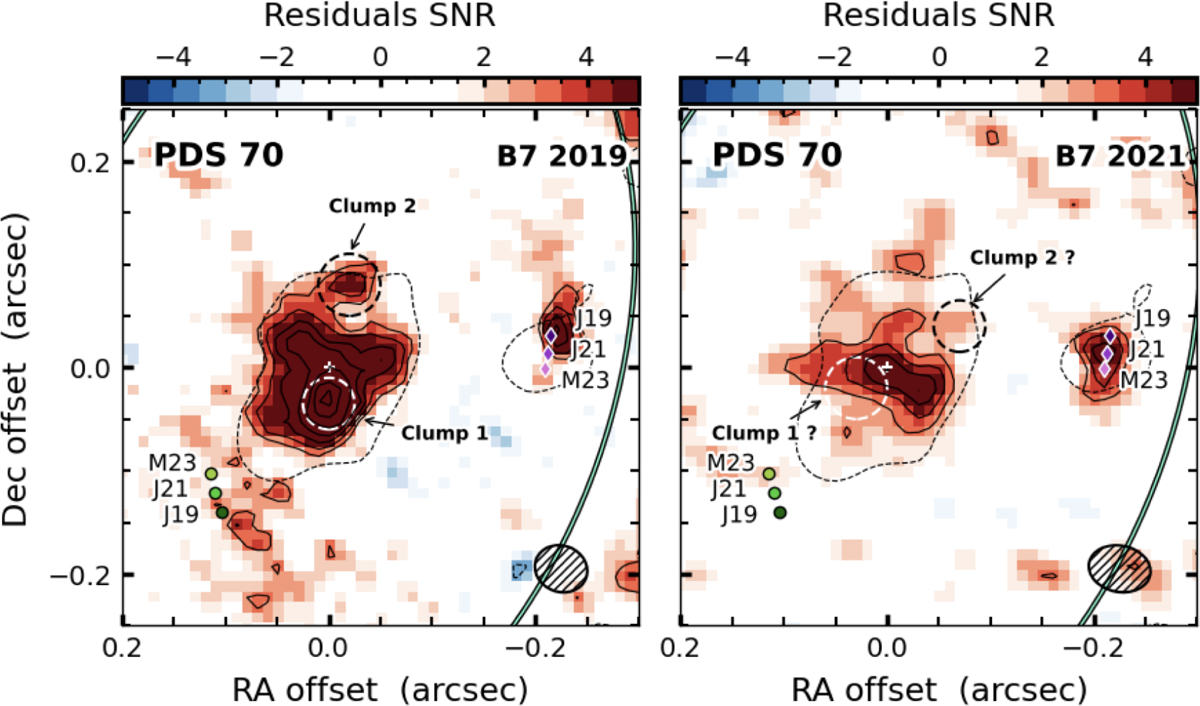
Same as left an middle panels of Fig. 2a, with additional labels to identify Clump 1 and Clump 2. The dashed white and black circles represent the location where we re-detect Clump 1 and Clump 2, respectively, in the B7 2019 dataset (left panel), and their expected position assuming Keplerian rotation in the B7 2021 dataset (right panel).
Current usage metrics show cumulative count of Article Views (full-text article views including HTML views, PDF and ePub downloads, according to the available data) and Abstracts Views on Vision4Press platform.
Data correspond to usage on the plateform after 2015. The current usage metrics is available 48-96 hours after online publication and is updated daily on week days.
Initial download of the metrics may take a while.