Fig. 1
Download original image
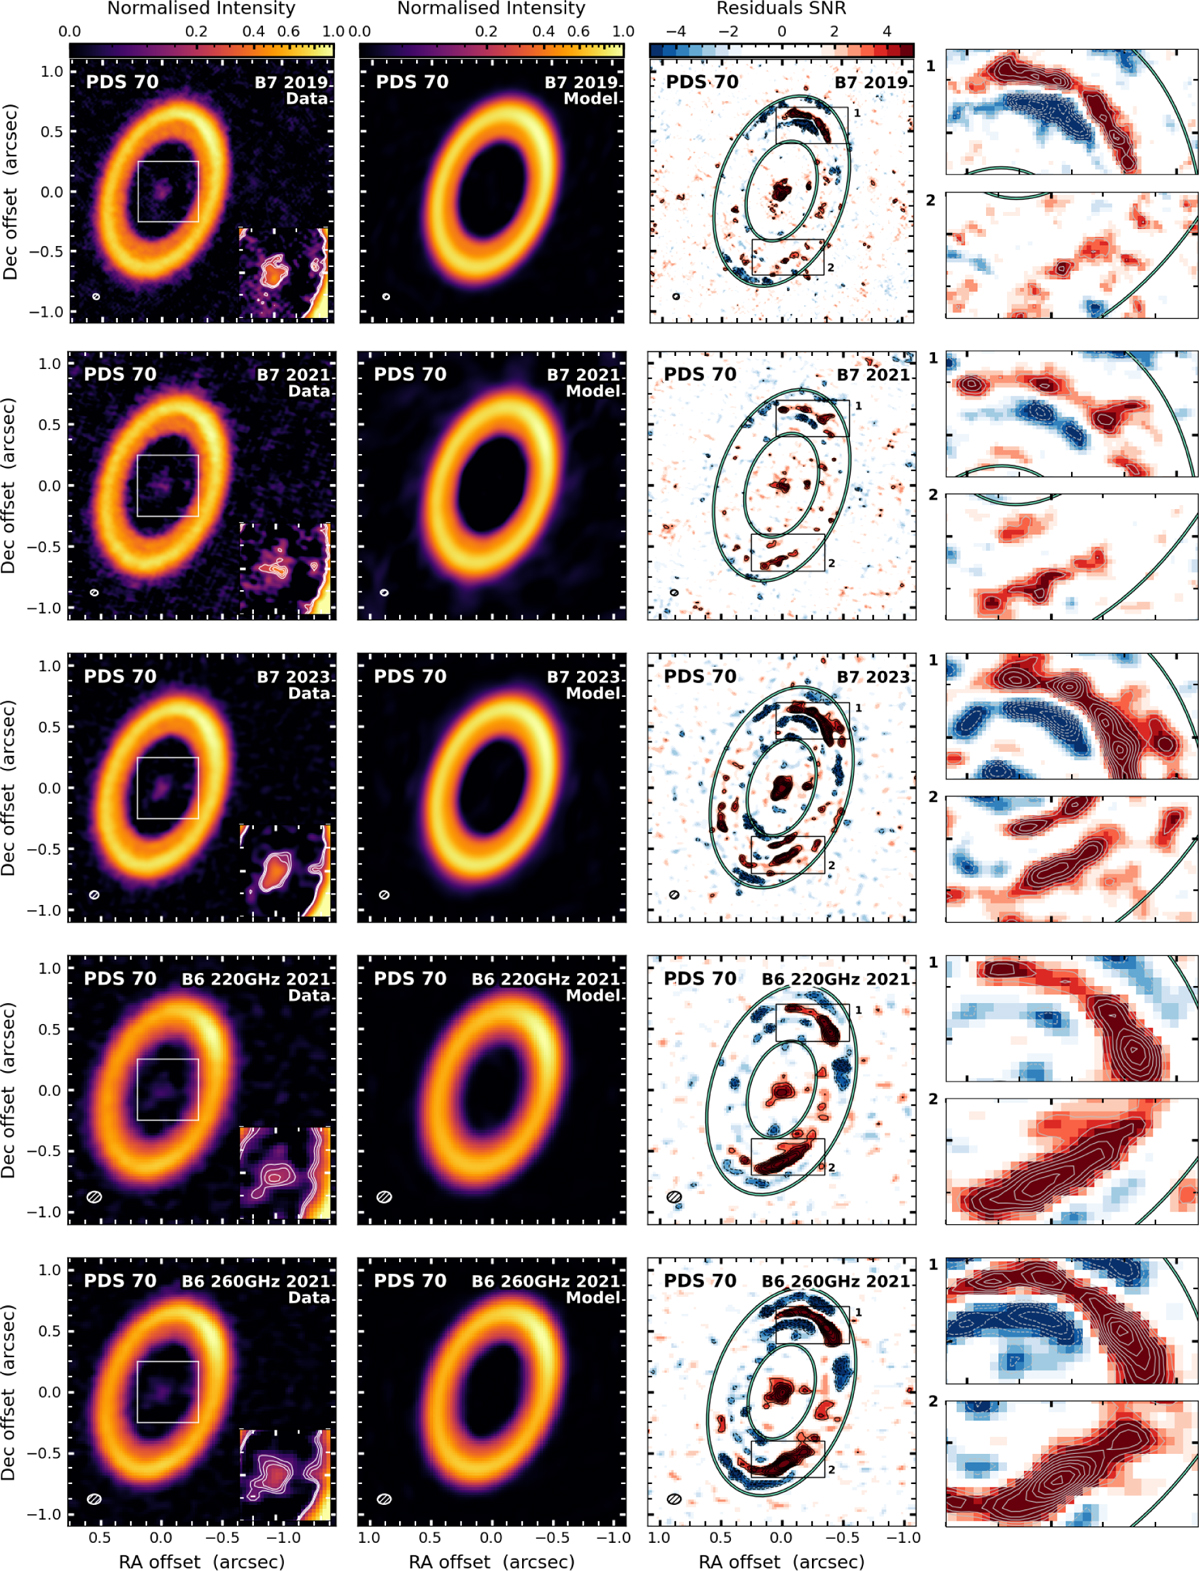
Left to right: continuum images with insets showing a zoom in the cavity; CLEANed galario model images; CLEANed residual images; zoom on the northern (1) and southern (2) sides of the outer ring residuals. Contours start at 3σ and increase by 1σ. The green ellipses approximate the 7σ contours of the continuum data. The datasets are ordered from band 7 to band 6 and by epoch from top to bottom.
Current usage metrics show cumulative count of Article Views (full-text article views including HTML views, PDF and ePub downloads, according to the available data) and Abstracts Views on Vision4Press platform.
Data correspond to usage on the plateform after 2015. The current usage metrics is available 48-96 hours after online publication and is updated daily on week days.
Initial download of the metrics may take a while.