Fig. 2
Download original image
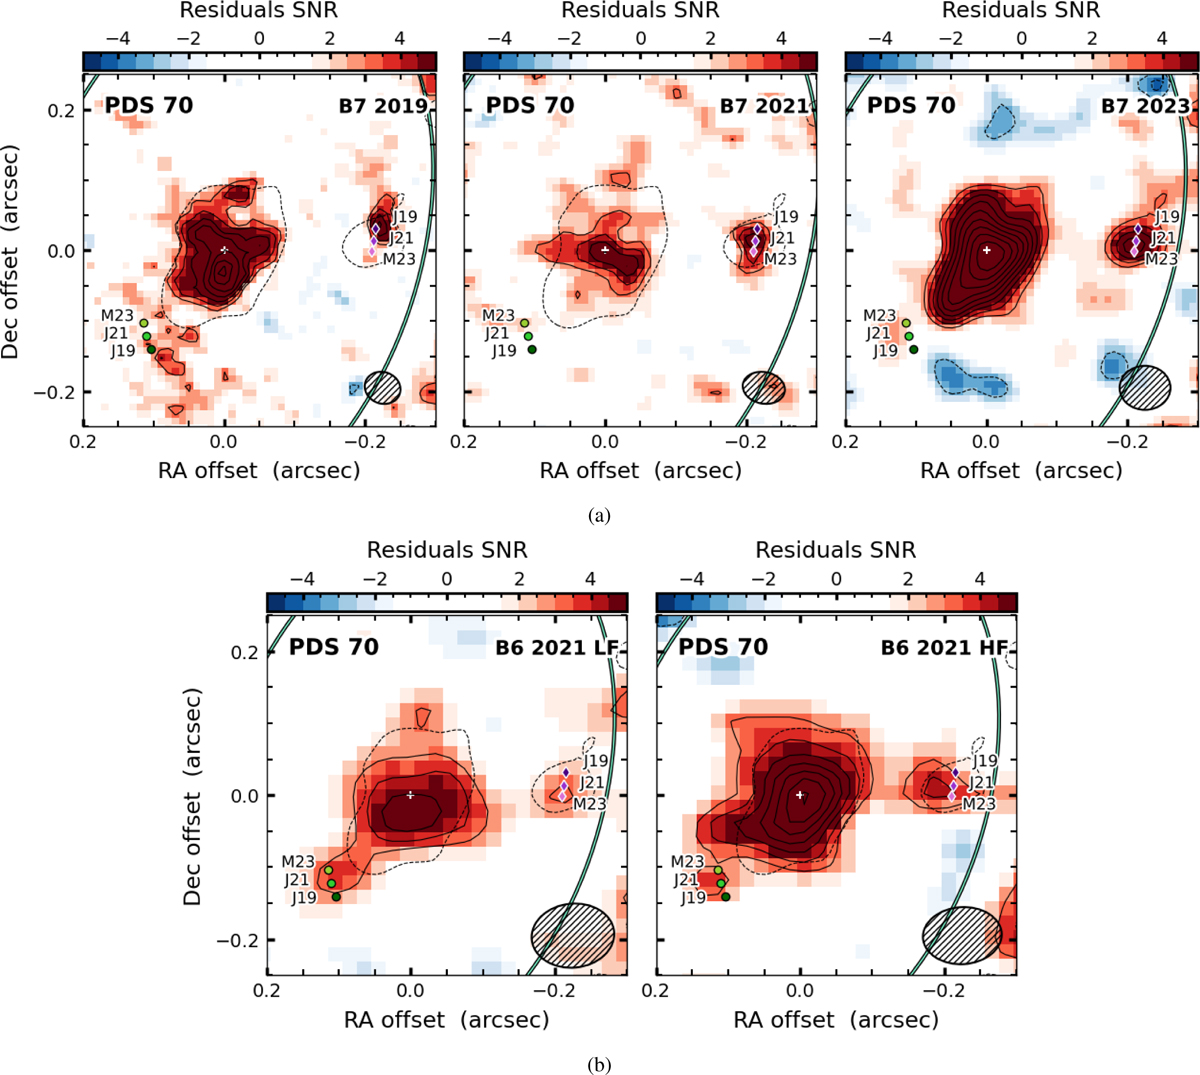
Zoom of the residuals in the cavity from Fig.1. (a) Band 72019 (left panel), 2021 (middle panel), and 2023 (right panel) datasets. (b) Band 62021 datasets at 220 GHz (left panel) and 260 GHz (right panel). The solid contours start from the 3σ emission and increase by 1σ, while the dashed contours correspond to the 3σ emission from the B7 2023 dataset and are overlaid on the other datasets for comparison. The white plus sign marks the centre of the disc, corrected with the galario offset. The green circles and purple diamonds represent the expected position in July 2019 (dark), July 2021 (medium), and May 2023 (light) obtained from the orbital fit of PDS 70 b and c (Wang et al. 2021), respectively. The error bars are smaller than the markers.
Current usage metrics show cumulative count of Article Views (full-text article views including HTML views, PDF and ePub downloads, according to the available data) and Abstracts Views on Vision4Press platform.
Data correspond to usage on the plateform after 2015. The current usage metrics is available 48-96 hours after online publication and is updated daily on week days.
Initial download of the metrics may take a while.