| Issue |
A&A
Volume 699, July 2025
|
|
|---|---|---|
| Article Number | A324 | |
| Number of page(s) | 12 | |
| Section | Extragalactic astronomy | |
| DOI | https://doi.org/10.1051/0004-6361/202554868 | |
| Published online | 17 July 2025 | |
ADF22+: A declining faint end in the far-infrared luminosity function in the SSA22 protocluster at z = 3.09
1
National Astronomical Observatory of Japan, 2-21-1 Osawa, Mitaka, Tokyo 181-8588, Japan
2
Department of Physics, Graduate School of Science, Nagoya University, Furocho, Chikusa, Nagoya 464-8602, Japan
3
Institute for Advanced Research, Nagoya University, Furocho, Chikusa, Nagoya 464-8602, Japan
4
Centre for Extragalactic Astronomy, Department of Physics, Durham University, South Road, Durham DH1 3LE, UK
5
Department of Astronomical Science, The Graduate University for Advanced Studies, SOKENDAI, 2-21-1 Osawa, Mitaka, Tokyo 181-8588, Japan
6
Institute of Astronomy, Graduate School of Science, The University of Tokyo, 2-21-1 Osawa, Mitaka, Tokyo 181-0015, Japan
7
Astronomical Institute, Tohoku University, 6-3, Aramaki, Aoba, Sendai, Miyagi 980-8578, Japan
8
Nishi-Harima Astronomical Observatory, Centre for Astronomy, University of Hyogo, 407-2 Nishigaichi, Sayo, Sayo-gun, Hyogo 679-5313, Japan
9
Junior College, Fukuoka Institute of Technology, 3-30-1 Wajiro-higashi, Higashi-ku, Fukuoka 811-0295, Japan
⋆ Corresponding author.
Received:
30
March
2025
Accepted:
23
June
2025
Protoclusters represent the densest regions of cosmic large-scale structure in the early Universe and are the environment where present-day massive elliptical galaxies were assembled. Millimetre continuum emission offers a powerful probe of obscured star formation at high redshifts across various environments. In this paper we present a deep ALMA 1.17 mm mosaic of the central 8 arcmin2 (≈30 comoving Mpc2) region in the SSA22 protocluster at z = 3.09 to study the faint dusty star-forming galaxy (DSFG) population. The continuum map achieves an RMS noise level of ≈25 μJy beam−1 at ≈1″ spatial resolution, which is approximately twice the depth of a previous observation of this field. We detect 53 sources with a signal-to-noise ratio above 4.2, doubling the number of detections. Utilizing optical to mid-infrared ancillary data, we searched for spectroscopic redshifts and identify 18 of the 53 as cluster members. For sources with more than two photometric data points in the near-infrared, the stellar mass (M⋆) and star formation rate (SFR) from spectral energy distribution fitting are presented. The 1.17 mm number count shows a > 2× excess at flux density ≳1 mJy but is consistent with a blank field in fainter flux bins. The monochromatic far-infrared luminosity function of the SSA22 protocluster core region suggests a lack of faint DSFGs. All SSA22 protocluster member galaxies detected at 1.17 mm have SFRs within the M⋆–SFR relation of general star-forming galaxies. Our results suggest that an early overdense environment such as the SSA22 protocluster predominantly accelerates the formation of massive early-type galaxies in present-day galaxy clusters, but that the star formation in individual member galaxies is likely driven by a gas supply along the cosmic web and occurs in a secular way.
Key words: galaxies: clusters: general / galaxies: evolution / galaxies: formation / galaxies: high-redshift / galaxies: luminosity function / mass function / galaxies: star formation
© The Authors 2025
 Open Access article, published by EDP Sciences, under the terms of the Creative Commons Attribution License (https://creativecommons.org/licenses/by/4.0), which permits unrestricted use, distribution, and reproduction in any medium, provided the original work is properly cited.
This article is published in open access under the Subscribe to Open model. Subscribe to A&A to support open access publication.
1. Introduction
Overdense regions in the high-redshift Universe are thought to be the progenitors of present-day galaxy clusters and are referred to as protoclusters (e.g. Overzier 2016). In Λ cold dark matter cosmology, structure formation occurs in a hierarchical manner. Peaks in the initial density fluctuation collapse into dark matter halos (Gunn & Gott 1972) and define the filaments and sheets in the large-scale matter distribution (the ‘cosmic web’; Bond et al. 1996). The most massive halos form from mergers of smaller ones at the intersecting nodes of cosmic filaments (e.g. Boylan-Kolchin et al. 2009), where large amounts of infalling materials along the cosmic web are thought to have fuelled star formation and to have given rise to protoclusters of galaxies in the early Universe (Umehata et al. 2019). Observations of protoclusters suggest that galaxy evolution is accelerated there compared to the field, as signposted by elevated levels of star formation (e.g. Stevens et al. 2003; Dannerbauer et al. 2014; Casey et al. 2015; Miller et al. 2018), higher active galactic nucleus (AGN) fractions (e.g. Lehmer et al. 2009a,b, 2013; Tozzi et al. 2022), and, eventually, the early emergence of massive quiescent galaxies (e.g. Kubo et al. 2021; McConachie et al. 2022; Ito et al. 2023). The rapid growth and quenching of massive galaxies in protoclusters can explain old red giant elliptical galaxies in the centre of present-day clusters (e.g. Nelan et al. 2005).
Most of the star formation in massive galaxies at high redshifts is obscured by dust (> 90% for log(M⋆/M⊙) > 10.5; e.g. Whitaker et al. 2017; Dudzevičiūtė et al. 2020); thus, one of the most efficient ways to probe their stellar mass build-up is to observe the rest-frame far-infrared (FIR) emission that originates from dust heating by young massive stars. Numerous studies have targeted high-redshift overdensities using single-dish sub-millimetre to millimetre telescopes equipped with bolometer cameras (e.g. Ivison et al. 2000; Geach et al. 2005; Tamura et al. 2009; Chapman et al. 2009; Umehata et al. 2014; Dannerbauer et al. 2014; Clements et al. 2016; Arrigoni Battaia et al. 2018; Smail 2024; Wang et al. 2025). These observations have consistently found abundant bright sub-millimetre to millimetre sources, which indicate intense star formation enshrouded by dust in protoclusters. While single-dish surveys provide a wide field of view, which is needed to map protocluster fields, the coarse angular resolution limits the achievable sensitivity due to confusion noise and complicates the identification of counterparts. Interferometers offer angular resolution high enough to overcome the confusion limit of single-dish telescopes, but the small field of view necessitates mosaicking, so interferometric protocluster surveys with a significant area are scarce. Existing interferometric surveys of protoclusters (e.g. Umehata et al. 2017; Oteo et al. 2018) are often too shallow to be compared with deep blank field mosaics (e.g. González-López et al. 2020; Fujimoto et al. 2024). Therefore, the effect of protocluster environment on the abundance of fainter and more representative populations of dusty star-forming galaxies (DSFGs) remains poorly explored. Investigating the dust content of other populations in protoclusters, such as Lyα blobs (e.g. Umehata et al. 2021) and Lyman break galaxies, also requires substantially deeper data.
The Special Selected Area 22 (SSA22) protocluster at z = 3.09 was first discovered as a peak in the redshift distribution of Lyman break galaxies (Steidel et al. 1998) and was then associated with a > 100 Mpc scale structure identified via an overdensity of Lyα emitters (Hayashino et al. 2004; Yamada et al. 2012) distributed along at least three filaments (Matsuda et al. 2005). The large-scale filaments intersect at the core region of the SSA22 protocluster, where numerous massive galaxies (Kubo et al. 2013, 2015, 2016) and AGNs (Lehmer et al. 2009a,b) are seen. Since its discovery, it has been extensively studied from X-ray to radio wavelengths (e.g. Chapman et al. 2004a; Hayashino et al. 2004; Lehmer et al. 2009b; Webb et al. 2009; Kato et al. 2016; Ao et al. 2017). Single-dish sub-millimetre to millimetre surveys of the SSA22 field (Geach et al. 2005; Tamura et al. 2009; Umehata et al. 2014) have found substantial star formation activities obscured by dust. Umehata et al. (2017) mapped the central 7 arcmin2 (≈1 Mpc2) area at 1.1 mm using Atacama Large Millimeter/submillimeter Array (ALMA) and revealed an increased number density of bright DSFGs in the core region. The distribution of z = 3.09 member DSFGs and AGNs overlaps with diffuse gas filaments seen in Lyα emission (Umehata et al. 2019), suggesting galaxy growth fuelled by gas supplies from the cosmic web. However, the abundance of fainter DSFGs was not clear because of the small number of detections at an RMS sensitivity of 60 μJy beam−1 (equivalent to a 4σ star formation rate limit of ≈50 M⊙ yr−1 at z = 3.09).
In this paper we extend the previous 1.1 mm continuum mosaic in the SSA22 core region (ALMA Deep Field in SSA22, or ADF22+; see also Umehata et al. 2017) to a more than twice fainter flux limit to study the faint DSFG population in this protocluster region. This paper is organized as follows. In Sect. 2 we describe the observations and data analysis. The results are presented in Sect. 3 and discussed in Sect. 4. We summarize our findings in Sect. 5. Throughout this paper, we adopt Planck 2018 cosmological parameters: H0 = 67.4 km s−1 Mpc−1, Ωm = 0.315, and ΩΛ = 0.685 (Planck Collaboration I 2020). At z = 3.09, 1″ corresponds to 7.8 physical kpc.
2. Observation and ancillary data
2.1. ALMA band 6 continuum mosaic
The central  region of the SSA22 protocluster was mapped with the band 6 receiver in two ALMA projects from 2014 to 2018 (project codes #2013.1.00162.S and #2017.1.01332.S, PI: Umehata). The 103-pointing mosaic constructs a rectangular field centred on RA = 22h17m34s Dec = +00° 17′00″ (Fig. 1). The 2014 and 2015 observations were carried out in C-1 (angular resolution
  , maximum recoverable scale
  ) and C-4 (angular resolution
  , maximum recoverable scale
  ) array configurations with a single spectral tuning in sky frequency ranges of 252.98−256.97 GHz and 268.98−272.97 GHz. During the observations, J2148+069, Neptune, and Uranus were used as flux calibrators. Phase calibration was done by observing J2148+0657. The 2018 observations were conducted in C-1 (angular resolution
  , maximum recoverable scale
  ) array configuration with three frequency tunings of 240.99−244.97 GHz and 256.98−260.97 GHz, 244.98−248.97 GHz and 260.98−264.97 GHz, 248.98−252.97 GHz, and 264.98−268.97 GHz. These two projects provide continuous frequency coverage from 240.99 to 272.97 GHz for the same field, covering the CO(9−8) and H2O (202 − 111) lines at z = 3.09. In 2018 observations, flux calibrators were J2148+0657, J2000−1748, and J2253+1608. J2226+0052, J2156−0037, and J2148+0657 were observed for phase calibration. The typical precipitable water vapour was 1.3 mm for 2014 and 2015 observations and 0.5−2.3 mm for 2018 observations.
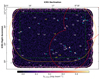 |
Fig. 1. Left: 1.17 mm continuum map displayed in the flux range −2σ − 20σ. The black ellipse in the lower left indicates the beam FWHM. Sources with S/N > 4.2 are indicated with their ID number in Table 1. The IDs of z = 3.09 protocluster members confirmed by spectroscopy are highlighted in cyan. Sources with non-zero values at z = 3.09 in their photometric redshift probability functions (A34, A47, A49, and A55) are in yellow. The white contour indicates a primary beam response of 20%. The coloured contours show the areas with spectroscopic coverage from VLT/MUSE (green), the Umehata et al. (2019) shallow CO mosaic (orange), and deep CO observations of A1 and A4 (red). |
The data were processed by the ALMA pipeline in the CASA (CASA Team 2022) package. Imaging is performed using tclean task with Briggs weighting (robust = 0.5), and auto-multithresh masking. We chose the mtmfs deconvolver with scale = [0] because the continuum sources are expected to be at most marginally resolved. The resulting 256.98 GHz (1.17 mm) continuum image is shown in Fig. 1. The synthesized beam has a full width at half maximum (FWHM) of  and a position angle (PA) of 88.2°. The RMS noise level is ≈25 μJy beam−1 before primary beam correction, ≈2.4× of the depth of 60 μJy beam−1 map from Umehata et al. (2017).
2.2. Ancillary data
2.2.1. ALMA band 3 spectroscopy
The CO(3−2) emission lines from two bright SSA22 protocluster member DSFGs with dense subgroups surrounding them, A1 and A4, were observed using the band 3 receiver (cycle 9 project #2022.1.00680.S targeting A1 group and cycle 10 project #2023.1.01206.S targeting A4 group, PI: Umehata). The cycle 9 programme uses spectral tuning in sky frequency range 84.09−87.80 GHz and 96.09−99.80 GHz, while the cycle 10 programme observes 84.06−87.81 GHz and 96.09−99.81 GHz, so that the lowest frequency spectral windows cover the CO(3−2) line at z = 3.09. The data are processed using the standard ALMA pipeline in the CASA package. Spectral cube is generated using the tclean task from pipeline-processed visibility data with natural weighting and 41.5 km s−1 channel width, resulting in a median RMS noise level of 43 μJy beam−1 and FWHM =  , PA = 69.4° synthesized beam for A1, and a median RMS noise level of 47 μJy beam−1 and FWHM =
  , PA = 87.5° synthesized beam for A4. In this study we solely used the data for redshift determination. Detailed analysis of the deep CO(3−2) data will be presented in future work. We also made use of the shallower CO(3−2) data in Umehata et al. (2019), which cover a larger portion of the 1.17 mm continuum mosaic.
2.2.2. MUSE spectroscopy
The Lyα emission line from the SSA22 protocluster was observed using the Multi Unit Spectroscopic Explorer (MUSE) instrument on Very Large Telescope (VLT) Unit Telescope 4 (programmes 099.A-0638 and 0101.A-0679, PI: Umehata). Two MUSE fields with 4.16 hours exposure per field are used to construct a 116″ × 169″ rectangular mosaic centred on RA =  Dec = +00° 17′00″. The MUSE mosaic is almost co-spatial with the ALMA map, but the outer part of the ALMA map is not included. The cube covers the observed wavelength range 456−935 nm with a spectral resolution of 0.125 nm. This spectral coverage includes Lyα (rest-frame 121.6 nm) at z = 3.09. We refer the reader to Umehata et al. (2019) for details about the MUSE data, which also provides a compilation of source redshifts from ground-based optical and near-infrared (NIR) spectroscopy.
2.2.3. Optical and near-infrared imaging data
The SSA22 field is imaged by various ground-based and space telescopes at optical and NIR wavelengths. For ground-based imaging, we collected reduced data in CFHT/Megacam u (K. Mawatari, private communication), Subaru/SuprimeCam BVRi′z′/NB359/NB497/NB816/NB912 (Hayashino et al. 2004; Iwata et al. 2009; Nakamura et al. 2011; Yamada et al. 2012), Subaru/Hyper Suprime-Cam grizY (Aihara et al. 2018), UKIRT/WFCAM JK (Lawrence et al. 2007), and Subaru/MOIRCS Ks (Kubo et al. 2021) bands. Spitzer IRAC channel 1−4 imaging data (Webb et al. 2009) are downloaded from the IRSA archive1 and mosaicked using the MOPEX software. Part of the field is also imaged by the NIRCam on board the James Webb Space Telescope (JWST; programme GO-3547, PI: Umehata) in the F115W, F200W, F356W, and F444W filters.
3. Analysis and results
3.1. Source detection
Source extraction is performed on the 1.17 mm continuum image before primary beam correction by using image segmentation routines in the astropy coordinated package photutils (Bradley et al. 2024). We searched for continuous pixel islands with amplitude above 0.5 × RMS and total area larger than the synthesized beam as initial source candidates. The false detection rate in each peak signal-to-noise ratio (S/N) bin wascalculated by repeating source extraction on reversed data and comparing the cumulative number of positive and negative peaks above a given S/N:
In Fig. 2a we show the false detection rate as a function of peak S/N. Based on these results, we filtered the initial source candidates by requiring the peak S/N to be > 4.2 and created the final source catalogue (Appendix A; see also Fig. 1) from 53 sources, corresponding to a spurious rate of < 12%. For each detection, we searched for a counterpart in the Umehata et al. (2017) main and supplementary catalogues (A1−A32) using a matching radius of 0.425 × beam FWHM ( , equivalent to 1σ of Gaussian). If no match was found, a new ID starting from A33 was assigned in the order of descending flux. All 18 sources in the main catalogue of Umehata et al. (2017) are detected in the new deeper mosaic, but only 3 out of 14 in the supplementary catalogue with S/N = 4.0 − 5.0 (or 2 of 8 sources with 4.2 ≤ S/N < 5.0) are recovered. Considering the poor confirmation of Umehata et al. (2017) catalogue at S/N < 5, we marked the new sources with 4.2 < S/N < 5.0 as tentative detections.
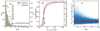 |
Fig. 2. (a) Histograms of the number of positive and negative peaks as a function of S/N. The scatter plot indicates the false detection rate as a function of S/N. The dashed line marks the detection threshold of S/N > 4.2, corresponding to a 12% spurious rate (the dotted line). (b) Completeness (black line) as a function of intrinsic flux and effective survey area (red line) in which a source can be detected with S/N > 4.2 as a function of the peak flux per beam. The vertical line marks the typical flux at the detection threshold of S/N > 4.2. (c) Ratio between measured and intrinsic fluxes as a function of S/N. Red squares with error bars indicate the median and standard deviation. The flux boosting is less than ∼10% at S/N > 4.2. |
Source position and flux are measured using the CASA imfit task. The detection completeness is estimated by injecting point sources into random blank positions in the image before primary beam correction, and then running the same source detection script. The artificial source is considered recovered if it is detected at peak S/N > 4.2 within  from the injected position. The completeness as a function of source flux is shown in Fig. 2b. From the results, we also calculated the ratio between measured and true fluxes (Fig. 2c). For sources with peak S/N < 20, we divided their 1.17 mm fluxes from imfit task by the median measured-to-true flux ratio at the corresponding S/N to correct for flux boosting.
3.2. Counterpart identification and source properties
To search for counterparts at optical and NIR wavelengths, we first aligned the images to the ALMA coordinate frame and subtracted the background. A gallery of image stamps at the ALMA source position is provided in Appendix C. The ground-based images have a homogenized point spread function (PSF) FWHM of  . Photometry on these images was performed in 2″ diameter circular aperture centred on the ALMA position and corrected for aperture loss using the PSF model in each band. Flux errors were estimated as the standard deviations of fluxes from 1000 randomly placed apertures at blank positions. Fluxes in Spitzer IRAC bands were measured from point source decomposition of the image (Hsieh et al. 2012) in the same aperture as optical images, which allows the source centroid to wander by up to
  . In Table A.1, sources with S/N > 3 in any of the Ks, IRAC1, and IRAC2 bands (median 3σ depth = 0.3 μJy, 0.3 μJy and 0.4 μJy) are marked as NIR-detected. Three sources (A33, A58 and A64) have a nearby NIR source located
  away from the ALMA position and no photometry. They are marked as potential lensed sources or no counterpart (L/N) in ourcatalogue.
The majority of the brighter sources with an entry in Umehata et al. (2017) have redshifts determined by previous studies. For all but one of these sources (A15), we collected their literature redshifts. For fainter sources and A15, we inspected their MUSE and ALMA band 3 spectra when available and search for redshift solutions. The redshifts and identified lines are presented in Table A.1. Details of the line identification are discussed in Appendix B. For sources without spectral line detected, we computed photometric redshift using the EAZY code (Brammer et al. 2008) if there were more than two data points in optical and NIR bands and report the resulting 16th–50th–84th percentile range in Table 1. Stellar mass and star formation rate (SFR) are derived from optical/NIR and ALMA 1.17 mm fluxes with the spectral energy distribution fitting method in Tsujita et al. (2024). In Fig. 5 we plot spectroscopically confirmed SSA22 protocluster members in M⋆–SFR plane. For a comparison with coeval star-forming galaxy population in the same epoch, we also plot the so-called star-forming main sequence relation (SFMS) between M⋆ and SFR from Speagle et al. (2014) and random field DSFGs at 2.8 < z < 3.4 (Franco et al. 2018, 2020; Dudzevičiūtė et al. 2020; Simpson et al. 2020; Ikarashi et al., in prep.).
1.17 mm source number count.
3.3. 1.17 mm number count
The blind differential number count in a flux bin with width ΔS is calculated by summing the correction factor of each source in the bin:
The effective area as a function of flux is defined as the area in the mosaic where a source can be detected with S/N > 4.2 as shown in Fig. 2b. We evaluated the number count from 0.06 to 6.3 mJy in six bins placed evenly in logarithmic space. Field-only number counts are also calculated by assigning a weight of zero to confirmed SSA22 members with spectroscopic redshift z ≈ 3.09. To estimate uncertainty, we resampled the flux column of the source table (Appendix A) 1000 times, assuming the flux error follows a Gaussian distribution, and add the resulting standard deviation of the number count in quadrature to the Poisson error as the final uncertainty. The results are listed in Table 1 and plotted in Fig. 4, together with a collection of literature results of blank fields (Karim et al. 2013; Ono et al. 2014; Carniani et al. 2015; Hatsukade et al. 2016, 2018; Stach et al. 2018; González-López et al. 2020; Simpson et al. 2020; Béthermin et al. 2020; Gómez-Guijarro et al. 2022; Chen et al. 2023; Fujimoto et al. 2024) and protocluster field (Zhang et al. 2024). The literature fluxes are scaled to 1.17 mm by assuming a modified black body with dust temperature = 35 K, emissivity β = 1.8, and median redshift z = 2.5 of the DSFG population (e.g. Gómez-Guijarro et al. 2022; Dudzevičiūtė et al. 2020). The resulting number count shows consistency with the field average for flux density ≲1 mJy but obvious excess at brighter fluxes.
With a similar Monte Carlo method, we also computed the rest-frame 250 μm luminosity function ϕ for the core region of the SSA22 protocluster (3.08 < z < 3.10, Matsuda et al. 2005). Assuming a modified black body with dust temperature = 35 K, emissivity β = 1.8, and redshift z = 3.09, the 1.17 mm (rest-frame 285 μm) luminosity was divided by 0.72 to convert to that at rest-frame 250 μm. Protocluster membership is based on spectroscopic redshifts or the probability of photometric redshifts (see the next section) falling into the range of the core region. We resampled the catalogue 40 000 times and find the probability that one or more photometric redshift sources are protocluster members to be ≈6%. However, we note that membership based on photometric redshift can be unreliable: the two sources (A34 and A49) with photometric redshift closest to 3.09 lie in the deep CO(3−2) footprint but are undetected while their continuum fluxes are comparable to A42 at z = 3.098. As such, we mainly considered the results based on spectroscopic membership. The monochromatic luminosity function is listed in Table 2 and plotted in Fig. 4.
Rest-frame 250 μm luminosity function of the SSA22 protocluster core region at z = 3.09 ± 0.01.
4. Discussion
4.1. Overabundant bright dusty star-forming galaxies in a protocluster environment
From Fig. 3, it is clear that the SSA22 protocluster field shows an excess of sources with 1.17 mm flux density ≳1 mJy as found by Umehata et al. (2017), but approaching the same number density as random fields at fainter fluxes. Adopting the best-fit Schechter function from Gómez-Guijarro et al. (2022) as field average, the observed source surface density is  ,
,  ,
,  times of that in blank field at 0.91, 2.0, and 4.2 mJy, while at 0.42 mJy, the source surface density is
  times of field average. When known SSA22 members are excluded, the number count becomes roughly consistent with random fields, and the residual deviation at flux ≳1 mJy can be attributed to the small number of bright field sources in the surveyed area. An excess of bright sources has also been observed in the z = 3.25 MQN01 field (Pensabene et al. 2024) and the Spiderweb protocluster at z = 2.16 (Zhang et al. 2024), though the Spiderweb has a lower degree of overdensity (∼2×). As also noted by Zhang et al. (2024), the higher number of > 1 mJy sources in SSA22 than Spiderweb could be due to our ALMA footprint covering only the very centre of the z = 3.09 protocluster and an earlierevolutionary stage of the SSA22 protocluster when there was a large amount of gas supply from the cosmic web. In this context, the number count of the SSA22 field suggests that the early protocluster core environment preferentially enhances the massive and hence bright end of the star-forming population and that a potential dearth of faint DSFGs in the protocluster core, despite our survey being 90% complete down to a 1.17 mm flux density of 0.19 mJy. The findings here agree with the galaxy downsizing scenario (e.g. Cowie et al. 1996; Arnouts et al. 2005): more massive galaxies form earlier and faster, producing brighter dust emission.
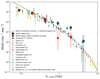 |
Fig. 3. 1.17 mm source number count of the deep SSA22 field. For comparison, we show interferometric number counts of random fields from the literature, with fluxes converted to 1.17 mm: Karim et al. (2013), Ono et al. (2014), Carniani et al. (2015), Hatsukade et al. (2016, 2018), Stach et al. (2018), González-López et al. (2020), Simpson et al. (2020), Béthermin et al. (2020), Gómez-Guijarro et al. (2022), Chen et al. (2023), and Fujimoto et al. (2024). We also present the total number count of the z = 2.16 Spiderweb protocluster (Zhang et al. 2024). The dashed line shows the best-fit Schechter function from Gómez-Guijarro et al. (2022). |
4.2. The rest-frame FIR luminosity function
In Fig. 4 we can see that the rest-frame 250 μm luminosity function of the SSA22 protocluster core region is ∼2 dex above that in the coeval blank field (e.g. Lapi et al. 2011; Koprowski et al. 2017; Gruppioni et al. 2020; Fujimoto et al. 2024). Obscured SFR densities that are orders of magnitude higher than those in blank fields have also been observed in other high-redshift protoclusters (e.g. Oteo et al. 2018; Lacaille et al. 2019; Hill et al. 2020; Zhang et al. 2024). In line with what has been seen in the number count, the luminosity function shows evidence of a declining (or at least a flat) faint end, suggesting a lack of faint DSFGs in the SSA22 protocluster core region: if the functional form is the same as the blank fields, then by scaling the z ∼ 3 field luminosity function to match the two brightest flux bins of SSA22, we would expect much more sources at S1.17 mm < 1 mJy than what has been observed. The overall shape of the rest-frame 250 μm luminosity function of the SSA22 protocluster core region is reminiscent of the Gaussian-shape bright end of the optical luminosity function of low-redshift galaxy clusters (e.g. Lobo et al. 1997; Wilson et al. 1997; Bernardi et al. 2003). This points to an evolutionary link between protocluster and local galaxy clusters and supports the idea that the massive early-type galaxies in local clusters have formed the bulk of their stellar mass during star formation events enshrouded by dust at z ≳ 2 − 3 (e.g. Stach et al. 2017; Cooke et al. 2019; Smail 2024). Finally, it is notable that recent high-resolution JWST and ALMA observations of DSFGs in the SSA22 protocluster core have revealed evidence of growing bulge components behind dust obscuration (Umehata et al. 2025a), which again suggests that we are witnessing the early formation phase of the massive end of the galaxy population in a protocluster.
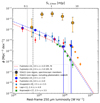 |
Fig. 4. 250 μm monochromatic luminosity function of the SSA22 protocluster core region at z = 3.09. The blank field results at similar redshifts from single-dish (Lapi et al. 2011; Koprowski et al. 2017) or ALMA surveys (Gruppioni et al. 2020; Fujimoto et al. 2024) and the double power law (DPL) fits from Fujimoto et al. (2024) are also plotted. The vertical dashed and dotted lines mark the 90% and 50% completeness, respectively. Total infrared luminosities are converted to that at 250 μm by assuming a modified blackbody with a temperature of 35 K and an emissivity of 1.8. |
4.3. Stellar mass and SFR of the SSA22 protocluster member galaxies
In Fig. 5, the SSA22 protocluster member galaxies have SFRs overlapping with the SFMS, but the distributions of M⋆ and SFR are different from field DSFGs. The differences are at > 3σ significance levels from a two-sided KS test except for the M⋆ distributions of SSA22 protocluster members and GOODS-ALMA DSFGs, which differ at > 2σ. Overall, SSA22 protocluster galaxies have lower SFRs and smaller M⋆, and we note that it is unlikely that the differences are driven by the choice of spectral energy distribution fitting codes because their results usually agree within error (Pacifici et al. 2023). Instead, it can be driven by the fainter fluxes of our sample: the median 1.17 mm fluxes are 0.8, 1.3 and 2.0 mJy for SSA22 protocluster member, GOODS-ALMA and AS2UDS+AS2COSMOS DSFGs, respectively. The deeper flux limit of our survey can pick up lower SFRs and less massive systems, and the median M⋆ of each sample (4.6 × 10¹⁰ M⊙, 8.5 × 10¹⁰ M⊙, 12 × 1010 M⊙) roughly scales as the median 1.17 mm fluxes. Since sub-millimetre and millimetre fluxes reflect a combination of the dust mass and SFR ( ), this is the expected behaviour if we further assume Mdust ∝ M⋆ and consider the fact that none of the SSA22 protocluster member galaxies have a SFR three times higher than the SFMS, unlike the field DSFGs. As Mdust is a proxy to total gas mass (e.g. Scoville et al. 2016; Hodge & da Cunha 2020), the above results suggest the current star formation in SSA22 protocluster member galaxies occurs in a self-regulated way powered by a large amount of fresh gas supply at the z = 3.09 cosmic web node (Umehata et al. 2019), rather than short-lived starbursts induced by major merger. In addition, as will be presented in a future paper, [C II] observations reveal that the majority of bright SSA22 protocluster member DSFGs are regular rotating disks with widespread star formation (see also Umehata et al. 2025a) instead of late-stage major merger, and the brightest one, A1, is a massive spiral galaxy (Umehata et al. 2025b). These observations further support our argument about secular star formation. A similar conclusion has also been drawn for the Spiderweb protocluster (Pérez-Martínez et al. 2024).
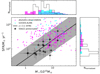 |
Fig. 5. SSA22 protocluster member galaxies (black circles) in the M⋆–SFR plane. The solid line shows the SFMS at z = 3.1 from Speagle et al. (2014). The shaded regions indicate a three times difference from the SFMS. The magenta and cyan circles show 2.8 < z < 3.4 DSFGs from ALMA blank field mosaic (GOODS-ALMA; Franco et al. 2018, 2020) and single-dish follow-up (AS2UDS+AS2COSMOS; Dudzevičiūtė et al. 2020; Simpson et al. 2020; Ikarashi et al., in prep.) surveys. |
5. Summary
In this paper we have presented a deep ALMA 1.17 mm continuum mosaic observation to study the faint DSFG population in an 8 arcmin2 core region of the z = 3.09 SSA22 protocluster. The continuum image has ≈1″ resolution and an RMS of ≈25 μJy beam−1, which is approximately 2.4 times the depth in the previous study, Umehata et al. (2017). Adopting a S/N > 4.2 cut, we detect 53 continuum sources, doubling the number of detections in this field. We searched for counterparts at other wavelengths using optical-to-mid-infrared imaging data of the SSA22 field. For 43 of the 44 sources with robust counterparts in NIR bands, the redshift, M⋆, and SFR were also derived from the photometric data. We identify 18 of the 53 sources as SSA22 protocluster members with spectroscopic redshifts within Δz = 0.1 of z = 3.09.
We computed 1.17 mm number counts and find: (1) an excess of 1.17 mm continuum sources at brighter fluxes (more than twice more blank fields at ≳1 mJy), which is produced by the z = 3.09 SSA22 protocluster; and (2) agreement with blank field surveys after excluding SSA22 protocluster member galaxies. The observed excess of bright 1.17 mm sources is driven by an overabundance of massive DSFGs in the SSA22 protocluster core, but the SFR in individual member galaxies is not significantly elevated compared to the expectation for their stellar masses, suggesting the SSA22 protocluster core environment accelerates the formation of massive galaxies mainly via huge amounts of gas from the cosmic web instead of frequent major mergers. We also computed the rest-frame 250 μm luminosity function of the protocluster core region and find evidence of a declining faint end that mimics the shape of the bright end optical luminosity function of low-redshift galaxy clusters. These results suggest the ongoing build-up of a future galaxy cluster, adding to the growing body of evidence that massive early-type galaxies in local clusters formed the bulk of their stellar mass in dusty star formation episodes at high redshifts.
Acknowledgments
This work is supported by the NAOJ ALMA Scientific Research Grant Code 2024-26A and JSPS grant-in-aid No. 22H04939, 23K20035, 24H00004. IRS acknowledges support from STFC (ST/X001075/1). This paper makes use of the following ALMA data: ADS/JAO.ALMA #2013.1.00162.S, #2017.1.01332.S, #2022.1.00680.S and #2023.1.01206.S. ALMA is a partnership of ESO (representing its member states), NSF (USA), and NINS (Japan), together with NRC (Canada), MOST and ASIAA (Taiwan), and KASI (Republic of Korea), in cooperation with the Republic of Chile. The Joint ALMA Observatory is operated by ESO, AUI/NRAO and NAOJ. Some of the data presented in this paper were obtained from the Mikulski Archive for Space Telescopes (MAST) at the Space Telescope Science Institute. The specific observations analysed can be accessed via https://doi.org/10.17909/d5ma-0904. STScI is operated by the Association of Universities for Research in Astronomy, Inc., under NASA contract NAS5–26555. Support to MAST for these data is provided by the NASA Office of Space Science via grant NAG5–7584 and by other grants and contracts.
References
- Aihara, H., Armstrong, R., Bickerton, S., et al. 2018, PASJ, 70, S8 [NASA ADS] [Google Scholar]
- Alaghband-Zadeh, S., Chapman, S. C., Swinbank, A. M., et al. 2013, MNRAS, 435, 1493 [Google Scholar]
- Ao, Y., Matsuda, Y., Henkel, C., et al. 2017, ApJ, 850, 178 [Google Scholar]
- Arnouts, S., Schiminovich, D., Ilbert, O., et al. 2005, ApJ, 619, L43 [NASA ADS] [CrossRef] [Google Scholar]
- Arrigoni Battaia, F., Chen, C.-C., Fumagalli, M., et al. 2018, A&A, 620, A202 [NASA ADS] [CrossRef] [EDP Sciences] [Google Scholar]
- Bernardi, M., Sheth, R. K., Annis, J., et al. 2003, AJ, 125, 1849 [NASA ADS] [CrossRef] [Google Scholar]
- Béthermin, M., Fudamoto, Y., Ginolfi, M., et al. 2020, A&A, 643, A2 [NASA ADS] [CrossRef] [EDP Sciences] [Google Scholar]
- Bond, J. R., Kofman, L., & Pogosyan, D. 1996, Nature, 380, 603 [NASA ADS] [CrossRef] [Google Scholar]
- Boylan-Kolchin, M., Springel, V., White, S. D. M., Jenkins, A., & Lemson, G. 2009, MNRAS, 398, 1150 [Google Scholar]
- Bradley, L., Sipőcz, B., Robitaille, T., et al. 2024, https://doi.org/10.5281/zenodo.13989456 [Google Scholar]
- Brammer, G. B., van Dokkum, P. G., & Coppi, P. 2008, ApJ, 686, 1503 [Google Scholar]
- Carniani, S., Maiolino, R., De Zotti, G., et al. 2015, A&A, 584, A78 [NASA ADS] [CrossRef] [EDP Sciences] [Google Scholar]
- CASA Team (Bean, B., et al.) 2022, PASP, 134, 114501 [NASA ADS] [CrossRef] [Google Scholar]
- Casey, C. M., Cooray, A., Capak, P., et al. 2015, ApJ, 808, L33 [NASA ADS] [CrossRef] [Google Scholar]
- Chapman, S. C., Scott, D., Windhorst, R. A., et al. 2004a, ApJ, 606, 85 [NASA ADS] [CrossRef] [Google Scholar]
- Chapman, S. C., Smail, I., Blain, A. W., & Ivison, R. J. 2004b, ApJ, 614, 671 [Google Scholar]
- Chapman, S. C., Blain, A., Ibata, R., et al. 2009, ApJ, 691, 560 [NASA ADS] [CrossRef] [Google Scholar]
- Chen, J., Ivison, R. J., Zwaan, M. A., et al. 2023, MNRAS, 518, 1378 [Google Scholar]
- Clements, D. L., Braglia, F., Petitpas, G., et al. 2016, MNRAS, 461, 1719 [NASA ADS] [CrossRef] [Google Scholar]
- Cooke, E. A., Smail, I., Stach, S. M., et al. 2019, MNRAS, 486, 3047 [Google Scholar]
- Cowie, L. L., Songaila, A., Hu, E. M., & Cohen, J. G. 1996, AJ, 112, 839 [Google Scholar]
- Dannerbauer, H., Kurk, J. D., De Breuck, C., et al. 2014, A&A, 570, A55 [NASA ADS] [CrossRef] [EDP Sciences] [Google Scholar]
- Dudzevičiūtė, U., Smail, I., Swinbank, A. M., et al. 2020, MNRAS, 494, 3828 [Google Scholar]
- Franco, M., Elbaz, D., Béthermin, M., et al. 2018, A&A, 620, A152 [NASA ADS] [CrossRef] [EDP Sciences] [Google Scholar]
- Franco, M., Elbaz, D., Zhou, L., et al. 2020, A&A, 643, A30 [NASA ADS] [CrossRef] [EDP Sciences] [Google Scholar]
- Fujimoto, S., Kohno, K., Ouchi, M., et al. 2024, ApJS, 275, 36 [NASA ADS] [Google Scholar]
- Geach, J. E., Matsuda, Y., Smail, I., et al. 2005, MNRAS, 363, 1398 [Google Scholar]
- Gómez-Guijarro, C., Elbaz, D., Xiao, M., et al. 2022, A&A, 658, A43 [NASA ADS] [CrossRef] [EDP Sciences] [Google Scholar]
- González-López, J., Novak, M., Decarli, R., et al. 2020, ApJ, 897, 91 [CrossRef] [Google Scholar]
- Gruppioni, C., Béthermin, M., Loiacono, F., et al. 2020, A&A, 643, A8 [NASA ADS] [CrossRef] [EDP Sciences] [Google Scholar]
- Gunn, J. E., & Gott, J. R. 1972, ApJ, 176, 1 [NASA ADS] [CrossRef] [Google Scholar]
- Hatsukade, B., Kohno, K., Umehata, H., et al. 2016, PASJ, 68, 36 [NASA ADS] [CrossRef] [Google Scholar]
- Hatsukade, B., Kohno, K., Yamaguchi, Y., et al. 2018, PASJ, 70, 105 [Google Scholar]
- Hayashino, T., Matsuda, Y., Tamura, H., et al. 2004, AJ, 128, 2073 [Google Scholar]
- Hayatsu, N. H., Matsuda, Y., Umehata, H., et al. 2017, PASJ, 69, 45 [Google Scholar]
- Hill, R., Chapman, S., Scott, D., et al. 2020, MNRAS, 495, 3124 [NASA ADS] [CrossRef] [Google Scholar]
- Hodge, J. A., & da Cunha, E. 2020, Roy. Soc. Open Sci., 7, 200556 [NASA ADS] [CrossRef] [Google Scholar]
- Hsieh, B.-C., Wang, W.-H., Hsieh, C.-C., et al. 2012, ApJS, 203, 23 [NASA ADS] [CrossRef] [Google Scholar]
- IRSA 2022, Spitzer Heritage Archive [Google Scholar]
- Ito, K., Tanaka, M., Valentino, F., et al. 2023, ApJ, 945, L9 [NASA ADS] [CrossRef] [Google Scholar]
- Ivison, R. J., Dunlop, J. S., Smail, I., et al. 2000, ApJ, 542, 27 [CrossRef] [Google Scholar]
- Iwata, I., Inoue, A. K., Matsuda, Y., et al. 2009, ApJ, 692, 1287 [Google Scholar]
- Karim, A., Swinbank, A. M., Hodge, J. A., et al. 2013, MNRAS, 432, 2 [Google Scholar]
- Kato, Y., Matsuda, Y., Smail, I., et al. 2016, MNRAS, 460, 3861 [Google Scholar]
- Kinney, A. L., Bohlin, R. C., Calzetti, D., Panagia, N., & Wyse, R. F. G. 1993, ApJS, 86, 5 [CrossRef] [Google Scholar]
- Koprowski, M. P., Dunlop, J. S., Michałowski, M. J., et al. 2017, MNRAS, 471, 4155 [Google Scholar]
- Kubo, M., Uchimoto, Y. K., Yamada, T., et al. 2013, ApJ, 778, 170 [NASA ADS] [CrossRef] [Google Scholar]
- Kubo, M., Yamada, T., Ichikawa, T., et al. 2015, ApJ, 799, 38 [NASA ADS] [CrossRef] [Google Scholar]
- Kubo, M., Yamada, T., Ichikawa, T., et al. 2016, MNRAS, 455, 3333 [CrossRef] [Google Scholar]
- Kubo, M., Umehata, H., Matsuda, Y., et al. 2021, ApJ, 919, 6 [NASA ADS] [CrossRef] [Google Scholar]
- Lacaille, K. M., Chapman, S. C., Smail, I., et al. 2019, MNRAS, 488, 1790 [NASA ADS] [CrossRef] [Google Scholar]
- Lapi, A., González-Nuevo, J., Fan, L., et al. 2011, ApJ, 742, 24 [NASA ADS] [CrossRef] [Google Scholar]
- Lawrence, A., Warren, S. J., Almaini, O., et al. 2007, MNRAS, 379, 1599 [Google Scholar]
- Lehmer, B. D., Alexander, D. M., Chapman, S. C., et al. 2009a, MNRAS, 400, 299 [Google Scholar]
- Lehmer, B. D., Alexander, D. M., Geach, J. E., et al. 2009b, ApJ, 691, 687 [Google Scholar]
- Lehmer, B. D., Lucy, A. B., Alexander, D. M., et al. 2013, ApJ, 765, 87 [NASA ADS] [CrossRef] [Google Scholar]
- Lobo, C., Biviano, A., Durret, F., et al. 1997, A&A, 317, 385 [NASA ADS] [Google Scholar]
- Matsuda, Y., Yamada, T., Hayashino, T., et al. 2005, ApJ, 634, L125 [Google Scholar]
- McConachie, I., Wilson, G., Forrest, B., et al. 2022, ApJ, 926, 37 [NASA ADS] [CrossRef] [Google Scholar]
- Miller, T. B., Chapman, S. C., Aravena, M., et al. 2018, Nature, 556, 469 [CrossRef] [Google Scholar]
- Nakamura, E., Inoue, A. K., Hayashino, T., et al. 2011, MNRAS, 412, 2579 [Google Scholar]
- Nelan, J. E., Smith, R. J., Hudson, M. J., et al. 2005, ApJ, 632, 137 [Google Scholar]
- Ono, Y., Ouchi, M., Kurono, Y., & Momose, R. 2014, ApJ, 795, 5 [NASA ADS] [CrossRef] [Google Scholar]
- Oteo, I., Ivison, R. J., Dunne, L., et al. 2018, ApJ, 856, 72 [Google Scholar]
- Overzier, R. A. 2016, A&ARv, 24, 14 [Google Scholar]
- Pacifici, C., Iyer, K. G., Mobasher, B., et al. 2023, ApJ, 944, 141 [NASA ADS] [CrossRef] [Google Scholar]
- Pensabene, A., Cantalupo, S., Cicone, C., et al. 2024, A&A, 684, A119 [NASA ADS] [CrossRef] [EDP Sciences] [Google Scholar]
- Pérez-MartÃnez, J. M., Dannerbauer, H., Koyama, Y., et al. 2024, ApJ, 977, 74 [Google Scholar]
- Planck Collaboration I. 2020, A&A, 641, A1 [NASA ADS] [CrossRef] [EDP Sciences] [Google Scholar]
- Scoville, N., Sheth, K., Aussel, H., et al. 2016, ApJ, 820, 83 [Google Scholar]
- Simpson, J. M., Smail, I., Dudzevičiūtė, U., et al. 2020, MNRAS, 495, 3409 [Google Scholar]
- Smail, I. 2024, MNRAS, 529, 2290 [Google Scholar]
- Speagle, J. S., Steinhardt, C. L., Capak, P. L., & Silverman, J. D. 2014, ApJS, 214, 15 [Google Scholar]
- Stach, S. M., Swinbank, A. M., Smail, I., et al. 2017, ApJ, 849, 154 [NASA ADS] [CrossRef] [Google Scholar]
- Stach, S. M., Smail, I., Swinbank, A. M., et al. 2018, ApJ, 860, 161 [Google Scholar]
- Steidel, C. C., Adelberger, K. L., Dickinson, M., et al. 1998, ApJ, 492, 428 [Google Scholar]
- Steidel, C. C., Rudie, G. C., Strom, A. L., et al. 2014, ApJ, 795, 165 [Google Scholar]
- Stevens, J. A., Ivison, R. J., Dunlop, J. S., et al. 2003, Nature, 425, 264 [NASA ADS] [CrossRef] [Google Scholar]
- Tamura, Y., Kohno, K., Nakanishi, K., et al. 2009, Nature, 459, 61 [Google Scholar]
- Tozzi, P., Pentericci, L., Gilli, R., et al. 2022, A&A, 662, A54 [NASA ADS] [CrossRef] [EDP Sciences] [Google Scholar]
- Tsujita, A., Kohno, K., Huang, S., et al. 2024, ArXiv e-prints [arXiv:2406.09890] [Google Scholar]
- Umehata, H., Tamura, Y., Kohno, K., et al. 2014, MNRAS, 440, 3462 [Google Scholar]
- Umehata, H., Tamura, Y., Kohno, K., et al. 2017, ApJ, 835, 98 [Google Scholar]
- Umehata, H., Fumagalli, M., Smail, I., et al. 2019, Science, 366, 97 [Google Scholar]
- Umehata, H., Smail, I., Swinbank, A. M., et al. 2020, A&A, 640, L8 [NASA ADS] [CrossRef] [EDP Sciences] [Google Scholar]
- Umehata, H., Smail, I., Steidel, C. C., et al. 2021, ApJ, 918, 69 [NASA ADS] [CrossRef] [Google Scholar]
- Umehata, H., Kubo, M., Smail, I., et al. 2025a, ArXiv e-prints [arXiv:2502.01868] [Google Scholar]
- Umehata, H., Steidel, C. C., Smail, I., et al. 2025b, PASJ, 77, 43 [Google Scholar]
- Wang, G. C. P., Chapman, S. C., Sulzenauer, N., et al. 2025, ApJ, 983, 69 [Google Scholar]
- Webb, T. M. A., Yamada, T., Huang, J. S., et al. 2009, ApJ, 692, 1561 [NASA ADS] [CrossRef] [Google Scholar]
- Whitaker, K. E., Pope, A., Cybulski, R., et al. 2017, ApJ, 850, 208 [NASA ADS] [CrossRef] [Google Scholar]
- Wilson, G., Smail, I., Ellis, R. S., & Couch, W. J. 1997, MNRAS, 284, 915 [Google Scholar]
- Yamada, T., Nakamura, Y., Matsuda, Y., et al. 2012, AJ, 143, 79 [Google Scholar]
- Zhang, Y. H., Dannerbauer, H., Pérez-MartÃnez, J. M., et al. 2024, A&A, 692, A22 [NASA ADS] [CrossRef] [EDP Sciences] [Google Scholar]
Appendix A: Source catalogue
S/N> 4.2 sources detected in the deep SSA22 1.17 mm mosaic.
Appendix B: Note on new spectroscopic redshifts
In this section we give a brief overview of new spectroscopic redshift measurements. For these sources, the VLT/MUSE spectra are shown in Fig. B.1, B.3 and ALMA band 3 spectra are shown in Fig. B.4. The sources and their spectral features are described below.
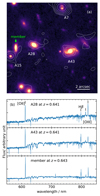 |
Fig. B.1. (a) JWST/NIRCam F444W image of the A28/A43 group. The ALMA 1.17 mm continuum is overlaid as white contours in levels of 2, 4, 8, 16, 32…×RMS. (b) VLT/MUSE spectra of A28, A43, and another group member. The horizontal dashed line indicates zero flux. |
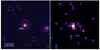 |
Fig. B.2. JWST/NIRCam F444W (left) and Chandra 0.5−8 keV images of A48 (right). ALMA 1.17 mm continuum is overlaid as white contours in levels of 2× and 4×RMS. |
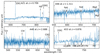 |
Fig. B.3. MUSE spectra of A21, A46, A48, and A53. The identified spectral features are marked. |
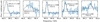 |
Fig. B.4. ALMA band 3 spectra of A20, A36, A15, A38, and A41. The black curves indicate the best-fit Gaussian profile of the CO lines. |
A28 and A43: The detection of [O II], Hβ and [O III] emission lines suggests these two sources are members of a z = 0.64 galaxy group, shown in panel (a) of Fig. B.1. Another member galaxy at z = 0.643 is identified by the MUSE data but has no 1.1 mm counterpart (panel (b) of Fig. B.1). A tidal tail is visible in the north of A43. A28 is bright in the Spitzer MIPS 24 μm band, suggesting AGN activity.
A21: similar to A28 and A43, the source has multiple emission lines in the MUSE spectrum, which we identify as [O II], Hβ and [O III] at z = 0.709. The Balmer and metal absorption lines are also visible.
A46: There are many absorption features in the continuum, but no obvious emission line is detected. We identify the features to be Fe II, Mg II, and Mg I absorption lines in rest-frame ultraviolet (Kinney et al. 1993) and determine its redshift z = 1.511.
A48: We find three emission lines for this source: C II, C IV, and C III] at z = 2.688. The source hosts an AGN, as suggested by the broad C IV emission line (FWHM≈880 km s−1), detection in the Chandra X-ray data (Lehmer et al. 2009a,b), and a compact morphology in the JWST/NIRCam F444W image (Fig B.2).
A53: The source has only one emission line detected. We identify the line as [O II] at z = 0.876. Based on this redshift, we mark the expected position of strong absorption lines. H10, H9, and Ca II K+Hϵ are clearly detected, but the remaining features are somewhat noisy.
A20: The source has one emission line on the edge of the ALMA Band 3 spectrum. The single-peaked photometric redshift of z ∼ 1.5 leads to a unique solution as CO(2−1) at z = 1.399.
A36: Similar to A20, CO(2−1) at z = 1.397 is assigned to the emission line on the edge of Band 3 spectrum based on its photometric redshift z ∼ 1.4.
A15: We update the redshift in Umehata et al. (2019) to z = 3.086 using new CO(3−2) data. It is close to the z = 0.643 member galaxy of the A28/A43 group and has a point source-like appearance in JWST images and an AGN signature. A15 is detected in Lyα emission.
A38: This source is identified as an SSA22 protocluster member, with redshift z = 3.087 from the new CO(3−2) detection.
A41: We update the [O III] redshift in Umehata et al. (2019) to z = 3.098 using new CO(3−2) data. The source is a member of the SSA22 protocluster.
Appendix C: Postage stamp images
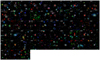 |
Fig. C.1. Ground-based imaging (R, G, B = Ks, z′, V) of 1.17 mm sources (white contours in 2, 4, 8, 16…×RMS levels). The images are smoothed to a common resolution of |

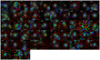 |
Fig. C.2. Same as Fig. C.1 but showing Spitzer IRAC data (R=IRAC3+IRAC4, G=IRAC2, B=IRAC1) without the 1.17 mm contour. |
All Tables
Rest-frame 250 μm luminosity function of the SSA22 protocluster core region at z = 3.09 ± 0.01.
All Figures
|
Fig. 1. Left: 1.17 mm continuum map displayed in the flux range −2σ − 20σ. The black ellipse in the lower left indicates the beam FWHM. Sources with S/N > 4.2 are indicated with their ID number in Table 1. The IDs of z = 3.09 protocluster members confirmed by spectroscopy are highlighted in cyan. Sources with non-zero values at z = 3.09 in their photometric redshift probability functions (A34, A47, A49, and A55) are in yellow. The white contour indicates a primary beam response of 20%. The coloured contours show the areas with spectroscopic coverage from VLT/MUSE (green), the Umehata et al. (2019) shallow CO mosaic (orange), and deep CO observations of A1 and A4 (red). |
| In the text | |
|
Fig. 2. (a) Histograms of the number of positive and negative peaks as a function of S/N. The scatter plot indicates the false detection rate as a function of S/N. The dashed line marks the detection threshold of S/N > 4.2, corresponding to a 12% spurious rate (the dotted line). (b) Completeness (black line) as a function of intrinsic flux and effective survey area (red line) in which a source can be detected with S/N > 4.2 as a function of the peak flux per beam. The vertical line marks the typical flux at the detection threshold of S/N > 4.2. (c) Ratio between measured and intrinsic fluxes as a function of S/N. Red squares with error bars indicate the median and standard deviation. The flux boosting is less than ∼10% at S/N > 4.2. |
| In the text | |
|
Fig. 3. 1.17 mm source number count of the deep SSA22 field. For comparison, we show interferometric number counts of random fields from the literature, with fluxes converted to 1.17 mm: Karim et al. (2013), Ono et al. (2014), Carniani et al. (2015), Hatsukade et al. (2016, 2018), Stach et al. (2018), González-López et al. (2020), Simpson et al. (2020), Béthermin et al. (2020), Gómez-Guijarro et al. (2022), Chen et al. (2023), and Fujimoto et al. (2024). We also present the total number count of the z = 2.16 Spiderweb protocluster (Zhang et al. 2024). The dashed line shows the best-fit Schechter function from Gómez-Guijarro et al. (2022). |
| In the text | |
|
Fig. 4. 250 μm monochromatic luminosity function of the SSA22 protocluster core region at z = 3.09. The blank field results at similar redshifts from single-dish (Lapi et al. 2011; Koprowski et al. 2017) or ALMA surveys (Gruppioni et al. 2020; Fujimoto et al. 2024) and the double power law (DPL) fits from Fujimoto et al. (2024) are also plotted. The vertical dashed and dotted lines mark the 90% and 50% completeness, respectively. Total infrared luminosities are converted to that at 250 μm by assuming a modified blackbody with a temperature of 35 K and an emissivity of 1.8. |
| In the text | |
|
Fig. 5. SSA22 protocluster member galaxies (black circles) in the M⋆–SFR plane. The solid line shows the SFMS at z = 3.1 from Speagle et al. (2014). The shaded regions indicate a three times difference from the SFMS. The magenta and cyan circles show 2.8 < z < 3.4 DSFGs from ALMA blank field mosaic (GOODS-ALMA; Franco et al. 2018, 2020) and single-dish follow-up (AS2UDS+AS2COSMOS; Dudzevičiūtė et al. 2020; Simpson et al. 2020; Ikarashi et al., in prep.) surveys. |
| In the text | |
|
Fig. B.1. (a) JWST/NIRCam F444W image of the A28/A43 group. The ALMA 1.17 mm continuum is overlaid as white contours in levels of 2, 4, 8, 16, 32…×RMS. (b) VLT/MUSE spectra of A28, A43, and another group member. The horizontal dashed line indicates zero flux. |
| In the text | |
|
Fig. B.2. JWST/NIRCam F444W (left) and Chandra 0.5−8 keV images of A48 (right). ALMA 1.17 mm continuum is overlaid as white contours in levels of 2× and 4×RMS. |
| In the text | |
|
Fig. B.3. MUSE spectra of A21, A46, A48, and A53. The identified spectral features are marked. |
| In the text | |
|
Fig. B.4. ALMA band 3 spectra of A20, A36, A15, A38, and A41. The black curves indicate the best-fit Gaussian profile of the CO lines. |
| In the text | |
|
Fig. C.1. Ground-based imaging (R, G, B = Ks, z′, V) of 1.17 mm sources (white contours in 2, 4, 8, 16…×RMS levels). The images are smoothed to a common resolution of |
| In the text | |
|
Fig. C.2. Same as Fig. C.1 but showing Spitzer IRAC data (R=IRAC3+IRAC4, G=IRAC2, B=IRAC1) without the 1.17 mm contour. |
| In the text | |
Current usage metrics show cumulative count of Article Views (full-text article views including HTML views, PDF and ePub downloads, according to the available data) and Abstracts Views on Vision4Press platform.
Data correspond to usage on the plateform after 2015. The current usage metrics is available 48-96 hours after online publication and is updated daily on week days.
Initial download of the metrics may take a while.