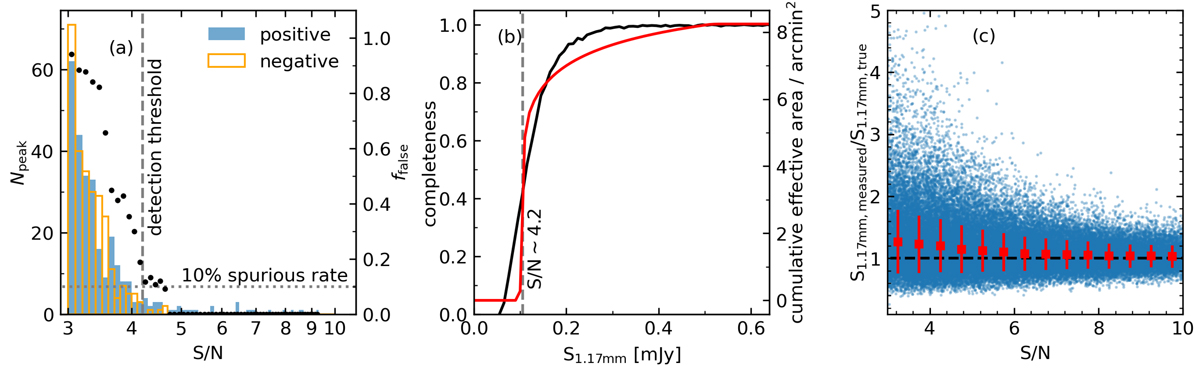
Fig. 2.
Download original image
(a) Histograms of the number of positive and negative peaks as a function of S/N. The scatter plot indicates the false detection rate as a function of S/N. The dashed line marks the detection threshold of S/N > 4.2, corresponding to a 12% spurious rate (the dotted line). (b) Completeness (black line) as a function of intrinsic flux and effective survey area (red line) in which a source can be detected with S/N > 4.2 as a function of the peak flux per beam. The vertical line marks the typical flux at the detection threshold of S/N > 4.2. (c) Ratio between measured and intrinsic fluxes as a function of S/N. Red squares with error bars indicate the median and standard deviation. The flux boosting is less than ∼10% at S/N > 4.2.
Current usage metrics show cumulative count of Article Views (full-text article views including HTML views, PDF and ePub downloads, according to the available data) and Abstracts Views on Vision4Press platform.
Data correspond to usage on the plateform after 2015. The current usage metrics is available 48-96 hours after online publication and is updated daily on week days.
Initial download of the metrics may take a while.