| Issue |
A&A
Volume 689, September 2024
|
|
|---|---|---|
| Article Number | A130 | |
| Number of page(s) | 16 | |
| Section | Extragalactic astronomy | |
| DOI | https://doi.org/10.1051/0004-6361/202450225 | |
| Published online | 06 September 2024 | |
Fast supermassive black hole growth in the SPT2349–56 protocluster at z = 4.3
1
INAF – Osservatorio di Astrofisica e Scienza dello Spazio di Bologna, Via Gobetti 93/3, 40129 Bologna, Italy
2
Department of Astronomy & Astrophysics, 525 Davey Lab, The Pennsylvania State University, University Park, PA 16802, USA
3
Institute for Gravitation and the Cosmos, The Pennsylvania State University, University Park, PA 16802, USA
4
Department of Physics, The Pennsylvania State University, University Park, PA 16802, USA
5
European Southern Observatory (ESO), Karl-Schwarzschild-Strasse 2, 85748 Garching, Germany
6
School of Cosmic Physics, Dublin Institute for Advanced Studies, 31 Fitzwilliam Place, Dublin D02 XF86, Ireland
7
Institute for Astronomy, University of Edinburgh, Royal Observatory, Blackford Hill, Edinburgh EH9 3HJ, UK
8
ARC Centre of Excellence for All Sky Astrophysics in 3 Dimensions (ASTRO 3D), Australia
9
Department of Physics, University of Arkansas, 226 Physics Building, 825 West Dickson Street, Fayetteville, AR 72701, USA
10
Dipartimento di Fisica e Astronomia, Università degli Studi di Bologna, Via Gobetti 93/2, 40129 Bologna, Italy
11
INAF – Osservatorio Astrofisico di Arcetri, Largo Enrico Fermi 5, 50125 Florence, Italy
Received:
3
April
2024
Accepted:
19
June
2024
Abstract
Context. Large-scale environment is one of the main physical drivers of galaxy evolution. The densest regions at high redshifts (i.e. z > 2 protoclusters) are gas-rich regions characterised by high star formation activity. The same physical properties that enhance star formation in protoclusters are also thought to boost the growth of supermassive black holes (SMBHs), most likely in heavily obscured conditions.
Aims. We aim to test this scenario by probing the active galactic nucleus (AGN) content of SPT2349–56: a massive, gas-rich, and highly star-forming protocluster core at z = 4.3 discovered as an overdensity of dusty star-forming galaxies (DSFGs). We compare our results with data on the field environment and other protoclusters.
Methods. We observed SPT2349–56 with Chandra (200 ks) and searched for X-ray emission from the known galaxy members. We also performed a spectral energy distribution fitting procedure to derive the physical properties of the discovered AGNs.
Results. In the X-ray band, we detected two protocluster members: C1 and C6, corresponding to an AGN fraction among DSFGs in the structure of ≈10%. This value is consistent with other protoclusters at z = 2 − 4, but higher than the AGN incidence among DSFGs in the field environment. Both AGNs are heavily obscured sources, hosted in star-forming galaxies with ≈3 × 10¹⁰ M⊙ stellar masses. We estimate that the intergalactic medium in the host galaxies contributes to a significant fraction (or even entirely) to the nuclear obscuration. In particular, C1 is a highly luminous (LX = 2 × 1045 erg s−1) and Compton-thick (NH = 2 × 1024 cm−2) AGN, likely powered by a MBH > 6 × 10⁸ M⊙ SMBH, assuming Eddington-limited accretion. Its high accretion rate suggests that it is in the phase of efficient growth that is generally required to explain the presence of extremely massive SMBHs in the centres of local galaxy clusters. Considering SPT2349–56 and DRC, a similar protocuster at z = 4, and under different assumptions on their volumes, we find that gas-rich protocluster cores at z ≈ 4 enhance the triggering of luminous (logLX/erg s−1 = 45 − 46) AGNs by three to five orders of magnitude with respect to the predictions from the AGN X-ray luminosity function at a similar redshift in the field environment. We note that this result is not solely driven by the overdensity of the galaxy population in the structures.
Conclusions. Our results indicate that gas-rich protoclusters at high redshift boost the growth of SMBHs, which will likely impact the subsequent evolution of the structures. Therefore, they stand as key science targets to obtain a complete understanding of the relation between the environment and galaxy evolution. Dedicated investigations of similar protoclusters are required to definitively confirm this conclusion with a higher statistical significance.
Key words: galaxies: active / galaxies: high-redshift / quasars: general / quasars: supermassive black holes / galaxies: starburst / X-rays: galaxies
Corresponding author; This email address is being protected from spambots. You need JavaScript enabled to view it. .
© The Authors 2024
 Open Access article, published by EDP Sciences, under the terms of the Creative Commons Attribution License (https://creativecommons.org/licenses/by/4.0), which permits unrestricted use, distribution, and reproduction in any medium, provided the original work is properly cited.
This article is published in open access under the Subscribe to Open model. This email address is being protected from spambots. You need JavaScript enabled to view it. to support open access publication.
1. Introduction
According to the hierarchical growth of cosmic structures, dense regions at high redshifts end up collapsing and merging into the most massive gravitationally bound objects in the local universe, namely, galaxy clusters. These clusters are characterised by more evolved galaxy populations than the field environment (e.g. Alberts et al. 2014); therefore, galaxy evolution must have been accelerated in their ancestors, such as protoclusters (e.g. Overzier 2016; Chiang et al. 2017). In these regions, star formation is efficiently fueled by large amounts of gas infalling from the forming cosmic web (e.g. Umehata et al. 2019) and is likely to be boosted by the high rates of galaxy interactions and mergers in these dense and unvirialised systems (e.g. Liu et al. 2023).
Radiative and mechanical feedback produced by gas accretion onto supermassive black holes (SMBHs) observed as active galactic nuclei (AGNs) play a fundamental role in regulating (and eventually hindering) further galaxy and SMBH growth in cluster members (e.g. Fabian 2012; Gilli et al. 2019; Gaspari et al. 2020). However, the effect of a dense environment on the triggering of nuclear activity at high redshift is still not well understood. X-ray observations are the best tools to investigate the incidence and physical properties of the AGN population in protoclusters, as bright X-ray emission is a reliable and nearly complete tracer of nuclear activity, even in the presence of heavy obscuration (e.g. Brandt & Alexander 2015; Ivison et al. 2019). Dedicated X-ray programs with Chandra generally find enhanced AGN activity in protoclusters with respect to the field environment at similar redshift and local galaxy clusters (e.g. Lehmer et al. 2009a, 2013; Digby-North et al. 2010; Tozzi et al. 2022a, but also see Yang et al. 2018a; Macuga et al. 2019). These results support a scenario in which the large reservoirs of gas and the high rate of galaxy interactions promote the growth of SMBHs in the protocluster galaxy members, in addition to boosting the star formation activity. Theoretical models (e.g. Hopkins et al. 2006) predict that these conditions favor fast, efficient, and possibly heavily obscured nuclear accretion. Most protocluster AGNs are indeed characterised as being heavily obscured (e.g. Vito et al. 2020; Monson et al. 2023). These properties are typical of the peak phases of SMBH mass building, after which AGN feedback hampers additional galaxy and SMBH growth, eventually impacting the entire cluster’s evolution. In addition, the AGN enhancement may also be an effect of galaxies in protoclusters being typically more massive than in the field environment (e.g. Monson et al. 2021), since luminous AGNs are typically found in galaxy with high stellar masses (e.g. Yang et al. 2017, 2018b).
Protocluster candidates are identified via detections of overdensities of galaxies, selected in a number of different ways (see Overzier 2016 and references therein). The identification of protocluster candidates as overdensities of dusty star-forming galaxies (DSFGs), Lyα emitters (LAEs), or Lyman-break galaxies (LBGs) are among the most efficient techniques up to z ≈ 8 (e.g. Laporte et al. 2022; Morishita et al. 2023). Recently, the high angular resolution and sensitivity of ALMA allowed for the identification of two extremely massive and star-forming overdensities of DSFGs, the distant red core (DRC) at z = 4.0 (e.g. Oteo et al. 2018; Ivison et al. 2020), and SPT2349–56 at z = 4.3 (e.g. Miller et al. 2018; Hill et al. 2020, 2022), originally discovered by Herschel and the South Pole Telescope, respectively (Vieira et al. 2010; Ivison et al. 2016). The cores of these structures extend to a few hundred kpc in projection and they are unique in terms of overdensity, total gas mass, and SFR density. Based on cluster evolutionary models and simulations, Oteo et al. (2018) and Hill et al. (2020) argued that DRC and SPT2349−56 are the likely progenitors of ≈1015 M⊙ Coma-like clusters in the local universe. DRC consists of at least 13 spectroscopically identified z ≈ 4.0 DSFGs with individual SFRs in the range of 50 − 3000 M⊙ yr−1, for a total of SFR ≈ 6500 M⊙ yr−1. A total molecular gas mass MH2 > 1012 M⊙ was estimated from the [C I](1−0) emission lines detected from the protocluster members.
SPT 2349–56 was identified with ALMA observations as an overdensity of 30 galaxies spectroscopically confirmed at z ≈ 4.3 via the detection of [C II] and CO(4−3) emission lines (Miller et al. 2018; Hill et al. 2020; Rotermund et al. 2021). Among them, 21 objects have been detected in sub-mm/mm continuum emission (850 μm, 1.1 mm, or 3.2 mm; Hill et al. 2020); in this paper, we refer to them as DSFGs. The protocluster members are located in a massive core with radius R ≲ 20 arcsec (≲100 kpc), along with two smaller components at ≈0.9 arcmin (≈0.75 Mpc) and ≈3.8 arcmin (≈1.5 Mpc) from the centre of the main overdensity. Numerical simulations predict that the galaxies in the central core of SPT2349–56 will eventually merge into the brightest cluster galaxy of the descendant structure (Rennehan et al. 2020). Similar arguments as those used for DRC return total values of SFR ≈ 8000 M⊙ yr−1 and Mvir ≈ 1013 M⊙. Notably, the derived SFR density is a factor of ten greater than the most extreme values found in simulations at the same redshift (Hill et al. 2020). A total gas mass of Mgas ≳ 3 × 10¹¹ M⊙ has been estimated from the luminosity of the carbon monoxide emission lines (Hill et al. 2020).
Using deep optical and near-IR observations, Apostolovski et al. (2024) and Rotermund et al. (2021) identified additional members of the SPT2349–56 core as LAEs (nine spectroscopically confirmed galaxies, although six of them are marked as ‘tentative’ in that work) and LBGs (four galaxies)1, respectively. One of the tentative LAEs is the counterpart of a sub-mm continuum detected galaxy with neither [C II] nor CO(4−3) emission in Hill et al. (2020), increasing the number of spectroscopically identified DSFGs in the structure to 22. Among the four LBGs in the protocluster core, two are likely counterparts of the DSFGs, known as C2 and C17 (Hill et al. 2022), while one has been found by Rotermund et al. (2021) to be a weak [C II] emitter that is not included in the Hill et al. (2020) sample, and one is the counterpart of a LAE. Thus, when accounting for the few galaxies selected with multiple methods, the total number of individual and spectroscopically confirmed protocluster members is 38.
Chapman et al. (2024) detected bright radio emission (L1.4 GHz, rest = (2.2 ± 0.2)×1026 W Hz−1), with a spectral index of α = −1.45 ± 0.16, where Fν ∝ να, from the inner region of the SPT2349–56 core, which is likely of AGN origin. The spatial resolution of the radio observations prevented the secure identification of the optical/IR couterpart, as a few protocluster members are consistent with being the host of the radio source and none of them shows clear AGN features at other wavelengths. Still, mainly based on its high mass, Chapman et al. (2024) proposed that one such galaxy, referred to as C6 in our work following the Hill et al. (2020) naming convention, is the AGN host.
Due to their extreme properties, these two protoclusters, at similar redshifts and identified via similar selection techniques, are unique testbeds for studying the link between the availability of huge reservoirs of gas in high-redshift overdense environments and SMBH growth in the galaxy members. Vito et al. (2020) used Chandra observations (140 ks) to investigate the AGN content of DRC, and identified two obscured AGNs among 13 DSFGs. These are the two brightest, gas-rich, most strongly star-forming members of the protocluster. They are possibly in a merger phase, as derived from a high angular-resolution ALMA observation of one of them. In particular, the X-ray brightest AGN ( ), namely DRC-2, has remarkable properties. It is as X-ray luminous as optically selected QSOs at all redshifts, but (in contrast) it is obscured by Compton-thick gas column densities; this is similar to (but even more extreme than) other populations of luminous obscured QSOs such as hot, dust-obscured galaxies (e.g. Vito et al. 2018a).
In this work, we present new Chandra observations (200 ks) of SPT2349–56. Our goals are to probe the population of AGNs and their physical properties in the extremely gas-rich and dense environment of SPT2349–56. We look to study, more generally, the effect of an overdense environment on SMBH growth in the early universe, by comparing the AGN content in z ≈ 4 gas-rich protoclusters with lower redshift structures and blank fields. Errors are reported at 68% confidence levels, while limits are given at 90% confidence levels. We refer to the 0.5 − 2 keV, 2 − 7 keV, and 0.5 − 7 keV energy ranges as the soft band, hard band, and full band, respectively. We assume solar metallicities and abundances (Anders & Grevesse 1989), and we adopt a flat cosmology with H0 = 67.7 km s−1 and Ωm = 0.307 (Planck Collaboration XIII 2016).
2. Data analysis
In this section, we describe the reduction of the Chandra observations (Sect. 2.1) and the source detection procedure (Sect. 2.2).
2.1. Data reduction
We observed the SPT2349–56 protocluster with Chandra for a total of 200 ks, split among nine pointings (see Table 1). The protocluster core was placed at the aimpoint of the ACIS-S detector, where the Chandra sensitivity is maximum, and all of the confirmed or candidate protocluster members are covered by the back-illuminated S3 chip. We reprocessed the Chandra observations with the chandra_repro script in CIAO 4.15 (Fruscione et al. 2006)2, using CALDB v4.10.43, and setting check_vf_pha=yes, since observations were taken in Very Faint mode.
Summary of the Chandra observations of SPT2349–56.
To correct the astrometry of the Chandra observations, we performed a source detection on each pointing with the wavdetect script with a significance threshold of 10−6. We then used the wcs_match and wcs_update tools to compute and apply the astrometric offsets with respect to a reference catalog. First, we applied a relative astrometric correction to each pointing using OBSID 25267 (i.e. the pointing with the longest exposure, see Table 1) as reference. Only point sources with PSF size of ≤3 arcsec and with ≥5 detected counts were considered. Then, we mapped the individual observations onto OBSID 25267 and merged all of the observations with the reproject_obs tool. We repeated the source-detection procedure on the merged dataset, but this time we matched the detected point sources to the Gaia DR3 catalog (Gaia Collaboration 2023)4 to derive and apply the absolute astrometric correction factors. Only two X-ray point sources could be matched with Gaia objects on the ACIS-S3 chip, with an average spatial offset of 0.15 arcsec. This value can be considered the systematic spatial uncertainty of the X-ray dataset.
We obtained images and exposure maps with the reproject_obs tool, while we extracted the spectra, response matrices, and ancillary files of the detected sources (see Sect. 2.2) from individual pointings using the specextract tool and added them using the mathpha, addrmf, and addarf HEASOFT tools5, respectively, weighting by the individual exposure times. The ancillary files, which were used to derive fluxes and luminosities, were aperture-corrected by setting via the correctpsf parameter in specextract.
2.2. Source detection and X-ray photometry
We assessed the detection of the SPT2349–56 protoclusters member candidates (Hill et al. 2020, 2022; Rotermund et al. 2021) in the soft, hard, and full bands using the binomial no-source probability (Weisskopf et al. 2007; Broos et al. 2007) as:
 (1)
(1)
where S is the total number of counts in the source region in the considered energy band, B is the total number of counts in the background region, N = S + B, and p = 1/(1 + BACKSCAL), with BACKSCAL being the ratio of the background and source region areas. The source counts are extracted from circular regions with R = 1″, whereas the background counts are measured from nearby regions free of evident X-ray sources. We checked that reasonably different choices of extraction regions returned consistent results. We defined (1 − PB) > 0.99 as the detection threshold, a value often used to assess the X-ray detections of objects with pre-determined positions (Vito et al. 2019, 2020). Due to the small projected distances between the protocluster members, especially in the core of the structure, the extraction regions may overlap. In such cases, we assign each detected photon to the nearest galaxy, to avoid double counting.
Two protocluster members were detected with a high level of significance in X-rays: sources C1 (1 − PB > 0.999 in both the hard and full bands) and C6 (1 − PB = 0.999 and 0.994 in the hard and full band, respectively), which are among the spectroscopically identified DSFGs in the core region of SPT2349–56 (Hill et al. 2020). Figs. 1 and 2 present X-ray cutouts of these two sources.
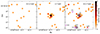 |
Fig. 1. Soft-band, hard-band, and full-band Chandra images (10″ × 10″) of C1, from left to right. In the right panel, we also plot the ALMA Band 7 continuum contours (in grey) and mark the positions (purple circles) of spectroscopically identified protocluster members. The contours are derived from the reduced ALMA data of Hill et al. (2020), with a beam size of 0.35″ × 0.29″, starting at 5σ with steps of 7σ. |
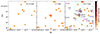 |
Fig. 2. Same as Fig. 1, but for source C6. We added in cyan the ATCA 2.2 GHz contours (beam size of 7.7″ × 4.2″), starting at 3σ with steps of 3σ, obtained from the data reduced and presented by Chapman et al. (2024). |
The net counts (reported in Table 2) were computed in the same R = 1″ region used for the detection for C6, whereas we used a larger region with R = 1.5″ for C1, given its relatively bright emission. We also derived the hardness ratios  , where S and H are the net counts in the soft and hard band, respectively. We obtained the corresponding effective power-law photon indices following the procedure of Vito et al. (2019), which are also reported in Table 2.
We visually inspected all of the remaining secure protocluster members or member candidates presented by Hill et al. (2020, 2022), Rotermund et al. (2021), Apostolovski et al. (2024). Three X-ray photons clustered on three contiguous pixels on top of the galaxy named LBG2 in Rotermund et al. (2021) were detected in the full band. This suggest the object might be a sub-threshold X-ray source.
3. Results
In this section, we report the results obtained from the X-ray observations of SPT2349–56. In Sects. 3.1 and 3.3, we present the results of a spectral analysis of the two detected X-ray sources, C1 and C6, respectively. In Sect. 3.4, we used the X-ray emission of these two galaxies together with the available optical-to-mm photometry to estimate the physical parameters of the AGN host galaxies via a spectral energy distribution (SED) fitting procedure. In Sect. 3.5 we investigate possible evidence of low-rate SMBh accretion in the individually undetected galaxies of the structure via an X-ray stacking analysis.
3.1. X-ray spectral analysis of C1
The relatively bright hard-band detection of C1 with no associated soft-band emission and the resulting flat effective photon index (Table 2) are strongly indicative of the presence of a large column density of gas (NH) obscuring this high-redshift galaxy. We performed a basic spectral analysis with XSPEC v.12.13 (Arnaud 1996)6 to measure physical quantities such as NH, the observed fluxes, and the intrinsic luminosity. Following the analysis of DRC-2 (Vito et al. 2020), we used the MYTorus model (Murphy & Yaqoob 2009), accounting for the Galactic absorption (Kalberla et al. 2005) and fixing Γ = 1.9, along with the normalisations of the scattered and line components to that of the transmitted component and an inclination angle of Θ = 90 degrees. Therefore, the only two parameters left free to vary were NH and the intrinsic power-law normalisation. In Fig. 3, we report the observed and response-corrected spectrum and best-fitting model, highlighting the hardness of the source, as typically found in cases of heavily obscured AGNs.
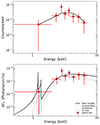 |
Fig. 3. Observed spectrum (red circles) and best-fitting MYTorus model (black line) of C1 (see Sect. 3.1) in the top panel: Response-corrected spectrum and best-fitting model in the bottom panel. We also show the individual additive components of the model with grey lines, as reported in the legend. In both panels, the spectrum is binned at 1σ for display purposes. |
Our best-fitting model returns  , implying that C1 is a Compton-thick AGN. The observed flux
  corresponds to an absorption-corrected, rest-frame luminosity of
  , that is, ≈1 dex greater than the break luminosity of the X-ray luminosity function at that redshift (e.g. Ueda et al. 2014; Aird et al. 2015; Vito et al. 2018b). In Fig. 4, we compare the column density and luminosity of C1 from the best-fitting model with other populations of AGNs over wide redshift ranges. C1 has an X-ray luminosity that is typical of bright optically selected blue and red QSOs. However, such objects are typically unobscured – or (at most) obscured by Compton-thin column densities of gas (e.g. Just et al. 2007; Martocchia et al. 2017; Lansbury et al. 2020), while C1 is even more obscured than hot dust-obscured galaxies (hot DOGs; e.g. Stern et al. 2014; Vito et al. 2018a), which are often considered as representative of an extreme phase of galaxy and SMBH growth, while X-ray selected Compton-thick AGNs and DSFGs have significantly lower luminosities. Intriguingly, C1 and DRC-2, both selected as luminous and obscured AGNs in z ≈ 4 gas-rich protoclusters, share the same position in Fig. 4. Only two other AGNs with similar X-ray luminosities have been discovered in other protoclusters (Ivison et al. 2019; Tozzi et al. 2022a), but they are unobscured or, at most, mildly obscured, sources. In particular, Ivison et al. (2019) detected broad Hα emission from the luminous AGN hosted in HATLAS J084933.4+021443, a DSFG in a z = 2.41 protocluster, which is surprising considering the expected high extinction in such a dust-rich galaxy.
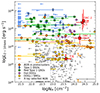 |
Fig. 4. X-ray luminosity versus column density for different populations of AGNs: optically selected Type-1 QSOs at z = 1.4 − 4.5 (blue symbols; from Just et al. 2007; Martocchia et al. 2017), dust-reddened QSOs at z = 0.4 − 3.2 (green symbols; from Urrutia et al. 2005; Banerji et al. 2014; Mountrichas et al. 2017; Goulding et al. 2018; Lansbury et al. 2020), DSFGs at z = 0.3 − 5.2 (yellow symbols; from Wang et al. 2013; Corral et al. 2016; Zou et al. 2020), Hot DOGs at at z = 1.0 − 4.6 (violet symbols; from Stern et al. 2014; Assef et al. 2016; Ricci et al. 2017; Vito et al. 2018a; Zappacosta et al. 2018), X-ray selected AGNs in the Spiderweb and SSA protoclusters (z = 2.2 − 3.2, orange symbols, Ivison et al. 2019; Tozzi et al. 2022a; Monson et al. 2023), and X-ray selected AGNs in the Chandra deep field-south at all redshifts (gray symbols, with median error bar showed in the bottom-right corner of the plot; from Li et al. 2019). The X-ray selected AGNs in SPT2349–56 and DRC are plotted as red stars and squares, respectively. C1 and DRC-2 (Vito et al. 2020) have remarkably similar physical properties. Their X-ray luminosities are similar to those of luminous optically selected QSOs, but obscured by gas column densities even thicker than those of hot DOGs. |
The X-ray luminosity of C1 translates into a bolometric luminosity Lbol ≈ 8 × 1046 erg s−1 according to the bolometric correction of Duras et al. (2020). Assuming that the SMBH powering C1 is accreting at the Eddington limit, we can place a lower limit on its mass of MSMBH ≈ 6.5 × 10⁸ M⊙ (but see the caveats raised by King 2024 about this approach). Therefore, either C1 is accreting at super-Eddington rate or it has already accumulated a significant fraction of the SMBH mass characterising AGNs in the centres of local galaxy clusters. Similar conclusions were also drawn for DRC-2 by Vito et al. (2020).
We note that the spectrum of C1 can be fitted equally well with a pure reflection model by multiplying the intrinsic power-law continuum by a constant equal to zero. In this case, we obtain a similar value of NH and a factor of ≈2 higher luminosity. We also tried leaving Γ free to vary, but the fit is not able to set constraints on its value.
3.2. A note on the possible foreground nature of the X-ray emission
Rotermund et al. (2021) reported the spectroscopic identification of a foreground galaxy at z = 2.54 along the line of sight of C1. Based on considerations on the blue optical colors, magnitudes, and [O III] 5007 Å emission-line width, these authors provided an upper limit on its stellar mass of 1.6 × 10⁹ M⊙. If this were the host galaxy, the spectral analysis would return  and
and  . Given the well known relation between AGN actvity and stellar mass of the host galaxies (e.g. Xue et al. 2010; Lusso et al. 2011; Wang et al. 2017; Yang et al. 2017, 2018b) it is highly unlikely that such a small object would host a moderately luminous AGN. Moreover, its rest-frame UV spectrum present no indications of AGN activity (Rotermund et al. 2021). Therefore, in this paper we assume that the X-ray source is hosted by the DSFG at z = 4.3.
3.3. X-ray spectral properties of C6
Due to the low number of detected X-ray counts, we did not attempt to perform a spectral fit of C6. Instead, we assumed a simple Γ = 1.9 power law as intrinsic spectrum and estimated NH > 4.0 × 1023 cm−2 to reproduce the observed value of hardness ratio, accounting for the proper instrumental response and PSF correction by using the ancillary and response file extracted at the position of C6 (see Sect. 2.1). We used this model to estimate the observed flux and the intrinsic luminosity of C6 (Table 2). Based on these loose constraints, we conclude that C6 confidently is a heavily obscured AGN, although possibly not as extreme as C1.
The X-ray detection of C6 strongly supports that this galaxy is the host of the radio AGN discovered by Chapman et al. (2024) with. The ATCA 2.2 GHz contours presented by Chapman et al. (2024) are reported in Fig. 2 in cyan. The limit on the X-ray luminosity of C6 is consistent with the relation between radio and X-ray emission from radio-loud AGNs (e.g. Fan & Bai 2016; D’Amato et al. 2020; Mazzolari et al. 2024).
3.4. SED fitting
We used CIGALE v2022.1 (e.g. Boquien et al. 2019; Yang et al. 2022) to fit the SEDs of the two X-ray selected AGNs in SPT2349–56. Figure 5 presents the best-fitting SED models and the resulting physical parameters are reported in Table 3. CIGALE produces a SED model for every combination of the input parameters, convolves it with the filters corresponding to the utilised photometric points, and computes the likelihood exp( − χ2/2) of every model in a Bayesian framework. Then, it computes the marginalised probability distribution function of each physical parameter based on the likelihood of all models and returns the mean and the standard deviation, which can be considered as the estimated value and associated uncertainty.
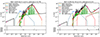 |
Fig. 5. Best-fitting models for C1 and C6 returned by the CIGALE fitting code. The optical-to-mm photometric points were collected from Hill et al. (2020, 2022), while for C6, we added the radio measurements of Chapman et al. (2024). The absorption-corrected X-ray fluxes correspond to the X-ray models discussed in Sects. 3.1 and 3.3. The sub-mm/mm photometry of C1 is dominated by the AGN-reprocessed emission. The AGN in C6 contributes more modestly at such wavelengths, but dominates the radio emission. |
Best-fitting physical parameters of C1 and C6 obtained via SED fitting.
We used the optical-to-mm photometric points from Gemini-GMOS, FLAMINGOS-2, HST-WFC3, Spitzer-IRAC, and ALMA presented by Hill et al. (2020, 2022), Chapman et al. (2024). Upper limits at 3σ were adopted here for filters in which the sources were not detected. We fit the SEDs using simple stellar populations from Bruzual & Charlot (2003) and a delayed star-formation history with optional late burst and a Chabrier (2003) initial mass function (IMF). We also accounted for nebular emission, dust attenuation with a modified Calzetti et al. (2000) law, and dust thermal emission using the Draine et al. (2014) templates. In particular, CIGALE consistently treats the dust attenuation and re-emission, thus conserving the total energy. A summary of the grid values used for SED fitting is reported in Appendix A.
Since we are fitting X-ray selected AGN SEDs, we also included the CIGALE AGN module based on Stalevski et al. (2016) and the X-ray module of Yang et al. (2020, 2022). The X-ray module is especially useful to constrain the AGN component in the SEDs. In fact, bright X-ray emission is largely dominated by the AGN flux and CIGALE uses the well-known correlation between the AGN intrinsic luminosities at rest-frame UV and X-ray wavelengths (e.g. Just et al. 2007) as a prior to constrain the AGN intrinsic optical/UV luminosity. This procedure is particularly valuable in the presence of obscuration, as in this case the AGN optical/UV emission is strongly suppressed. The X-ray module includes the X-ray emission from binaries and hot gas that depends on the SFR and stellar mass, although it does not include shocks that a starburst can have. These contributions are expected to be negligible at the observed X-ray luminosities (e.g. Lehmer et al. 2016, 2019). The fitted X-ray fluxes used in the fitting procedure correspond to the X-ray models discussed in Sects. 3.1 and 3.3 and have been corrected for absorption, as required by CIGALE.
The optical photometry of C1 is contaminated by a spectroscopically identified foreground galaxy at z = 2.54 (Rotermund et al. 2021). Following Hill et al. (2022), we thus consider the optical fluxes as upper limits for source C1. The SED-fitting procedure for this object returns an AGN bolometric luminosity of Lbol = (1.9 ± 0.7)×1047 erg s−1, which is slightly higher than the value estimated in Sect. 3.1. The large uncertainties are probably due the fact that only the X-ray point provides an anchor for the AGN component, as only upper limits are used for the optical photometry and the rest-frame mid-IR emission is not sampled by the available datasets. CIGALE returns a star-formation rate averaged over the last 100 Myr of SFR100 Myr = 228 ± 140 M⊙ yr−1. This value is significantly lower than the SFR reported by Hill et al. (2020), who estimated it from the FIR luminosity and on similar timescales, but that study did not account for the AGN component, which can contribute significantly to the total IR luminosity (e.g. Di Mascia et al. 2021; McKinney et al. 2021). The stellar mass of M* = (3.5 ± 2.8)×1010 M⊙ yr−1 is nominally lower than the estimate of Hill et al. (2022), but consistent within the large uncertainties.
Considering C6, we corrected the observed X-ray flux assuming the lower limit we could place on NH in Sect. 3.3. Thus, the contribution of the AGN component to the best-fitting model for this source might have been underestimated, as higher intrinsic X-ray fluxes would correspond to the observed ones for higher values of NH. We further assumed that the radio emission detected by Chapman et al. (2024) in the core region of SPT2349–56 is entirely associated with the X-ray AGN hosted in C6; thus, when fitting this source, we considered also the radio fluxes and upper limits from ASKAP, MeerKAT, and ATCA observations presented in that work. This addition required us to employ the CIGALE radio module, which models non-thermal radio emission from star formation and AGNs. The CIGALE fit requires a moderately luminous AGN (Lbol = (3.3 ± 0.2)×1045 erg s−1) that is sub-dominant at all frequencies, except for the X-ray and radio bands. In particular, C6 is a radio-loud7 AGN, as also discussed by Chapman et al. (2024), with R = 98 ± 9. We obtained SFR100 Myr = 263 ± 77 M⊙ yr−1 and M* = (3.6 ± 1.3)×1010 M⊙ yr−1. Both of these values are significantly lower than those reported by Hill et al. (2020, 2022). In particular, we note that the stellar-mass value that we find is more consistent with the dynamical mass of ≈(2 − 5)×1010 M⊙ estimated by Chapman et al. (2024).
The stellar masses of these two galaxies correspond roughly to the break mass of the galaxy stellar mass function at z ≈ 4 (e.g. Song et al. 2016; Weaver et al. 2023). In comparing this to the SED fitting results of Monson et al. (2023) on X-ray selected AGNs in the SSA22 protocluster at z = 3.09, the AGN in SPT2349–56 are (on average) hosted in slightly less massive, but significantly more star-forming galaxies. In fact, Monson et al. (2023) found that most of the AGNs in SSA22 are located below the main sequence (MS), while few of them are consistent with it within the uncertainties on mass and SFR. Instead, according to our findings, both C1 and C6 are consistent with being MS or even starbursting galaxies (e.g. Khusanova et al. 2021; Popesso et al. 2023). The AGN in SPT2349–56 might be in an earlier stage of galaxy evolution than those in SSA22 and they are probably still in the peak phase of stellar and BH mass assembly. We also note that the SFRs of C1 and C6 averaged on a shorter timescale, namely, 10 Myr, while the instantaneous SFRs returned by CIGALE are even higher than the values reported above (see Table 3). This is due to the SFHs of these galaxies favoring a recent and short burst of star formation.
3.5. X-ray stacking analysis
We performed an X-ray stacking analysis on the protocluster members to check for sub-threshold X-ray emission and constrain the average X-ray luminosity. We used the CIAO wavdetect and dmfilth tools to identify detected X-ray sources and replace them with Poisson noise sampled from nearby regions. We then used the dmcopy tool to cut thumbnails of the X-ray images and exposure maps centred at the positions of the protocluster galaxies, excluding C1 and C6 that are detected individually. We summed them separately in the soft, hard, and full bands. We note that all of the protocluster members are within ≈3 arcmin from the average aim point of the observations, such that we do not expect a strong variation of the PSF at their positions. The sum of the counts in a R = 2 pixel (i.e. ≈1 arcsec) region around the centres of the stacked images divided by the average values of the stacked exposure maps in the same regions returns the stacked count rates in the three bands. We estimated the background level from nearby regions in the stacked images. We assessed detection significance and net-count numbers following the procedure in Sect. 2.2.
We did not detect any significant stacked X-ray emission from the protocluster members in any energy band. We repeated the procedure considering first all of the possible members (i.e. 97 objects), then only those identified spectroscopically (i.e. 36 objects), and, finally, only the DSFGs (i.e. 20 objects). Assuming obscured power-law emission, with Γ = 1.9 and NH = 1024 cm−2, the lack of significant stacked signal for the sample of DSFGs corresponds to an average intrinsic X-ray luminosity of < 2 × 1043 erg s−1. We estimated similar values for the other samples of stacked galaxies. We stress that the stacked exposure times are in the range 5 × 10⁶ s to 1.9 × 10⁷ s, depending on the stacked sample. Based on these results, we did not find evidence for widespread low-rate SMBH accretion in the structure, although we cannot exclude the possibility that some of the protocluster members host a faint AGN.
4. Discussion
In this section, we discuss some implications of the results presented in Sect. 3. In particular, in Sect. 4.1, we estimate the contribution of the diffuse gas in the AGN host galaxies, namely, the interstellar medium (ISM), to the nuclear obscuration. In Sect. 4.2, we estimate the incidence of AGNs among the protocluster member galaxies and we compare it with other protoclusters and expectations in the field environment. In Sect. 4.3, we quantify the enhancement of luminous AGNs discovered in z ≈ 4 gas-rich protocluster cores.
4.1. ISM obscuration
In recent decades, several works based on X-ray surveys established observationally that the fraction of obscured AGNs increases significantly from the local universe up to at least z ≈ 4 − 5 (e.g. La Franca et al. 2005; Treister & Urry 2006; Buchner et al. 2015; Lanzuisi et al. 2018; Vito et al. 2018b; Iwasawa et al. 2020; Peca et al. 2023). A possible explanation for that behaviour is that the contribution of the diffuse gas in the host galaxies (i.e. the ISM) to the nuclear obscuration of AGNs increases strongly from the local to the high-redshift universe, due to the higher gas content and smaller sizes characterising galaxies at early cosmic epochs, which almost automatically produce higher gas column densities. This scenario has been tested both observationally and via numerical simulations (e.g. Gilli et al. 2014; Circosta et al. 2019; Trebitsch et al. 2019; D’Amato et al. 2020; Ni et al. 2020; Lupi et al. 2022; Vito et al. 2022). In particular, Gilli et al. (2022) developed an analytical model for the ISM obscuration that accounts for the ISM clumpiness with a distribution of cloud sizes, masses, and densities, and showed that it predicts well the measured evolution of the obscured AGN fraction up to z ≈ 4.
We tested whether the ISM in the two AGNs discovered in SPT2349–56 can contribute significantly to their heavy nuclear obscuration, under simple geometrical assumptions. Following Sect. 4.1 of Gilli et al. (2022), we assumed a smooth distribution of the ISM and that the [C II] surface brightness traces the ISM density, which is distributed in a disk with an exponential profile. This is consistent with the ALMA high-resolution imaging of C1 presented by Hill et al. (2022), in which the galaxy appears as a nearly edge-on disk. The [C II] light profile is best fitted with a Sersic model with index n = 1.07 ± 0.02, that is, close to an exponential profile. Gilli et al. (2022) showed that, in that case, the gas column density for a line of sight inclined by an angle θ is
 (2)
(2)
where r0 is the scale radius; for a pure exponential disk, this can be expressed in terms of the half-light radius, rhl = 1.678 r0 and  is the central gas density, while 2h is the disk thickness. A typical thickness of h = 0.15 rhl (Gilli et al. 2022, and references therein) is assumed, with no vertical gradient for the gas density.
For C1, Hill et al. (2020) estimated a molecular gas mass of MH2 = 7.5 × 10¹⁰ M⊙ from the CO(4–3) emission line and Hill et al. (2022) measured a [C II] half-light radius8 of rhl = 2.91 kpc. Following D’Amato et al. (2020), we consider  to account for the mass of atomic gas in the galaxy. Therefore, assuming an edge-on configuration for C1, we obtain
  , while assuming the average viewing angle for random inclinations, we get
  . Smaller inclinations would not be consistent with the nearly edge-on [C II] image of this galaxy, under the assumption of a disk geometry, which is consistent with recent ALMA observations of 4 < z < 5 DSFGs (e.g. Rizzo et al. 2021). These order-of-magnitude values are close to the column density measured for C1 from our X-ray spectral analysis (Table 2), confirming that the gas distributed in the host galaxy can contribute significantly to the nuclear obscuration. We note that the use of the [C II] profile as a proxy of the molecular gas extension is conservative, as that transition traces also atomic gas, which is typically more extended than the dense molecular phase.
The molecular gas mass and [C II] half-light radius of C6 are MH2 = 3.7 × 10¹⁰ M⊙ and rhl = 1.30 kpc (Hill et al. 2020, 2022). Although the [C II] morphology is best fitted with a Sèrsic profile n = 0.78 (Hill et al. 2022), we considered an exponential profile for simplicity. C6 appears close to face-on in the [C II] imaging (Hill et al. 2022); thus, we used θ = 57.3 and θ = 0 as the boundary values of its inclination, finding  and
and  . Therefore, for C6, the nuclear obscuration observed in the X-ray band may also be due partly (or entirely) to the gas in the host galaxy. In particular, we note that the ISM in C6 can reach higher column densities than C1 at a given inclination angle because of its compactness, which only high-resolution ALMA imaging could probe.
We stress that here we do not aim to measure the ISM contribution to the nuclear obscuration estimated via the X-ray observations, but rather to check whether such a contribution can in principle be significant. One key assumption of the computations above is that the ISM is distributed smoothly in the galaxies, while it is known to be clumpy. Thus, depending on the geometry and physical properties (e.g. size and mass distribution) of the individual clouds, the ISM column density can be significantly different from (and possibly much lower than) the values estimated in this section. However, due to the high total gas masses estimated for C1 and C6 and depending on the assumed sizes and masses of molecular gas clouds (e.g. Miville-Deschênes et al. 2017; Dessauges-Zavadsky et al. 2019), the cloud filling factors in these galaxies can be as great as 100%. Therefore, the assumption of a smooth ISM is reasonable for the order-of-magnitude computations of this section.
4.2. Incidence of AGN activity in SPT2349–56
We detected two X-ray AGNs out of 38 known members, implying an overall AGN fraction of  , where the uncertainties are based on the Jeffrey Bayesian credible interval for binomial proportions (e.g. Brown et al. 2001). However, different populations of galaxies are intrinsically characterised by different AGN incidences, such that any comparison with other protoclusters or blank fields should take the specific galaxy selection into account (e.g. Vito et al. 2023). Therefore, in the following, we consider separately galaxies selected as DSFGs, LAEs, and LBGs.
Two out of the 22 galaxies selected as DSFGs in SPT2349–56 are X-ray selected AGNs, corresponding to an X-ray AGN fraction in such a galaxy population of  . This value is remarkably close to the AGN fraction in DRC (Vito et al. 2020) down to similar FIR luminosity limits, adding the AGN content to other physical properties in common between the two protoclusters, thus suggesting that they have been caught during a similar phase of their galaxy and SMBH evolution. Since SPT2349–56 and DRC share a similar selection and are located at similar redshifts, we use both of them jointly to improve the number statistics and estimate the fraction of AGNs among DSFGs in z ≈ 4 gas-rich protoclusters by considering all of their DSFG members together (35, of which 4 are X-ray AGNs), finding an X-ray AGN fraction of
  .
.
These results are consistent with the typical ranges found for DSFGs (e.g. Alexander et al. 2005; Georgantopoulos et al. 2011; Wang et al. 2013; Shanks et al. 2021). However, such samples typically cover lower redshifts (i.e. z = 2 − 3, where the cosmic AGN activity peaks; e.g. Aird et al. 2015) than SPT2349–56, such that a direct comparison may be misleading. This is due to the quite strong evolution of the cosmic AGN and DSFG populations, which is also dependent on the considered luminosity regimes (e.g. Ueda et al. 2014; Aird et al. 2015; Traina et al. 2024). For example, if the space density of the X-ray selected AGN decreases from z = 2 to z = 4 at a higher rate than the density of DSFGs (as it appears based on observational works), it will generally cause a decrease in the AGN fraction at increasing redshift. In this case, observing similar AGN fractions at z = 4 as at z = 2 would suggest stronger positive environmental effects at high redshift, but this is currently still quite a speculative area.
To factor out the cosmic evolution of the AGN population, the comparison should be made with a sample of DSFGs at similar redshift as SPT2349–56. We collected a total of 54 sub-mm-selected galaxies in the E-CDFS, COSMOS, and UDS fields from da Cunha et al. (2015), Scoville et al. (2016), and Dudzevičiūtė et al. (2020), respectively, with photometric redshifts of 3.5 < z < 4.5 and overlapping with the available X-ray coverage in those fields (Civano et al. 2016; Xue et al. 2016; Kocevski et al. 2018), with sensitivities similar to (or deeper than) the Chandra observations covering SPT2349–56 and DRC. We found no match with the X-ray catalogs, corresponding to an observed AGN fraction among field DSFGs < 0.04. To quantitatively test if the AGN fraction in z ≈ 4 gas-rich protoclusters is consistent with the field value, we ran the Boschloo’s exact test for a 2 × 2 contingency table. The null hypothesis is that the intrinsic AGN fractions in protoclusters and in the field are equal, with the observed difference due only to statistical fluctuations. Considering SPT2349–56 only, the test returns a probability of ≈5% to obtain only by chance a case at least as extreme as the observed ones (i.e. no AGNs out 54 DSFGs in the field, and ≥2 AGNs out of 22 DSFGs in SPT2349–56). Considering SPT2349–56 and DRC together (i.e. ≥4 AGNs out of a total of 35 DSFGs), such probability decreases to ≈1%. This comparison points toward a higher AGN incidence among DSFGs in z ≈ 4 protoclusters than in the field at similar redshift, although the AGN content of additional and similar structures should be investigated to obtain a definitive proof. Moreover, we caution that the reference samples have been selected in a different way from how the observations performed at different sub-mm/mm frequencies and with different depths; thus, they might have different flux, luminosity, and mass distributions from the DSFGs population in protoclusters.
Considering the entire sample of 30 protocluster members spectroscopically identified with ALMA via detection of the [C II] and CO(4–3) emission lines, thus including both DSFGs and sources undetected in sub-mm/mm continuum, the AGN fraction decreases slightly to  . None of the eight spectroscopically confirmed Lyα emitter galaxies (LAEs) discovered by Apostolovski et al. (2024) in the SPT2349–56 structure is significantly detected in the X-rays, resulting in an upper limit on AGN fraction among that galaxy population of < 0.21, consistent with results from blank fields (e.g. Lehmer et al. 2009a; Digby-North et al. 2010; Zheng et al. 2010). We obtained no X-ray detection also of the 4 LBGs in the SPT2349–56 core (Rotermund et al. 2021), implying an AGN fraction of < 0.36.
In Fig. 6, we compare the X-ray AGN fractions of SPT2349–56 with those of a collection of other protoclusters covered with sensitive X-ray observations, as computed in Appendix B and reported in Table 4. The AGN incidence among DSFGs in SPT2349–56 is consistent with the results for other z > 2 protoclusters, although a couple of structures have significantly higher AGN fractions. Instead, the AGN fraction drops dramatically in virialised clusters at lower redshift. This behavior might be connected to the virialisation of the structures or strong AGN feedback hindering the infall of large amounts of cold gas into galaxies and, thus, the triggering of luminous nuclear activity. We note that the points in Fig. 6 are observed fractions and we refer to Appendix B for a discussion of the caveats. A more in-depth investigation of the possible cosmic evolution of the AGN incidence in protoclusters would require taking several effects into account, including: the various sensitivities of the multi-wavelength observations, dependence of SMBH accretion on the host-galaxy stellar mass, and the intrinsic cosmic evolution of the AGN population (e.g. Aird et al. 2015, 2018; Yang et al. 2017, 2018b; Zou et al. 2024). These can be controlled for by comparing with the field AGN incidence. Such analyses require, among other things, a proper assessment of the multi-band observation sensitivities across multiple extragalactic fields and of the different specific selections applied on such fields, as well as a consistent SED fitting analysis of the resulting large samples of SMGs. However, these tasks are beyond the scope of this paper and we reserve it for a dedicated future work.
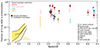 |
Fig. 6. Fraction of X-ray selected AGNs in a sample of protoclusters as a function of redshift. The different symbol shapes and colors correspond to different structures and selection methods of the parent galaxy population, as marked in the figure. Different symbols for the same structure are slightly shifted in redshift for clarity. We consider the parent samples of spectroscopically confirmed protocluster members, when available (filled symbols); otherwise we consider all the member candidates (empty symbols). We refer to Sect. 4.2 and Appendix B for the computation of these values and the relevant citations. For comparison with low-redshift, virialised systems, the filled and hashed yellow stripes represent the X-ray AGN fractions in galaxy clusters presented by Martini et al. (2009) and Bufanda et al. (2017), respectively. |
4.3. Enhancement of fast SMBH growth in z ≈ 4 overdensities of DSFGs
The obscuration level and luminosity of C1 are remarkably similar to those of DRC-2 (Fig. 4). To our knowledge, AGNs with similar X-ray luminosities in protocluster environments have been detected only in two structures at z = 2.16 − 2.41 by (see Fig. 4 Ivison et al. 2019; Tozzi et al. 2022b). These AGNs are known to be unobscured or at most mildly obscured objects. The detection of a luminous, Compton-thick AGNs in the core regions of the only two z ≈ 4 protoclusters selected as overdensities of dusty star-forming galaxies and covered by sensitive X-ray observations suggests that gas-rich and dense regions of the Universe at those epochs may promote the triggering of extremely fast SMBH growth in heavily obscured conditions (see also Rennehan 2024).
To estimate the level of enhancement of luminous AGNs in SPT2349–56 and DRC, we compared their space density with that of AGNs in the field environment with a similar luminosity and redshift. We assume that the two protoclusters are enclosed in spherical volumes with radii equal to the projected distances between the observed centres of the structures and the farthest spectroscopically confirmed members, which are ≈8.8 comoving Mpc (cMpc) and ≈3.8 cMpc, respectively (Ivison et al. 2020; Hill et al. 2022). Accounting for the uncertainties on their estimated luminosities, we consider the two luminous AGNs in SPT2349–56 and DRC as representative of the AGN population in the range log in z ≈ 4 gas-rich protoclusters. The space density of such a population is then two divided by the sum of the volumes computed above; namely,
  , where the uncertainties account for the statistical errors on the number of objects (Gehrels 1986). The space density of log
 at z = 4.15 in the field environment is
  (Fig. 7; e.g. Gilli et al. 2007; Ueda et al. 2014; Aird et al. 2015; Vito et al. 2018b), corresponding to an expected number of 1.5 × 10⁻⁴ luminous AGNs in the considered volume. The Poisson probability of instead finding two AGNs with such luminosity by chance only is negligible. This simple computation suggests that the triggering of luminous AGNs in gas-rich protocluster environments at z ≈ 4 is enhanced by about four orders of magnitude with respect to the field environment at similar redshift with high significance.
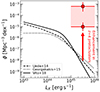 |
Fig. 7. Space density of luminous (log |
The most uncertain quantities that enter in the estimate are the volumes of the two protoclusters. As a second and more conservative estimate, we assumed that these structures extend up to R = 28 cMpc. According to Muldrew et al. (2015), this is the average radius that encloses 90% of the stellar mass of protoclusters at z = 4 that form massive galaxy clusters at z = 0. In this case, we estimate  , which is still > 2 dex higher than the field value. The Poisson probability of finding two luminous AGNs while expecting the number predicted by the field environment is negligible also in this case.
As a comparison, Tozzi et al. (2022a) found for the Spiderweb protocluster at z ≈ 2 an AGN enhancement by a factor of tens, depending on the AGN luminosity. This lower value might be due to the fact that z ≈ 2 protoclusters have often already consumed most of their gas, as suggested by the large fraction of passively evolving galaxies in the Spiderweb structure (Shimakawa et al. 2024). It may also be attribued to the overall cosmic evolution of the AGN space density, which peaks close to that epoch.
The much higher space density of luminous AGNs in SPT2349–56 and DRC than in the field at similar redshift can in principle be driven by the space density of the underlying galaxy population, which in protoclusters is enhanced with respect to the field by definition. For instance, Miller et al. (2018) estimated a SMG overdensity in SPT2349–56 of a factor > 1000. However, they considered only the central R = 130 kpc region, where their selection is complete at S1.1 mm > 0.5 μJy. In that same region, we detected C1, namely,  X-ray luminous AGNs, which is at least several million times greater than the expected number of 4 × 10⁻⁸ similar objects in the field, assuming a spherical volume with that radius. This enhancement largely exceeds and thus is hardly driven by the overdensity level of the underlying galaxy population in the considered protoclusters. We stress that C1 is not an extreme galaxy in terms of stellar mass (see Sect. 3.4); thus, the comparison with the overdensity estimated by Miller et al. (2018) for the entire population of DSFGs in the structure is fair. This result is only in apparent contrast with the lower significance found for the enhanced AGN fraction in protoclusters with respect to the field environment discussed in Sect. 4.2. In that section, we focussed on the high-luminosity regime only, and compared space densities rather than AGN fractions. Given the shape of the X-ray luminosity function (Fig. 7), such luminous AGNs are extremely rare in the field and finding two of them in small volumes corresponds to a high enhancement factor. In fact, the small enhancement of the overall AGN fraction coupled with the broad enhancement of the space density of high-luminosity AGN suggests that the AGN X-ray luminosity function in these protoclusters is flatter than in the field, as was also found by Tozzi et al. (2022a) for the Spiderweb protocluster. These computations suggest that gas-rich overdensities of DSFGs at z ≈ 4 promote extremely luminous and obscured AGN activity. A larger sample of similar protoclusters is needed to confirm this finding with better statistics.
We note that Yang et al. (2018a) investigated the possible dependence of the average SMBH accretion rate density in samples of galaxies in the COSMOS field as a function of their environments up to 10 Mpc, finding no significant difference in the SMBH accretion power between overdense and field regions at a fixed stellar mass. However, they analysis is limited to z < 3 and the environments that they probed are not as dense as SPT2349–56.
The luminous AGNs in the z ≈ 4 protocluster cores represent the phase of fast SMBH growth required to explain the masses of SMBHs in the centres of low-redshift galaxy clusters. Such AGNs are likely caught just before the ‘blow-out’ phase, when AGN feedback clears the line of sight of most of the obscuring material (e.g. Ivison et al. 2019), eventually hindering star formation and further SMBH growth. X-ray observations of a larger sample of similar environments are required to investigate the AGN population in such structures and prove this scenario securely. The specific selection that led to the identification of SPT2349–56 and DRC appears to be key to identifying high-redshift structures hosting such luminous AGNs. In fact, other protoclusters selected as overdensities of Lyman-break galaxies via optical observations do not present strong evidence for the presence of such an AGN population, although they host an unusual large number of rest-frame UV bright galaxies (Toshikawa et al. 2024).
5. Summary and conclusions
We presented new Chandra observations of the z = 4.3 SPT2349–56 protocluster, which was identified as an extreme overdensity of DSFGs (Miller et al. 2018; Hill et al. 2020, 2022; Rotermund et al. 2021; Chapman et al. 2024). We summarise our main results below.
-
We identified two X-ray detected AGNs among the SPT2349–56 member galaxies, namely C1 and C6, which are among the most gas-rich galaxies in the system (Hill et al. 2020). We did not detect significant emission by stacking the X-ray data of the individually undetected galaxies, implying an average X-ray luminosity < 2 × 1043 erg s−1. More details are given in Sects. 2 and 3.5.
-
C1 is an extremely luminous (L2 − 10 keV = 2 × 1045 erg s−1), Compton-thick (NH = 2 × 1024 cm−2) AGN. The X-ray luminosity translates into a bolometric power ≈1047 erg s−1, which has also been confirmed via SED fitting. Assuming that the SMBH accretion is capped at the Eddington limit, we placeed a lower limit on its mass of ≈7 × 10⁸ M⊙. Both its luminosity and obscuration levels are similar to those of another AGN previously detected in the central region of DRC, a similar protocluster at z = 4 (Vito et al. 2020). Both of these AGNs might have already accreted a significant fraction of the typical mass of SMBHs in the centres of local clusters at much later (> 10 Gyr) cosmic times. More details are given in Sect. 3.1.
-
Due to the low number of detected X-ray photons, we can only place lower limits on the luminosity (L2 − 10 keV > 2 × 1043 erg s−1) and column density (NH = 4 × 1023 cm−2) of C6, which is also a radio-loud AGN. We present more details in Sect. 3.3.
-
Both C1 and C6 are hosted in galaxies with stellar masses ≈3 × 10¹⁰ M⊙, which is close the break value of the galaxy stellar mass function at z = 4.3. They have star formation rates that are consistent with (or in excess of) the expectation of the MS of star-forming galaxies at that redshift. More details are given in Sect. 3.4.
-
Under simple, but reasonable, assumptions on the geometries of the host galaxies, we conclude that the ISM can, in principle, contribute significantly to the observed nuclear obscuration of both AGNs. This is in agreement with previous works on high-redshift AGNs, although that contribution can be lower in the case of highly clumpy medium. More details are given in Sect. 4.1.
-
The X-ray AGN fraction among DSFGs in SPT2349–56 is about 10%, consistent with other z > 2 protoclusters and, in particular, with DRC. The fraction is higher than the X-ray AGN incidence in DSFGs in the field environment at z ≈ 4. We were only able to place loose upper limits on the AGN incidence in LBGs and LAEs in SPT2349–56, due to their small number. More details are given in Sect. 4.2.
-
Both SPT2349–56 and DRC, which share similar selection and physical properties, host highly luminous, Compton-thick AGNs, indicating the existence of a tight link between vigorous phases of star formation, fed by the availability of huge gas reservoirs, along with high SMBH accretion rates in the densest environments at high redshift. Such luminous AGNs probably represent the period of fast SMBH growth required to explain the presence of 109 − 1010 M⊙ SMBHs in the central galaxies of local clusters. Under different assumptions about the volumes of these structures and comparing with the predictions of the X-ray luminosity function z = 4, we suggest that gas-rich and dense protoclusters at z ≈ 4 enhance the triggering of extremely fast SMBH accretion by a factor of 3−5 dex with respect to the field environment. This factor exceeds the galaxy overdensity level of the protoclusters, thus, this is not likely to be merely driven by the large number of galaxies in the structures. Further X-ray observations of similar structures are needed to confirm this result. More details are given in Sect. 4.3.
Our results demonstrate that sensitive X-ray observations with high angular resolution are crucial to identify AGNs in high-redshift protoclusters, which are characterised by large amounts of dust and gas, and, thus, heavy nuclear obscuration. Over the next few years, Chandra will play a leading role in this respect, by increasing the samples of high-redshift gas-rich protoclusters with the deep X-ray coverage required to investigate their AGN content. Future X-ray missions will then be crucial to obtain a complete view of the relation between overdense environments and SMBH growth at high redshift (e.g. Vito et al. 2023).
We note that Rotermund et al. (2021) selected dozens of LBG candidates over a large area (i.e. up to a radius of ≈2 arcmin) centred on SPT2349–56. Following Rotermund et al. (2021), we considered only the four galaxies found in the core region as potential members of the protocluster.
We used the W-statistic, which is suitable in case of background-subtracted spectra with low number of counts. See https://heasarc.gsfc.nasa.gov/xanadu/xspec/manual/XSappendixStatistics.html and Cash (1979).
The radio-loudness parameter is defined in CIGALE as R = fν,5GHz/fν,2500 Å, i.e. the ratio of the flux densities at rest-frame 5 GHz and 2500 Å (Kellermann et al. 1989; Yang et al. 2022).
Since the [C II] emission traces the total gas, including the diffuse component, and is thus an upper limit on the extension of the molecular gas. In this sense, our estimate of NH is conservative.
Acknowledgments
We thank the anonymous referee for their useful comments and suggestions. FV thanks R. Hill and S. Chapman for kindly providing the ALMA and ATCA data and for useful discussion. FV acknowledges support from the “INAF Ricerca Fondamentale 2023 – Large GO” grant. WNB acknowledges support from CXC grant GO2–23074X. This research has made use of data obtained from the Chandra Data Archive (Proposal ID 23700087), and software provided by the Chandra X-ray Center (CXC) in the application packages CIAO. This research made use of Astropy, a community-developed core Python package for Astronomy (Astropy Collaboration 2013, 2018), and the Statsmodels package (Seabold & Perktold 2010).
References
- Aird, J., Coil, A. L., Georgakakis, A., et al. 2015, MNRAS, 451, 1892 [Google Scholar]
- Aird, J., Coil, A. L., & Georgakakis, A. 2018, MNRAS, 474, 1225 [NASA ADS] [CrossRef] [Google Scholar]
- Alberts, S., Pope, A., Brodwin, M., et al. 2014, MNRAS, 437, 437 [NASA ADS] [CrossRef] [Google Scholar]
- Alexander, D. M., Bauer, F. E., Chapman, S. C., et al. 2005, ApJ, 632, 736 [NASA ADS] [CrossRef] [Google Scholar]
- Anders, E., & Grevesse, N. 1989, Geochim. Cosmochim. Acta, 53, 197 [Google Scholar]
- Aoyama, K., Kodama, T., Suzuki, T. L., et al. 2022, ApJ, 924, 74 [NASA ADS] [CrossRef] [Google Scholar]
- Apostolovski, Y., Aravena, M., Anguita, T., et al. 2024, A&A, 683, A64 [NASA ADS] [CrossRef] [EDP Sciences] [Google Scholar]
- Arnaud, K. A. 1996, ASP Conf. Ser., 101, 17 [Google Scholar]
- Assef, R. J., Walton, D. J., Brightman, M., et al. 2016, ApJ, 819, 111 [Google Scholar]
- Astropy Collaboration (Robitaille, T. P., et al.) 2013, A&A, 558, A33 [NASA ADS] [CrossRef] [EDP Sciences] [Google Scholar]
- Astropy Collaboration (Price-Whelan, A. M., et al.) 2018, AJ, 156, 123 [Google Scholar]
- Banerji, M., Fabian, A. C., & McMahon, R. G. 2014, MNRAS, 439, L51 [CrossRef] [Google Scholar]
- Boquien, M., Burgarella, D., Roehlly, Y., et al. 2019, A&A, 622, A103 [NASA ADS] [CrossRef] [EDP Sciences] [Google Scholar]
- Brandt, W. N., & Alexander, D. M. 2015, A&ARv, 23, 1 [Google Scholar]
- Broos, P. S., Feigelson, E. D., Townsley, L. K., et al. 2007, ApJS, 169, 353 [Google Scholar]
- Brown, L. D., Cai, T. T., & DasGupta, A. 2001, Stat. Sci., 16, 101 [Google Scholar]
- Bruzual, G., & Charlot, S. 2003, MNRAS, 344, 1000 [NASA ADS] [CrossRef] [Google Scholar]
- Buchner, J., Georgakakis, A., Nandra, K., et al. 2015, ApJ, 802, 89 [Google Scholar]
- Bufanda, E., Hollowood, D., Jeltema, T. E., et al. 2017, MNRAS, 465, 2531 [NASA ADS] [CrossRef] [Google Scholar]
- Calzetti, D., Armus, L., Bohlin, R. C., et al. 2000, ApJ, 533, 682 [NASA ADS] [CrossRef] [Google Scholar]
- Cash, W. 1979, ApJ, 228, 939 [Google Scholar]
- Chabrier, G. 2003, PASP, 115, 763 [Google Scholar]
- Chapman, S. C., Hill, R., Aravena, M., et al. 2024, ApJ, 961, 120 [NASA ADS] [CrossRef] [Google Scholar]
- Chen, C.-C., Smail, I., Ivison, R. J., et al. 2016, ApJ, 820, 82 [NASA ADS] [CrossRef] [Google Scholar]
- Chiang, Y.-K., Overzier, R. A., Gebhardt, K., & Henriques, B. 2017, ApJ, 844, L23 [Google Scholar]
- Circosta, C., Vignali, C., Gilli, R., et al. 2019, A&A, 623, A172 [NASA ADS] [CrossRef] [EDP Sciences] [Google Scholar]
- Civano, F., Marchesi, S., Comastri, A., et al. 2016, ApJ, 819, 62 [Google Scholar]
- Corral, A., Georgantopoulos, I., Comastri, A., et al. 2016, A&A, 592, A109 [NASA ADS] [CrossRef] [EDP Sciences] [Google Scholar]
- da Cunha, E., Walter, F., Smail, I. R., et al. 2015, ApJ, 806, 110 [Google Scholar]
- D’Amato, Q., Gilli, R., Vignali, C., et al. 2020, A&A, 636, A37 [NASA ADS] [CrossRef] [EDP Sciences] [Google Scholar]
- Dessauges-Zavadsky, M., Richard, J., Combes, F., et al. 2019, Nat. Astron., 3, 1115 [NASA ADS] [CrossRef] [Google Scholar]
- Di Mascia, F., Gallerani, S., Behrens, C., et al. 2021, MNRAS, 503, 2349 [NASA ADS] [CrossRef] [Google Scholar]
- Digby-North, J. A., Nandra, K., Laird, E. S., et al. 2010, MNRAS, 407, 846 [NASA ADS] [CrossRef] [Google Scholar]
- Draine, B. T., Aniano, G., Krause, O., et al. 2014, ApJ, 780, 172 [Google Scholar]
- Dudzevičiūtė, U., Smail, I., Swinbank, A. M., et al. 2020, MNRAS, 494, 3828 [Google Scholar]
- Duras, F., Bongiorno, A., Ricci, F., et al. 2020, A&A, 636, A73 [NASA ADS] [CrossRef] [EDP Sciences] [Google Scholar]
- Fabian, A. C. 2012, ARA&A, 50, 455 [Google Scholar]
- Fan, X.-L., & Bai, J.-M. 2016, ApJ, 818, 185 [NASA ADS] [CrossRef] [Google Scholar]
- Fruscione, A., McDowell, J. C., Allen, G. E., et al. 2006, SPIE Conf. Ser., 6270, 62701V [Google Scholar]
- Gaia Collaboration (Vallenari, A., et al.) 2023, A&A, 674, A1 [NASA ADS] [CrossRef] [EDP Sciences] [Google Scholar]
- Gaspari, M., Tombesi, F., & Cappi, M. 2020, Nat. Astron., 4, 10 [Google Scholar]
- Gehrels, N. 1986, ApJ, 303, 336 [Google Scholar]
- Georgakakis, A., Aird, J., Buchner, J., et al. 2015, MNRAS, 453, 1946 [Google Scholar]
- Georgantopoulos, I., Rovilos, E., & Comastri, A. 2011, A&A, 526, A46 [NASA ADS] [CrossRef] [EDP Sciences] [Google Scholar]
- Gilli, R., Comastri, A., & Hasinger, G. 2007, A&A, 463, 79 [NASA ADS] [CrossRef] [EDP Sciences] [Google Scholar]
- Gilli, R., Norman, C., Vignali, C., et al. 2014, A&A, 562, A67 [NASA ADS] [CrossRef] [EDP Sciences] [Google Scholar]
- Gilli, R., Mignoli, M., Peca, A., et al. 2019, A&A, 632, A26 [NASA ADS] [CrossRef] [EDP Sciences] [Google Scholar]
- Gilli, R., Norman, C., Calura, F., et al. 2022, A&A, 666, A17 [NASA ADS] [CrossRef] [EDP Sciences] [Google Scholar]
- Goulding, A. D., Zakamska, N. L., Alexandroff, R. M., et al. 2018, ApJ, 856, 4 [Google Scholar]
- Hatch, N. A., Muldrew, S. I., Cooke, E. A., et al. 2016, MNRAS, 459, 387 [NASA ADS] [CrossRef] [Google Scholar]
- Hill, R., Chapman, S., Scott, D., et al. 2020, MNRAS, 495, 3124 [NASA ADS] [CrossRef] [Google Scholar]
- Hill, R., Chapman, S., Phadke, K. A., et al. 2022, MNRAS, 512, 4352 [NASA ADS] [CrossRef] [Google Scholar]
- Hopkins, P. F., Hernquist, L., Cox, T. J., et al. 2006, ApJS, 163, 1 [Google Scholar]
- Ivison, R. J., Lewis, A. J. R., Weiss, A., et al. 2016, ApJ, 832, 78 [Google Scholar]
- Ivison, R. J., Page, M. J., Cirasuolo, M., et al. 2019, MNRAS, 489, 427 [NASA ADS] [CrossRef] [Google Scholar]
- Ivison, R. J., Biggs, A. D., Bremer, M., Arumugam, V., & Dunne, L. 2020, MNRAS, 496, 4358 [NASA ADS] [CrossRef] [Google Scholar]
- Iwasawa, K., Comastri, A., Vignali, C., et al. 2020, A&A, 639, A51 [NASA ADS] [CrossRef] [EDP Sciences] [Google Scholar]
- Just, D. W., Brandt, W. N., Shemmer, O., et al. 2007, ApJ, 665, 1004 [Google Scholar]
- Kalberla, P. M. W., Burton, W. B., Hartmann, D., et al. 2005, A&A, 440, 775 [NASA ADS] [CrossRef] [EDP Sciences] [Google Scholar]
- Kellermann, K. I., Sramek, R., Schmidt, M., Shaffer, D. B., & Green, R. 1989, AJ, 98, 1195 [Google Scholar]
- Khusanova, Y., Bethermin, M., Le Fèvre, O., et al. 2021, A&A, 649, A152 [NASA ADS] [CrossRef] [EDP Sciences] [Google Scholar]
- King, A. 2024, MNRAS, 531, 550 [NASA ADS] [CrossRef] [Google Scholar]
- Kocevski, D. D., Hasinger, G., Brightman, M., et al. 2018, ApJS, 236, 48 [CrossRef] [Google Scholar]
- Krishnan, C., Hatch, N. A., Almaini, O., et al. 2017, MNRAS, 470, 2170 [NASA ADS] [CrossRef] [Google Scholar]
- Kubo, M., Yamada, T., Ichikawa, T., et al. 2015, ApJ, 799, 38 [NASA ADS] [CrossRef] [Google Scholar]
- Kubo, M., Yamada, T., Ichikawa, T., et al. 2016, MNRAS, 455, 3333 [CrossRef] [Google Scholar]
- La Franca, F., Fiore, F., Comastri, A., et al. 2005, ApJ, 635, 864 [NASA ADS] [CrossRef] [Google Scholar]
- Lacaille, K. M., Chapman, S. C., Smail, I., et al. 2019, MNRAS, 488, 1790 [NASA ADS] [CrossRef] [Google Scholar]
- Lansbury, G. B., Banerji, M., Fabian, A. C., & Temple, M. J. 2020, MNRAS, 495, 2652 [Google Scholar]
- Lanzuisi, G., Civano, F., Marchesi, S., et al. 2018, MNRAS, 480, 2578 [Google Scholar]
- Laporte, N., Zitrin, A., Dole, H., et al. 2022, A&A, 667, L3 [NASA ADS] [CrossRef] [EDP Sciences] [Google Scholar]
- Lehmer, B. D., Alexander, D. M., Geach, J. E., et al. 2009a, ApJ, 691, 687 [Google Scholar]
- Lehmer, B. D., Alexander, D. M., Chapman, S. C., et al. 2009b, MNRAS, 400, 299 [Google Scholar]
- Lehmer, B. D., Lucy, A. B., Alexander, D. M., et al. 2013, ApJ, 765, 87 [NASA ADS] [CrossRef] [Google Scholar]
- Lehmer, B. D., Basu-Zych, A. R., Mineo, S., et al. 2016, ApJ, 825, 7 [Google Scholar]
- Lehmer, B. D., Eufrasio, R. T., Tzanavaris, P., et al. 2019, ApJS, 243, 3 [NASA ADS] [CrossRef] [Google Scholar]
- Li, J., Xue, Y., Sun, M., et al. 2019, ApJ, 877, 5 [NASA ADS] [CrossRef] [Google Scholar]
- Liu, S., Zheng, X. Z., Shi, D. D., et al. 2023, MNRAS, 523, 2422 [CrossRef] [Google Scholar]
- Lupi, A., Volonteri, M., Decarli, R., Bovino, S., & Silk, J. 2022, MNRAS, 510, 5760 [NASA ADS] [CrossRef] [Google Scholar]
- Lusso, E., Comastri, A., Vignali, C., et al. 2011, A&A, 534, A110 [NASA ADS] [CrossRef] [EDP Sciences] [Google Scholar]
- Macuga, M., Martini, P., Miller, E. D., et al. 2019, ApJ, 874, 54 [NASA ADS] [CrossRef] [Google Scholar]
- Martini, P., Sivakoff, G. R., & Mulchaey, J. S. 2009, ApJ, 701, 66 [Google Scholar]
- Martocchia, S., Piconcelli, E., Zappacosta, L., et al. 2017, A&A, 608, A51 [NASA ADS] [CrossRef] [EDP Sciences] [Google Scholar]
- Mazzolari, G., Gilli, R., Brusa, M., et al. 2024, A&A, 687, A120 [NASA ADS] [CrossRef] [EDP Sciences] [Google Scholar]
- McKinney, J., Hayward, C. C., Rosenthal, L. J., et al. 2021, ApJ, 921, 55 [CrossRef] [Google Scholar]
- Miller, T. B., Chapman, S. C., Aravena, M., et al. 2018, Nature, 556, 469 [CrossRef] [Google Scholar]
- Miville-Deschênes, M.-A., Murray, N., & Lee, E. J. 2017, ApJ, 834, 57 [Google Scholar]
- Monson, E. B., Lehmer, B. D., Doore, K., et al. 2021, ApJ, 919, 51 [NASA ADS] [CrossRef] [Google Scholar]
- Monson, E. B., Doore, K., Eufrasio, R. T., et al. 2023, ApJ, 951, 15 [NASA ADS] [CrossRef] [Google Scholar]
- Morishita, T., Roberts-Borsani, G., Treu, T., et al. 2023, ApJ, 947, L24 [NASA ADS] [CrossRef] [Google Scholar]
- Mountrichas, G., Georgantopoulos, I., Secrest, N. J., et al. 2017, MNRAS, 468, 3042 [NASA ADS] [CrossRef] [Google Scholar]
- Muldrew, S. I., Hatch, N. A., & Cooke, E. A. 2015, MNRAS, 452, 2528 [NASA ADS] [CrossRef] [Google Scholar]
- Murphy, K. D., & Yaqoob, T. 2009, MNRAS, 397, 1549 [Google Scholar]
- Ni, Y., Di Matteo, T., Gilli, R., et al. 2020, MNRAS, 495, 2135 [NASA ADS] [CrossRef] [Google Scholar]
- Oteo, I., Ivison, R. J., Dunne, L., et al. 2018, ApJ, 856, 72 [Google Scholar]
- Overzier, R. A. 2016, A&ARv, 24, 14 [Google Scholar]
- Peca, A., Cappelluti, N., Urry, C. M., et al. 2023, ApJ, 943, 162 [NASA ADS] [CrossRef] [Google Scholar]
- Pérez-Martínez, J. M., Dannerbauer, H., Kodama, T., et al. 2023, MNRAS, 518, 1707 [Google Scholar]
- Pérez-Martínez, J. M., Kodama, T., Koyama, Y., et al. 2024, MNRAS, 527, 10221 [Google Scholar]
- Planck Collaboration XIII. 2016, A&A, 594, A13 [NASA ADS] [CrossRef] [EDP Sciences] [Google Scholar]
- Polletta, M., Soucail, G., Dole, H., et al. 2021, A&A, 654, A121 [NASA ADS] [CrossRef] [EDP Sciences] [Google Scholar]
- Popesso, P., Concas, A., Cresci, G., et al. 2023, MNRAS, 519, 1526 [Google Scholar]
- Radzom, B. T., Taylor, A. J., Barger, A. J., & Cowie, L. L. 2022, ApJ, 940, 114 [NASA ADS] [CrossRef] [Google Scholar]
- Rennehan, D. 2024, ApJ, submitted [arXiv:2406.06672] [Google Scholar]
- Rennehan, D., Babul, A., Hayward, C. C., et al. 2020, MNRAS, 493, 4607 [NASA ADS] [CrossRef] [Google Scholar]
- Ricci, C., Assef, R. J., Stern, D., et al. 2017, ApJ, 835, 105 [Google Scholar]
- Rizzo, F., Vegetti, S., Fraternali, F., Stacey, H. R., & Powell, D. 2021, MNRAS, 507, 3952 [NASA ADS] [CrossRef] [Google Scholar]
- Rotermund, K. M., Chapman, S. C., Phadke, K. A., et al. 2021, MNRAS, 502, 1797 [NASA ADS] [CrossRef] [Google Scholar]
- Scoville, N., Sheth, K., Aussel, H., et al. 2016, ApJ, 820, 83 [Google Scholar]
- Seabold, S., & Perktold, J. 2010, 9th Python in Science Conference, 57 [Google Scholar]
- Shanks, T., Ansarinejad, B., Bielby, R. M., et al. 2021, MNRAS, 505, 1509 [NASA ADS] [CrossRef] [Google Scholar]
- Shimakawa, R., Kodama, T., Hayashi, M., et al. 2018, MNRAS, 473, 1977 [NASA ADS] [CrossRef] [Google Scholar]
- Shimakawa, R., Pérez-Martínez, J. M., Koyama, Y., et al. 2024, MNRAS, 528, 3679 [NASA ADS] [CrossRef] [Google Scholar]
- Smail, I., Geach, J. E., Swinbank, A. M., et al. 2014, ApJ, 782, 19 [NASA ADS] [CrossRef] [Google Scholar]
- Song, M., Finkelstein, S. L., Ashby, M. L. N., et al. 2016, ApJ, 825, 5 [NASA ADS] [CrossRef] [Google Scholar]
- Stalevski, M., Ricci, C., Ueda, Y., et al. 2016, MNRAS, 458, 2288 [Google Scholar]
- Stern, D., Lansbury, G. B., Assef, R. J., et al. 2014, ApJ, 794, 102 [Google Scholar]
- Topping, M. W., Shapley, A. E., & Steidel, C. C. 2016, ApJ, 824, L11 [NASA ADS] [CrossRef] [Google Scholar]
- Toshikawa, J., Wuyts, S., Kashikawa, N., et al. 2024, MNRAS, 527, 6276 [Google Scholar]
- Tozzi, P., Pentericci, L., Gilli, R., et al. 2022a, A&A, 662, A54 [NASA ADS] [CrossRef] [EDP Sciences] [Google Scholar]
- Tozzi, P., Gilli, R., Liu, A., et al. 2022b, A&A, 667, A134 [NASA ADS] [CrossRef] [EDP Sciences] [Google Scholar]
- Traina, A., Gruppioni, C., Delvecchio, I., et al. 2024, A&A, 681, A118 [NASA ADS] [CrossRef] [EDP Sciences] [Google Scholar]
- Tran, K.-V. H., Nanayakkara, T., Yuan, T., et al. 2015, ApJ, 811, 28 [NASA ADS] [CrossRef] [Google Scholar]
- Trebitsch, M., Volonteri, M., & Dubois, Y. 2019, MNRAS, 487, 819 [CrossRef] [Google Scholar]
- Treister, E., & Urry, C. M. 2006, ApJ, 652, L79 [NASA ADS] [CrossRef] [Google Scholar]
- Ueda, Y., Akiyama, M., Hasinger, G., Miyaji, T., & Watson, M. G. 2014, ApJ, 786, 104 [Google Scholar]
- Umehata, H., Fumagalli, M., Smail, I., et al. 2019, Science, 366, 97 [Google Scholar]
- Urrutia, T., Lacy, M., Gregg, M. D., & Becker, R. H. 2005, ApJ, 627, 75 [Google Scholar]
- Vieira, J. D., Crawford, T. M., Switzer, E. R., et al. 2010, ApJ, 719, 763 [NASA ADS] [CrossRef] [Google Scholar]
- Vito, F., Brandt, W. N., Stern, D., et al. 2018a, MNRAS, 474, 4528 [Google Scholar]
- Vito, F., Brandt, W. N., Yang, G., et al. 2018b, MNRAS, 473, 2378 [Google Scholar]
- Vito, F., Brandt, W. N., Bauer, F. E., et al. 2019, A&A, 630, A118 [NASA ADS] [CrossRef] [EDP Sciences] [Google Scholar]
- Vito, F., Brandt, W. N., Lehmer, B. D., et al. 2020, A&A, 642, A149 [NASA ADS] [CrossRef] [EDP Sciences] [Google Scholar]
- Vito, F., Mignoli, M., Gilli, R., et al. 2022, A&A, 663, A159 [NASA ADS] [CrossRef] [EDP Sciences] [Google Scholar]
- Vito, F., Tozzi, P., Gilli, R., et al. 2023, ArXiv e-prints [arXiv:2311.08466] [Google Scholar]
- Wang, S. X., Brandt, W. N., Luo, B., et al. 2013, ApJ, 778, 179 [NASA ADS] [CrossRef] [Google Scholar]
- Wang, T., Elbaz, D., Alexander, D. M., et al. 2017, A&A, 601, A63 [NASA ADS] [CrossRef] [EDP Sciences] [Google Scholar]
- Weaver, J. R., Davidzon, I., Toft, S., et al. 2023, A&A, 677, A184 [NASA ADS] [CrossRef] [EDP Sciences] [Google Scholar]
- Weisskopf, M. C., Wu, K., Trimble, V., et al. 2007, ApJ, 657, 1026 [Google Scholar]
- Xue, Y. Q., Brandt, W. N., Luo, B., et al. 2010, ApJ, 720, 368 [Google Scholar]
- Xue, Y. Q., Luo, B., Brandt, W. N., et al. 2016, ApJS, 224, 15 [Google Scholar]
- Yamada, T., Nakamura, Y., Matsuda, Y., et al. 2012, AJ, 143, 79 [Google Scholar]
- Yang, G., Chen, C.-T. J., Vito, F., et al. 2017, ApJ, 842, 72 [Google Scholar]
- Yang, G., Brandt, W. N., Darvish, B., et al. 2018a, MNRAS, 480, 1022 [NASA ADS] [CrossRef] [Google Scholar]
- Yang, G., Brandt, W. N., Vito, F., et al. 2018b, MNRAS, 475, 1887 [NASA ADS] [CrossRef] [Google Scholar]
- Yang, G., Boquien, M., Buat, V., et al. 2020, MNRAS, 491, 740 [Google Scholar]
- Yang, G., Boquien, M., Brandt, W. N., et al. 2022, ApJ, 927, 192 [NASA ADS] [CrossRef] [Google Scholar]
- Zappacosta, L., Piconcelli, E., Duras, F., et al. 2018, A&A, 618, A28 [NASA ADS] [CrossRef] [EDP Sciences] [Google Scholar]
- Zheng, Z. Y., Wang, J. X., Finkelstein, S. L., et al. 2010, ApJ, 718, 52 [NASA ADS] [CrossRef] [Google Scholar]
- Zou, F., Brandt, W. N., Vito, F., et al. 2020, MNRAS, 499, 1823 [NASA ADS] [CrossRef] [Google Scholar]
- Zou, F., Yu, Z., Brandt, W. N., et al. 2024, ApJ, 964, 183 [NASA ADS] [CrossRef] [Google Scholar]
Appendix A: Grid of parameters value used for the SED fitting
Table A.1 lists the parameters and values used for the SED fitting procedure with CIGALE, as described in Sect. 3.4.
Parameters and values for the modules used with CIGALE. Parameters not listed here are fixed to their default values.
Appendix B: AGN fraction in protoclusters
We report the computations used to estimate the X-ray selected AGN fractions fAGN among members of a few protoclusters for which dedicated X-ray observations have been obtained and published (Fig. 6). We consider different galaxy populations, based on their selections: sub-mm selected dusty star-forming galaxies (DSFGs), objects selected on the basis of their optical/IR SED (e.g. Lymam-break or BX/MD galaxies), Lyα emitters (LAEs), and Hα emitters (HAEs). We also consider separately the secure members of a protocluster (i.e. those identified spectroscopically) and all possible members, including candidate members, except for the DSFG population, for which only spectroscopically identified galaxies are considered. The resulting AGN fractions are summarised in Table 4.
The intention of this collection is to provide an easy-to-access list of values of AGN fractions in the literature, for first-order comparisons. Several caveats should be considered when using these values, some of them are discussed here. First, we consider these structures as bona fide protoclusters, based on the definitions provided by the referenced papers. Second, the selection methods (e.g. definitions of colors, thresholds, sampled rest-frame wavelengths, etc.) and sensitivities of the multi-wavelength observations, including the X-ray coverage used to identify AGNs, are not homogeneous among these objects. Third, the fractions have been computed simply considering the number of X-ray detected AGNs divided by the number of known galaxies belonging to a given class. A more reliable and complete procedure would take into account, for instance, the varying sensitivities of the X-ray and multi-wavelength observations on a field, and control for the stellar mass distribution of the parent populations of galaxies. A few of the works mentioned below did take these precautions into account for individual protoclusters, but extending such procedures homogeneously to the entire protocluster sample considered here is beyond the scope of this paper. Finally, we rely on the published X-ray-to-multiwavelength counterpart matching, unless otherwise noted. The matching procedures generally vary among different works. As a consequence, the following list is far from being complete and homogeneous.
CL 0218.3–0510 (z = 1.62): Krishnan et al. (2017) considered 46 massive (i.e. M* > 1010 M⊙) galaxies identified as robust protocluster member candidates via optical/IR SED fitting by Hatch et al. (2016), and found that 8 of them are detected in the X-ray band, corresponding to an AGN fraction of  . SMGs have been identified as potential protocluster members (e.g. Smail et al. 2014; Chen et al. 2016), but spectroscopic confirmation is not available to our knwoledge, so we do not consider this population. Tran et al. (2015) reported that 1 out of 33 Hα emitters associated with the protocluster is X-ray detected, corresponding to
  .
.
Spiderweb protocluster (z = 2.156). Tozzi et al. (2022a) studied the X-ray selected AGNs in this structure using deep (700 ks) Chandra observations. They reported the detection of 14 protocluster members (13 of which identified spectroscopically), corresponding to an AGN fraction of fAGN = 0.25 ± 0.04 (including systematic uncertainties) among spectroscopically identified, massive (log ) protocluster members. Here, we instead report the X-ray AGN fractions corresponding to the different galaxy selection methods, considering no threshold in stellar mass. The galaxy parent populations are collected from the same catalogs used by (Tozzi et al. 2022a, see their Table 2), to which we added the spectroscopic sample recently presented by Pérez-Martínez et al. (2023). We obtained AGN fractions of
  ,
,  ,
,  , and
, and  . All DSFGs are spectroscopically identified, while considering only spectroscopically confirmed objects for the other populations we obtained
  ,
,  , and
, and  . We note that Jin+21 selected 46 protocluster members as CO-emitters. Among this population we found
  .
.
PHz G237.01+42.50 (z = 2.16). Polletta et al. (2021) reported the identification of this protocluster with 31 spectroscopic members detected in optical/IR observations. Among them, three are known X-ray AGNs, corresponding to  . We note that Polletta et al. (2021) also included an X-ray undetected broad emission-line AGN in their computation of the AGN fraction in the structure, while here we are limited to X-ray selected AGNs. Among the 31 members of the protocluster, 6 were also selected as HAEs, one of which is an X-ray AGN, namely,
  . Finally, 2 out of the 4 DSFGs selected with Herschel/SPIRE among the members are X-ray AGNs, corresponding to
  .
.
2QZ Cluster (z = 2.23). Lehmer et al. (2013) presented the Chandra observations of this structure. Seven out of 22 HAEs are X-ray detected (i.e.  ), including the four optically selected AGN that were used as signposts of the protocluster.
QSO HS 1700+643 (z = 2.30). Among the spectroscopically confirmed members of the protocluster which do not reside in regions affected by high X-ray background due to the presence of foreground clusters, Digby-North et al. (2010) reported the X-ray detection of 2 out of 29 LAEs ( ), 1 out of 12 HAEs (
 ), and 2 out of 39 BX/MD selected galaxies (
 ). We note that these fraction are different from those reported by Digby-North et al. (2010), because they considered also objects not confirmed spectroscopically and applied corrections for the X-ray sensitivity over the field. Lacaille et al. (2019) identified spectroscopically four DSFGs as members of the protocluster, and none of them are detexcted in the X-rays, corresponding to
  .
.
USS 1558–003 (z = 2.53). Combining the catalogs of Shimakawa et al. (2018), Aoyama et al. (2022), and Pérez-Martínez et al. (2024), 57 HAEs are secure members of this structure, either because of spectroscopic identification or matching detection in narrow-band imaging targeting the Lyα emission line (but we note that the catalog of LAEs has not been published to our knowledge). Two of them are detected in the X-rays (Macuga et al. 2019); namely,  . Considering also member candidates, the fraction is
  . Nine DSFGs have been spectroscopically identified in the structure Aoyama et al. (2022), and all of them are also selected as HAEs. Matching their positions with the catalog of Macuga et al. (2019), we found no X-ray detection; namely,
  .
.
SSA22 (z = 3.09). We base the computation of the X-ray AGN fraction in this protocluster on the work of (Lehmer et al. 2009a, see also Monson et al. 2023), who reported X-ray detection of six out of 27 member candidates selected as LBGs, namely,  , and five out of 144 LAEs candidates, namely,
  . These fractions are slightly different than those reported in Lehmer et al. (2009a), due to the different way in which they are computed. Umehata et al. (2019) presented deep ALMA observations of the SSA22 fields. Among the 12 DSFGs spectroscopically confirmed as members of the protocluster, 6 are detected in the X-ray catalog of Lehmer et al. (2009b); namely,
  . We also note that since the publication of those works a few new relevant datasets have been presented (e.g. Yamada et al. 2012; Kubo et al. 2015, 2016; Topping et al. 2016; Radzom et al. 2022), but are not considered here.
DRC (z = 4.002). Among the 13 spectroscopically identified SMGs in this structure (Oteo et al. 2018; Ivison et al. 2020), two are X-ray selected AGN, corresponding to  (Vito et al. 2020).
All Tables
Parameters and values for the modules used with CIGALE. Parameters not listed here are fixed to their default values.
All Figures
|
Fig. 1. Soft-band, hard-band, and full-band Chandra images (10″ × 10″) of C1, from left to right. In the right panel, we also plot the ALMA Band 7 continuum contours (in grey) and mark the positions (purple circles) of spectroscopically identified protocluster members. The contours are derived from the reduced ALMA data of Hill et al. (2020), with a beam size of 0.35″ × 0.29″, starting at 5σ with steps of 7σ. |
| In the text | |
|
Fig. 2. Same as Fig. 1, but for source C6. We added in cyan the ATCA 2.2 GHz contours (beam size of 7.7″ × 4.2″), starting at 3σ with steps of 3σ, obtained from the data reduced and presented by Chapman et al. (2024). |
| In the text | |
|
Fig. 3. Observed spectrum (red circles) and best-fitting MYTorus model (black line) of C1 (see Sect. 3.1) in the top panel: Response-corrected spectrum and best-fitting model in the bottom panel. We also show the individual additive components of the model with grey lines, as reported in the legend. In both panels, the spectrum is binned at 1σ for display purposes. |
| In the text | |
|
Fig. 4. X-ray luminosity versus column density for different populations of AGNs: optically selected Type-1 QSOs at z = 1.4 − 4.5 (blue symbols; from Just et al. 2007; Martocchia et al. 2017), dust-reddened QSOs at z = 0.4 − 3.2 (green symbols; from Urrutia et al. 2005; Banerji et al. 2014; Mountrichas et al. 2017; Goulding et al. 2018; Lansbury et al. 2020), DSFGs at z = 0.3 − 5.2 (yellow symbols; from Wang et al. 2013; Corral et al. 2016; Zou et al. 2020), Hot DOGs at at z = 1.0 − 4.6 (violet symbols; from Stern et al. 2014; Assef et al. 2016; Ricci et al. 2017; Vito et al. 2018a; Zappacosta et al. 2018), X-ray selected AGNs in the Spiderweb and SSA protoclusters (z = 2.2 − 3.2, orange symbols, Ivison et al. 2019; Tozzi et al. 2022a; Monson et al. 2023), and X-ray selected AGNs in the Chandra deep field-south at all redshifts (gray symbols, with median error bar showed in the bottom-right corner of the plot; from Li et al. 2019). The X-ray selected AGNs in SPT2349–56 and DRC are plotted as red stars and squares, respectively. C1 and DRC-2 (Vito et al. 2020) have remarkably similar physical properties. Their X-ray luminosities are similar to those of luminous optically selected QSOs, but obscured by gas column densities even thicker than those of hot DOGs. |
| In the text | |
|
Fig. 5. Best-fitting models for C1 and C6 returned by the CIGALE fitting code. The optical-to-mm photometric points were collected from Hill et al. (2020, 2022), while for C6, we added the radio measurements of Chapman et al. (2024). The absorption-corrected X-ray fluxes correspond to the X-ray models discussed in Sects. 3.1 and 3.3. The sub-mm/mm photometry of C1 is dominated by the AGN-reprocessed emission. The AGN in C6 contributes more modestly at such wavelengths, but dominates the radio emission. |
| In the text | |
|
Fig. 6. Fraction of X-ray selected AGNs in a sample of protoclusters as a function of redshift. The different symbol shapes and colors correspond to different structures and selection methods of the parent galaxy population, as marked in the figure. Different symbols for the same structure are slightly shifted in redshift for clarity. We consider the parent samples of spectroscopically confirmed protocluster members, when available (filled symbols); otherwise we consider all the member candidates (empty symbols). We refer to Sect. 4.2 and Appendix B for the computation of these values and the relevant citations. For comparison with low-redshift, virialised systems, the filled and hashed yellow stripes represent the X-ray AGN fractions in galaxy clusters presented by Martini et al. (2009) and Bufanda et al. (2017), respectively. |
| In the text | |
|
Fig. 7. Space density of luminous (log |
| In the text | |
Current usage metrics show cumulative count of Article Views (full-text article views including HTML views, PDF and ePub downloads, according to the available data) and Abstracts Views on Vision4Press platform.
Data correspond to usage on the plateform after 2015. The current usage metrics is available 48-96 hours after online publication and is updated daily on week days.
Initial download of the metrics may take a while.