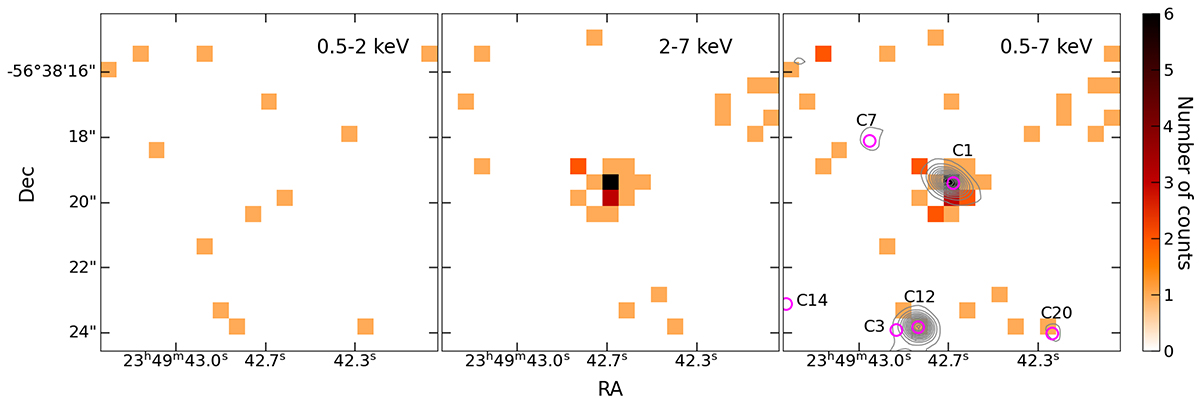
Fig. 1.
Download original image
Soft-band, hard-band, and full-band Chandra images (10″ × 10″) of C1, from left to right. In the right panel, we also plot the ALMA Band 7 continuum contours (in grey) and mark the positions (purple circles) of spectroscopically identified protocluster members. The contours are derived from the reduced ALMA data of Hill et al. (2020), with a beam size of 0.35″ × 0.29″, starting at 5σ with steps of 7σ.
Current usage metrics show cumulative count of Article Views (full-text article views including HTML views, PDF and ePub downloads, according to the available data) and Abstracts Views on Vision4Press platform.
Data correspond to usage on the plateform after 2015. The current usage metrics is available 48-96 hours after online publication and is updated daily on week days.
Initial download of the metrics may take a while.