Fig. 4.
Download original image
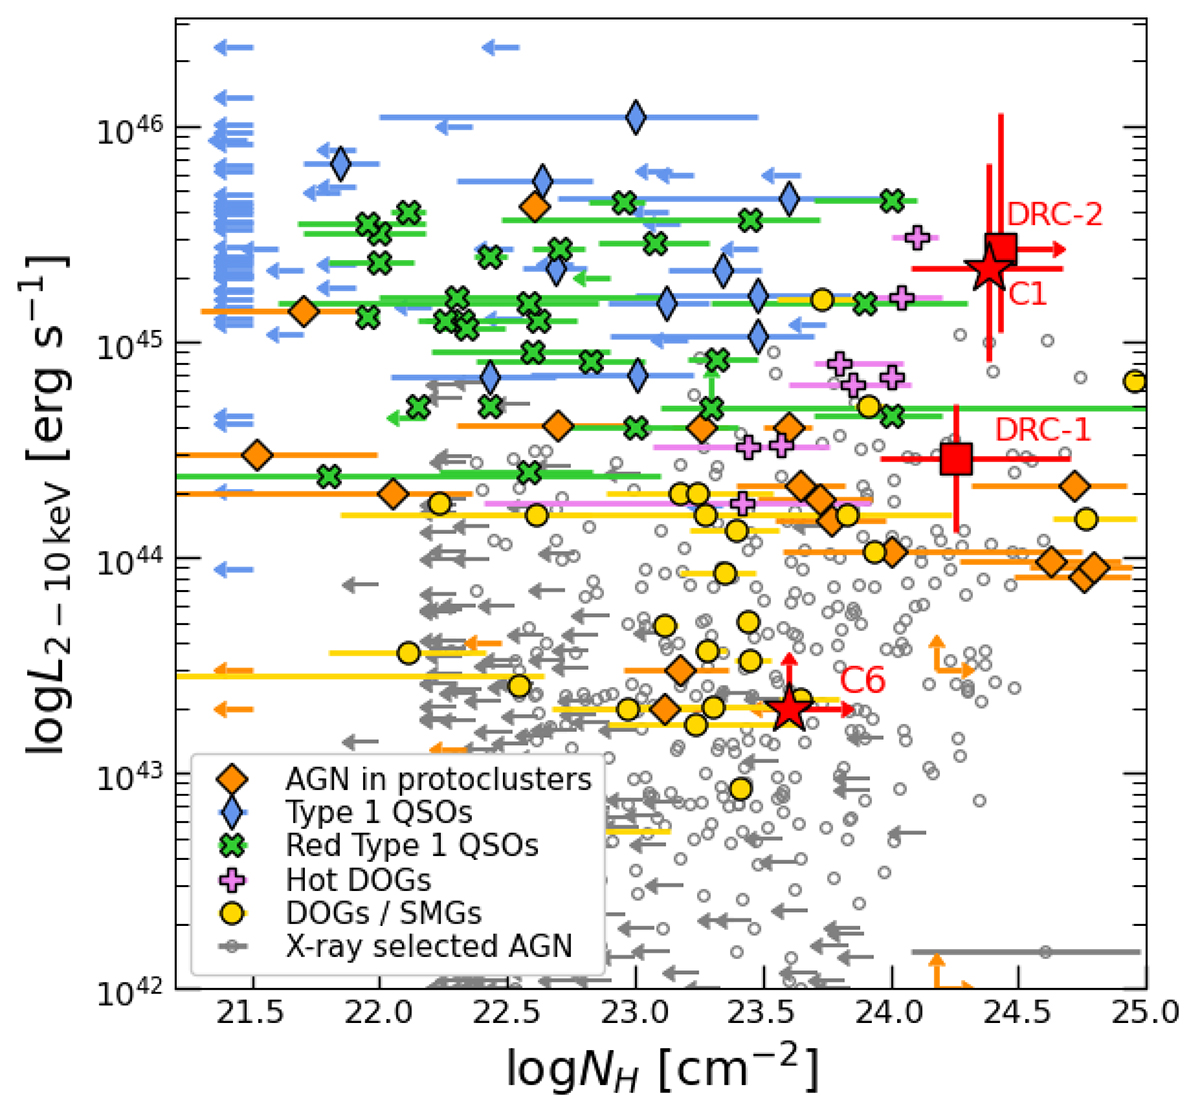
X-ray luminosity versus column density for different populations of AGNs: optically selected Type-1 QSOs at z = 1.4 − 4.5 (blue symbols; from Just et al. 2007; Martocchia et al. 2017), dust-reddened QSOs at z = 0.4 − 3.2 (green symbols; from Urrutia et al. 2005; Banerji et al. 2014; Mountrichas et al. 2017; Goulding et al. 2018; Lansbury et al. 2020), DSFGs at z = 0.3 − 5.2 (yellow symbols; from Wang et al. 2013; Corral et al. 2016; Zou et al. 2020), Hot DOGs at at z = 1.0 − 4.6 (violet symbols; from Stern et al. 2014; Assef et al. 2016; Ricci et al. 2017; Vito et al. 2018a; Zappacosta et al. 2018), X-ray selected AGNs in the Spiderweb and SSA protoclusters (z = 2.2 − 3.2, orange symbols, Ivison et al. 2019; Tozzi et al. 2022a; Monson et al. 2023), and X-ray selected AGNs in the Chandra deep field-south at all redshifts (gray symbols, with median error bar showed in the bottom-right corner of the plot; from Li et al. 2019). The X-ray selected AGNs in SPT2349–56 and DRC are plotted as red stars and squares, respectively. C1 and DRC-2 (Vito et al. 2020) have remarkably similar physical properties. Their X-ray luminosities are similar to those of luminous optically selected QSOs, but obscured by gas column densities even thicker than those of hot DOGs.
Current usage metrics show cumulative count of Article Views (full-text article views including HTML views, PDF and ePub downloads, according to the available data) and Abstracts Views on Vision4Press platform.
Data correspond to usage on the plateform after 2015. The current usage metrics is available 48-96 hours after online publication and is updated daily on week days.
Initial download of the metrics may take a while.