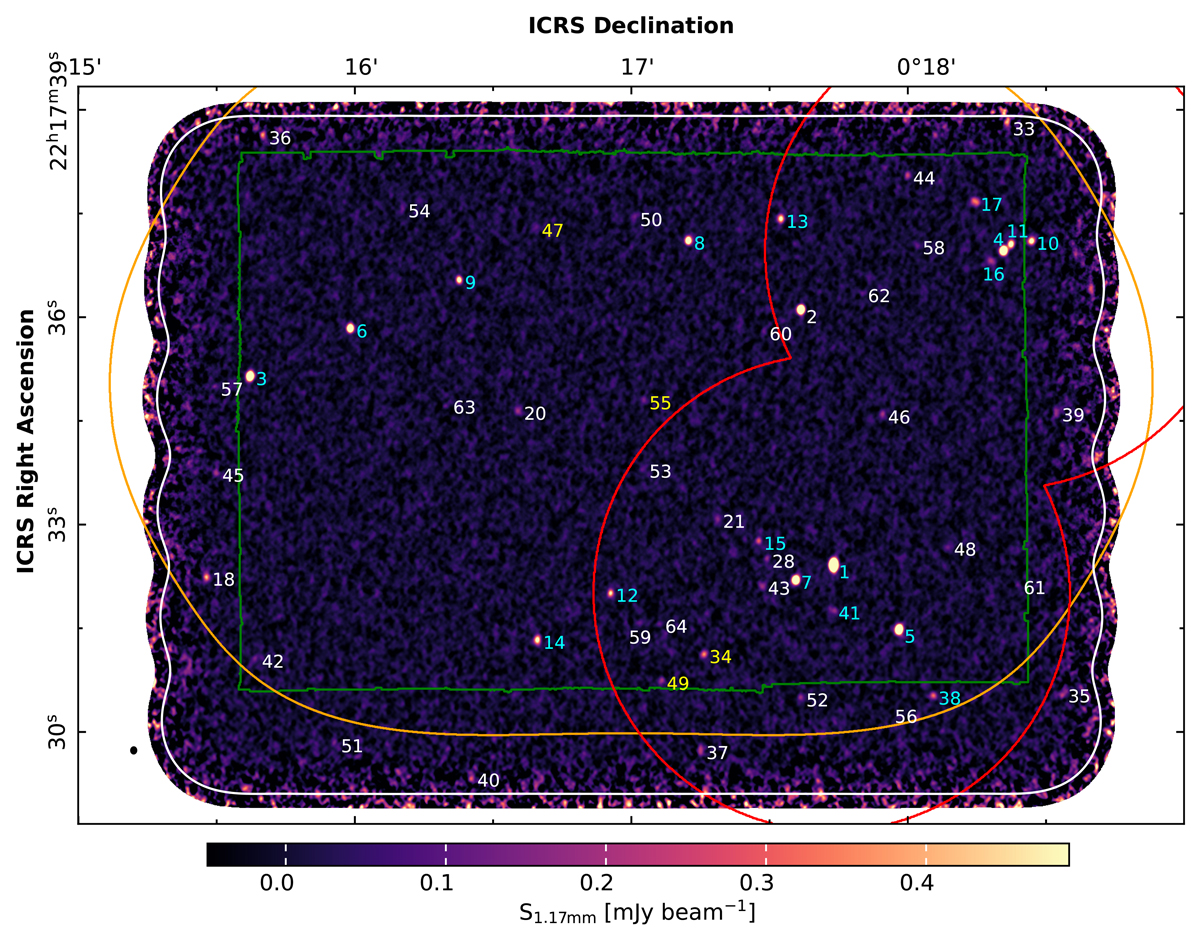
Fig. 1.
Download original image
Left: 1.17 mm continuum map displayed in the flux range −2σ − 20σ. The black ellipse in the lower left indicates the beam FWHM. Sources with S/N > 4.2 are indicated with their ID number in Table 1. The IDs of z = 3.09 protocluster members confirmed by spectroscopy are highlighted in cyan. Sources with non-zero values at z = 3.09 in their photometric redshift probability functions (A34, A47, A49, and A55) are in yellow. The white contour indicates a primary beam response of 20%. The coloured contours show the areas with spectroscopic coverage from VLT/MUSE (green), the Umehata et al. (2019) shallow CO mosaic (orange), and deep CO observations of A1 and A4 (red).
Current usage metrics show cumulative count of Article Views (full-text article views including HTML views, PDF and ePub downloads, according to the available data) and Abstracts Views on Vision4Press platform.
Data correspond to usage on the plateform after 2015. The current usage metrics is available 48-96 hours after online publication and is updated daily on week days.
Initial download of the metrics may take a while.