| Issue |
A&A
Volume 699, July 2025
|
|
|---|---|---|
| Article Number | A230 | |
| Number of page(s) | 13 | |
| Section | Stellar structure and evolution | |
| DOI | https://doi.org/10.1051/0004-6361/202554573 | |
| Published online | 10 July 2025 | |
X-ray polarization of Z-type neutron star low-mass X-ray binaries
I. Model-independent, time-resolved X-ray polarimetry
1
Dipartimento di Matematica e Fisica, Università degli Studi Roma Tre, Via della Vasca Navale 84, I-00146 Roma, Italy
2
INAF – Istituto di Astrofisica e Planetologia Spaziali, Via del Fosso del Cavaliere 100, I-00133 Roma, Italy
3
INAF – Osservatorio Astronomico di Cagliari, Via della Scienza 5, I-09047 Selargius, (CA), Italy
4
INAF – Osservatorio di Astrofisica e Scienza dello Spazio, Via P. Gobetti 101, I-40129 Bologna, Italy
⋆ Corresponding author: This email address is being protected from spambots. You need JavaScript enabled to view it.
Received:
17
March
2025
Accepted:
26
May
2025
Abstract
Z-sources are a particular class of neutron star low-mass X-ray binaries characterized by a wide Z-like track in their hard color-soft color (or hardness-intensity) diagrams, with three branches: the horizontal (HB), the normal (NB), and the flaring branch (FB). Spectropolarimetric observations with the Imaging X-ray Polarimetry Explorer (IXPE) show that the polarization in these sources varies along the Z-track, reaching unexpectedly high values in the HB. In this work, we collected all the polarimetric results obtained so far from observations of Z-sources with IXPE, using a model-independent analysis with IXPEOBSSIM. We first performed a detailed characterization of the spectral state of each source along the Z-track using IXPE, along with the Nuclear Spectroscopic Telescope Array (NuSTAR) and the Neutron Star Interior Composition Explorer (NICER) data and then estimated the polarization for each branch. Although we confirm that the average polarization in the 2–8 keV band decreases moving from the HB to the NB for all three Z-sources observed in these branches, we also observe a qualitatively increasing trend from the NB to the FB. Whereas this increase is clearly significant for Cyg X-2 and Sco X-1, the polarization remains consistent at the 90% confidence level for GX 5–1 and GX 349+2, while for XTE J1701–462 and GX 340+0 only upper limits are found in the FB. For most sources, the average polarization angle in the 2–8 keV range remains consistent along the CCD; however, we observe a significant rotation for both Sco X-1 and GX 349+2 (at the 90% confidence level) as they move from the NB to the FB. In addition, we observe a significant increase in the polarization degree with energy in most of the observed Z-sources, with some also exhibiting a rotation of the polarization angle with energy (approximately by 20° −30°).
Key words: accretion / accretion disks / polarization / stars: neutron / X-rays: binaries
© The Authors 2025
 Open Access article, published by EDP Sciences, under the terms of the Creative Commons Attribution License (https://creativecommons.org/licenses/by/4.0), which permits unrestricted use, distribution, and reproduction in any medium, provided the original work is properly cited.
This article is published in open access under the Subscribe to Open model. This email address is being protected from spambots. You need JavaScript enabled to view it. to support open access publication.
1. Introduction
The launch of the NASA and Italian Space Agency Imaging X-ray Polarimetry Explorer (IXPE; Weisskopf et al. 2022) on 2021 December 9 opened a new window in X-ray astronomy, providing for the first time space-, time-, and energy-resolved polarimetric observations of different classes of X-ray sources. Among the brightest X-ray sources, weakly magnetized neutron stars in low-mass X-ray binaries (NS-LMXBs) represent ideal targets for studying radiation processes in the strong-gravity regime. NS-LMXBs accrete matter via Roche-lobe overflow, typically from a late main-sequence star. Following their tracks in hard-color/soft-color diagrams (CCDs) or in hardness-intensity diagrams (HIDs; Hasinger & van der Klis 1989; van der Klis 1989), NS-LMXBs are traditionally divided into: Atoll sources (LX ∼ 1036 erg s−1), which exhibit compact tracks in a rounded single spot in the hard region of the CCD, termed “island” state or in a “banana” shape for bright Atolls (LX ∼ 1037 − 1038 erg s−1; van der Klis 1995); Z-sources (LX > 1038 erg s−1), characterized by a wide Z-like three-branch pattern in the CCD, composed of the horizontal branch (HB), the normal branch (NB) and flaring branch (FB). The luminosity and accretion rate are expected to increase as the sources move from the HB to the FB (Migliari & Fender 2006). The Z-sources can be further divided into two subgroups: Cyg X-2-like sources (e.g., Cyg X-2, GX 5–1, and GX 340+0) display the full Z-track with full HB and NB, but with weak FB; in contrast, Sco X-1-like sources (e.g., Sco X-1, GX 17+2, and GX 349+2) show little or no HB, but the FB is stronger and more frequent, with large increases in X-ray intensity (Kuulkers et al. 1994; Church et al. 2012).
Based on IXPE observations to date, the Z-sources appear to be the most polarized NS-LMXBs in the 2–8 keV energy band (Farinelli et al. 2023; Cocchi et al. 2023; Fabiani et al. 2024; La Monaca et al. 2024a; Bhargava et al. 2024a,b), reaching unexpectedly high values along the HB (≈4%). The observed polarization strongly depends on the position along the CCDs or HIDs: it decreases (up to ≈1%) with no significant rotation of the polarization angle (Cocchi et al. 2023; Fabiani et al. 2024) while moving from the HB to the NB or FB. However, the polarization along the NB and FB separately has not been resolved, with the exception of Sco X-1 (La Monaca et al. 2024a). In most sources, the observed polarization seems to be related to the hard component: the typical X-ray emission of NS-LMXBs is generally described by a soft thermal component related to the accretion disk (Mitsuda et al. 1984, 1989) or the NS surface emission (White et al. 1988), plus a harder component produced by inverse Compton scattering of photons in the hot electron corona. However, the shape and nature of this region are unclear. X-ray polarization strongly depends on the geometry of the Comptonizing region; therefore, by studying the polarization properties of Z-sources along the CCDs or HIDs, we can obtain insights into the nature and evolution of the hot electron plasma corona in these systems.
In this work, we collect the polarimetric data of each Z-source observed by IXPE to date and perform a new analysis: in this first paper, we present the new model-independent, time-resolved polarimetric analysis using the PCUBE algorithm of IXPEOBSSIM (Baldini et al. 2022). We follow the same data reduction procedure and methodological approach for all Z-sources considered, to enable a direct comparison between the different sources and avoid unnecessary biases. The paper is structured as follows. In the next section, we introduce each Z-source observed with IXPE. In Sect. 3, we report the observations and data reduction used in this work. In Sect. 4, we describe the timing properties of each source to characterize their spectral state. In Sects. 5 and 6, we discuss the polarimetric results obtained with IXPE using a model-independent analysis, followed by the conclusions in Sect. 7.
2. Z-Sources
2.1. Cyg X-2
Cyg X-2 was first identified in X-rays in the 1960s (Byram et al. 1966). When the Rossi X-ray Timing Explorer (RXTE) detected a Type-I X-ray burst with the source in a high-intensity state, it was verified to be an NS-LMXB (Smale 1998). The source has been observed several times in the optical (van Paradijs et al. 1990; Casares et al. 1998; Orosz & Kuulkers 1999). From the modeling of ellipsoidal light curves, the NS mass is estimated to be 1.71 ± 0.21 M⊙ for an inclination of 62.5° ±4° (Orosz & Kuulkers 1999). The estimated distance of Cyg X-2 is between 8 and 11 kpc (Cowley et al. 1979; Smale 1998), while optical observations tend to locate the source at 7.2 ± 1.1 kpc (Orosz & Kuulkers 1999).
Cyg X-2 was subsequently classified as a Z-source by Hasinger & van der Klis (1989), covering the entire Z-track generally within a few days, with irregular dips during flaring activity. Due to its high X-ray flux and persistent nature, the spectra of Cyg X-2 have been extensively studied. Broadband spectra are typically well described by a combination of a soft multicolor disk emission and a hard Comptonization component in a region with low temperature (kTe ∼ 3 keV) and relatively high optical depth (τ ∼ 5 − 10, depending on the geometry). In particular, as Cyg X-2 moves from the HB to the NB, the inner edge of the accretion disk appears to be closer to the NS surface as the accretion rate increases (Di Salvo et al. 2002). In addition, features due to reflection off the accretion disk have also been detected (Smale et al. 1993; Cackett et al. 2010; Mondal et al. 2018; Ludlam 2024). Considering a full reflection model with recent observations with NICER and NuSTAR, Ludlam et al. (2022) estimate the inclination of the system to be i ∼ 60 − 70°, consistent with the optical results (Orosz & Kuulkers 1999), while the inner disk appears to remain close to the innermost stable circular orbit as the source moves along the CCD. Moreover, an emission line at ∼1 keV has also been observed with different missions (Vrtilek et al. 1986; Kuulkers et al. 1997; Di Salvo et al. 2002; Farinelli et al. 2009; Cackett et al. 2010), which is probably due to photoionized material farther out in the disk (Vrtilek et al. 1986). Along the HB, a transient hard tail was detected above 30 keV, which appears to be correlated with the radio jet emission (D’Amico et al. 2001; Paizis et al. 2006). The presence of a subrelativistic radio jet at 141° east of north was found with Very-long-baseline interferometry (VLBI) at 5 GHz when the source was in the HB (Spencer et al. 2013).
2.2. XTE J1701–462
After more than 15 years of quiescence since its first outburst (Lin et al. 2009a,b), XTE J1701–462 became bright again on 2022 September 6 (Iwakiri et al. 2022; Chandra 2022). Discovered at the beginning of its 2006 outburst, the source was soon identified as the first transient Z-source (Remillard et al. 2006; Homan et al. 2006, 2007a,b), also showing kHz quasi-periodic oscillations (QPOs) in the RXTE time domain during its soft state (Sanna et al. 2010). Among NS-LMXBs, XTE J1701–462 is unique, as it is the only known source to exhibit all spectral substates during its outburst evolution, from Cyg X-2-like to Sco X-1-like Z-source, down to the bright Atoll, and finally to the island Atoll state (Lin et al. 2009b; Homan et al. 2010). Since there are no absorption dips or eclipses in its light curves, the inclination of the system cannot be high (≲70° −75°; Lin et al. 2009b).
During its Z-source state, XTE J1701–462 spectra can be well described by a combination of soft thermal disk emission and a hard Comptonization component (Lin et al. 2009b; Wang et al. 2014; Cocchi et al. 2023; Thomas et al. 2024). Reflection features have been observed with NICER and NuSTAR. Using full reflection models, the inclination of the system appears to be very low (≈20° −30°; Thomas et al. 2024), with an inner disk radius close to the innermost stable circular orbit (≈1.5 − 2 RISCO; Thomas et al. 2024). The typical transient hard tail was also observed during the HB of its first outburst (Paizis et al. 2006).
2.3. GX 5–1
GX 5–1 is a Z-source discovered in 1968 with an Aerobee rocket (Bradt et al. 1968). It is located near the Galactic center at a distance of about 7.5 kpc (Fabiani et al. 2024). This estimate was derived from the equivalent hydrogen column density and a 3D extinction map of the Ks radiation in the Milky Way (Gambino et al. 2016). This result is consistent with values obtained previously (e.g., Penninx 1989; Smith et al. 2006). Early GX 5–1 observations were likely contaminated by the nearby black hole LMXB GRS 1758–258, located only 40′ away. However, GX 5–1 is much brighter below 20 keV once the two sources were resolved (Sunyaev et al. 1991; Gilfanov et al. 1993). Radio emission from GX 5–1 due to a compact jet was also detected (Fender & Hendry 2000) and a probable infrared companion candidate has been identified thanks to the precise localization of the radio counterpart (Jonker et al. 2000a). Moreover, Chandra observations identified an X-ray halo related to scattering of X-ray photons, arising from the presence of multiple clouds along the line of sight (Smith et al. 2006; Clark 2018).
Unlike most NS-LMXBs, no reflection features have been observed in any of GX 5–1 spectra (Homan et al. 2018; Fabiani et al. 2024). The X-ray continuum can be well described by a combination of multicolor disk blackbody emission and Comptonization of blackbody photons emitted from the NS surface in the boundary or spreading layer. The lack of reflection may be due to a highly ionized accretion disk, for which the Fe Kα line becomes broader and weaker as a result of Compton scattering (Ross et al. 1999; Homan et al. 2018), i.e., more difficult to identify even in very bright such as GX 5–1. INTEGRAL also detected a transient hard tail emission above 20–30 keV with the source in the HB (Paizis et al. 2006; Fabiani et al. 2024).
2.4. Sco X-1
Sco X-1 was the first extrasolar X-ray source discovered (Giacconi et al. 1962) and is the brightest persistent X-ray source in the sky. It is located at a distance of  kpc, as derived from Gaia Data Release 2 (Arnason et al. 2021). Its binary orbit has a low inclination angle to the observer (Titarchuk et al. 2014), with an orbital period of 0.79 days. Sco X-1 is a prototype of NS-LMXBs. It was classified as a Z-source based on its evolution along the CCD (Hasinger & van der Klis 1989), with a strong FB and large increases in X-ray intensity, distinct from Cyg X-2-like sources, and with a barely visible HB. Sco X-1 was the first X-ray binary system in which radio emission was observed (Andrew & Purton 1968). Very-long-baseline interferometry observations spatially resolved a radio jet at sub-milliarcsecond scales, characterized by the mildly relativistic motion of two components in opposite directions, with a position angle of 54° and an inclination of 44° (Fomalont et al. 2001a,b).
Typical X-ray spectra of Sco X-1 are characterized by soft thermal emission from the NS surface or the accretion disk and the Comptonization of these soft photons. The reflection component was observed in some spectra of Sco X-1, exhibiting the Compton hump above 10 keV (Di Salvo et al. 2006), as well as discrete features related to fluorescent emission and photoelectric absorption by heavy ions in the accretion disk. In particular, in addition to the “classical” Fe Kα line at approximately 6.6 keV, the Fe Kβ was also detected at 7.8 keV using NuSTAR data (Mazzola et al. 2021) and appears to be weaker along the FB.
Sco X-1 was also one of the sources observed during the first X-ray polarimetric campaign with the 8th Orbiting Solar Observatory (OSO-8). At 2.6 keV, the observed polarization degree (PD) was 0.4% ± 0.2% with a polarization angle (PA) of 29° ±10°, while at 5.2 keV, OSO-8 measured a PD of 1.3% ± 0.4% with a PA of 57° ±6° (Long et al. 1979). Before IXPE, Sco X-1 was observed with PolarLight (Long et al. 2022). A significant detection was found only at higher energy during high-flux intervals, with a PD of 4.3% ± 0.8% and a PA of 53° ±5° in the 4–8 keV band. The PA observed by both satellites appears to be aligned with the direction of the radio jet. However, these results were obtained by integrating over the long exposure of the observations; therefore, the precise spectral state of the source could not be determined.
2.5. GX 340+0
GX 340+0 is a bright Cyg X-2-like Z-source discovered by (Friedman et al. 1967; Rappaport et al. 1971) with an Aerobee rocket, with a highly variable radio counterpart, from which a distance of 11 ± 3 kpc has been derived (Fender & Hendry 2000). This radio emission appears to be correlated with the X-ray flux along its HB (Penninx et al. 1993; Oosterbroek et al. 1994; Berendsen et al. 2000), but without a clearly resolved radio jet. GX 340+0 typically covers the entire Z-track in a few days (Jonker et al. 2000b), mainly in the HB or NB, with rapid excursions along the FB (Jonker et al. 2000b; Seifina et al. 2013).
The broadband spectrum was decomposed with a soft thermal component and a Comptonized emission. In addition, the relativistic iron line and several reflection features have been detected in GX 340+0 spectra (Ueda et al. 2005; D’Aì et al. 2009; Cackett et al. 2010). Modeling the full reflection component leads to an inclination of about 35° −40° (D’Aì et al. 2009), consistent with the lack of dips in the light curves (Frank et al. 1987; Kuulkers & van der Klis 1996).
2.6. GX 349+2
GX 349+2 is a bright Sco X-1-like Z-source with a unique feature: while all known Z-sources trace the full Z-track during their evolution in their CCDs, GX 349+2 has been observed to cover only the NB or FB within a single day (Hasinger & van der Klis 1989; Kuulkers & van der Klis 1998; Di Salvo et al. 2001; Iaria et al. 2004; Cackett et al. 2009; Kashyap et al. 2023). The distance to this source is approximately 9 kpc (Grimm et al. 2002). Typical X-ray spectra are well characterized by a two-component model with a multicolor disk blackbody and Comptonization in the hot electron plasma of the corona (Di Salvo et al. 2001; Agrawal & Sreekumar 2003; Iaria et al. 2004, 2009; Coughenour et al. 2018). Using BeppoSAX data, a strong hard tail was observed to dominate the spectrum above 30 keV during non-flaring activity (Di Salvo et al. 2001), while all temperatures (i.e., those of the disk, the Comptonization region, and the seed-photons) tend to increase during flaring. At different epochs, a strong and variable relativistically broadened Fe Kα emission line has been observed (Cackett et al. 2008, 2009; Iaria et al. 2009; Coughenour et al. 2018). The inferred inclination of the system is approximately 25° −35° (depending on the model; Coughenour et al. 2018), while the inner disk radius tends to remain at an average radius of 17.5 Rg, but is not well constrained in the FB (Coughenour et al. 2018).
3. Observations and data reduction
3.1. IXPE
All IXPE observations of Z-sources are listed in Table 1. The time-resolved polarimetric data for each detector unit (DU) were produced using IXPEOBSSIM (v.31.0.3 Baldini et al. 2022) with the latest calibration files (v.20240701.13). The Stokes parameters, PD, PA, and the associated uncertainties were calculated with the unweighted, model-independent PCUBE binning algorithm of IXPEOBSSIM. For data extraction, we considered a circular region centered on the source, while the background was extracted from an annular region centered on the source with an inner and outer radius of 180″ and 240″, respectively. We obtained the radius of the extraction region via an iterative process that maximizes the signal-to-noise ratio (S/N) in the 2–8 keV band1, similar to the procedure described in Piconcelli et al. (2004). As all of these sources are very bright (> 2 counts s−1 arcmin−2), neither background rejection nor subtraction was performed, according to the prescription of Di Marco et al. (2023). Due to the extremely high X-ray flux of Sco X-1, the IXPE observation was performed with a partially opaque absorber (i.e., gray filter) mounted on the onboard calibration wheel (Ferrazzoli et al. 2020; Soffitta et al. 2021; Weisskopf et al. 2022) to reduce the flux to a level compatible with the dead time of each IXPE DU.
Log of the observations.
Although the IXPE energy band is limited, we also constructed the CCD for each observed source to characterize their state during the IXPE observations. In particular, we defined the IXPE soft and hard color as the ratios of the measured counts in the 3–5/2–3 keV and 5–8/3–5 keV energy bands, respectively.
3.2. NICER
The Neutron Star Interior Composition Explorer (NICER; Gendreau et al. 2016) observed most of the sources simultaneously with IXPE (see Table 1). We extracted the calibrated and cleaned files using the nicerl2 task of the NICER Data Analysis Software (NICERDAS v.13), together with the latest calibration files (CALDB v.20240206). The light curves used in this part of the work were derived with the nicerl3-lc command.
3.3. NuSTAR
The Nuclear Spectroscopic Telescope Array (NuSTAR; Harrison et al. 2013) observed most of the Z-sources considered simultaneously with IXPE (see Table 1). The unfiltered data were reduced using the latest calibration files (CALDB v.20240812) with the standard nupipeline task of the NuSTAR Data Analysis Software (NUSTARDAS v.2.1.4). Since all sources are particularly bright (> 100 counts s−1), we used the keyword statusexpr="(STATUS==b0000xxx00xxxx000)&&(SHIELD= = 0)" during the nupipeline task. For each focal plane module (FPM), we extracted the light curves using the nuproducts task, using a circular region centered on the sources. The extraction radii were derived using the same procedure to maximize the S/N as used for IXPE data reduction (see also Piconcelli et al. 2004). Since the background is not negligible at all energies, we performed background subtraction for the NuSTAR data. For both FPMs, we extracted the background from a circular region with 60″ radius, sufficiently far from the source. For each source observed with NuSTAR, we constructed the CCD or HID to characterize the state of the source and study its evolution. We defined soft and hard color as the ratios of the counts in the 6–10/3–6 keV and 10–20/6–10 keV energy ranges, respectively.
4. Timing properties
The light curves obtained with IXPE, NuSTAR, and NICER are shown in Fig. 1, using time bins of 200 s for IXPE and NuSTAR, and 50 s for NICER. Since Z-sources are variable objects and their polarization properties appear to be correlated with the position in the CCDs or HIDs, it is important to identify the position of each source along the Z-track. With the exception of the first observation of XTE J1701–462 and those of GX 340+0, all other sources have NuSTAR observations simultaneous with IXPE. Due to the limited band-pass of IXPE and NICER, it is difficult to distinguish between the three branches, particularly to identify the FB. NuSTAR enables the construction of proper CCDs and HIDs to characterize the state of the sources in detail. The NuSTAR CCDs or HIDs for each source are shown in Fig. 2. The choice to display the CCD for some sources and the HID for others is purely for graphical clarity: for Z-sources with the HB detected, this branch is more distinctly visible in the HID than in the CCD, whereas for other sources, the FB is better identified using the CCD instead of the corresponding HID. All Z-sources were observed at least once in the NB and in the FB. The FB intervals are highlighted with red regions in Fig. 1, while the HB intervals correspond to blue regions in Fig. 1. Only three of the Z-sources considered (XTE J1701–462, GX 5–1, and GX 340+0) were observed in the HB. In particular, GX 5–1 is the only one with both NuSTAR and NICER observations simultaneous with IXPE that exhibits the full Z-track (Fig. 1c). XTE J1701–462 was observed only by NICER during the first IXPE observation with the source in the HB (Fig. 3b; see also Cocchi et al. 2023), while during the second observation only NuSTAR observed the source tracking the NB and FB simultaneously with the IXPE exposure. Moreover, we further divided the second observations into three segments, highlighted with black intervals in Fig. 1b, similarly to Zhao et al. (2024). During the first and third intervals, while the source moves along the NB, the IXPE count rate and hard color are quite similar, and they vary during the second interval when the source moves along the FB. GX 340+0 was not observed simultaneously with IXPE by NICER or NuSTAR during the first segment (Fig. 1e). However, from IXPE data (Fig. 3e), the source can be identified in the HB. It remains in the same branch during the first two NuSTAR observations of this source, as indicated by its HID (Fig. 2e). During the second IXPE segment, the source mainly moves along the NB with a brief excursion into the HB (Fig. 3e), as indicated by the short black interval in Fig. 1e. In contrast, the source tracks the NB and FB during the NuSTAR exposure, a few days after the IXPE observation. Bhargava et al. (2024b) also identified the FB using AstroSat data simultaneous with the IXPE observation; therefore, we considered the same time intervals (see Table 2 of Bhargava et al. 2024a) to compute the polarization in the FB. For each source, we then created good time intervals (GTIs) for each detected branch and extracted all the data from each instrument to study the polarimetric properties of the Z-sources along the CCDs and HIDs in detail.
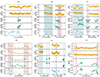 |
Fig. 1. IXPE, NuSTAR, and NICER light curves (count s−1) of each source. The second and fourth rows in each panel show the IXPE hard color (5–8 keV/3–5 keV) and the NuSTAR hard color (10–20 keV/6–10 keV), respectively. Open circles indicate data points not simultaneous with IXPE observation. Blue and red regions correspond to the HB and FB, respectively (see also Sects. 4 and 5 for more details). Time bins of 200 s were used for IXPE and NuSTAR, and 50 s for NICER. (a) Cyg X-2. (b) XTE J1701–462. (c) GX 5–1. (d) Sco X-1. (e) GX 340+0. (f) GX 349+2. |
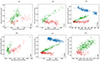 |
Fig. 2. CCDs or HIDs using the NuSTAR observations (Table 1) of each source. The soft and hard colors are defined as the ratio of the counts in the 6–10 keV/3–6 keV and 10–20 keV/6–10 keV bands, respectively. The three branches are highlighted with different colors. We considered time bins of 200 s. (a) Cyg X-2. (b) XTE J1701–462. (c) GX 5–1. (d) Sco X-1. (e) GX 340+0. (f) GX 349+2. |
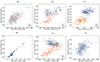 |
Fig. 3. CCDs of each source using the IXPE observations (Table 1). The soft and hard colors are defined as the ratio of the counts in the 3–5 keV/2–3 keV and 5–8 keV/3–5 keV bands, respectively. Different colors correspond to different observation of the source. Each bin corresponds to 1000 s. (a) Cyg X-2. (b) XTE J1701–462. (c) GX 5–1. (d) Sco X-1. (e) GX 340+0. (f) GX 349+2. |
5. Model-independent polarimetric analysis
5.1. Cyg X-2
Cyg X-2 was the first Z-source observed by IXPE for a total of approximately 93 ks (Farinelli et al. 2023). However, immediately after the first observation, IXPE observed the source again for a total of about 43 ks after the realignment of the optics modules. Until now, this observation has not been considered or analyzed. From the IXPE CCD (Fig. 3a), the source appears to remain in the same region of the Z-track (NB) during the second observation as in the first. The normalized Stokes parameters q and u measured by IXPE and derived with PCUBE are shown in Fig. 4a, along with the minimum detectable polarization (MDP99) at the 99% confidence level. As can be easily noted, the Stokes parameters are very similar and consistent within errors between the two observations; therefore, to obtain better statistics and smaller errors for the polarization, we combined the two observations. In particular, by combining the two observations, we found a significant polarization at 6.8σ in the 2–8 keV range (with PD = 1.8% ± 0.2%2 and PA = 135° ±4°), compared to the significance of 5σ and 4.4σ for the two observations separately. Moreover, unlike Farinelli et al. (2023), by combining the two observations, we were able to study the trend of the polarization with energy in greater detail. Using 1 keV bins, the polarization can be constrained in most bins, with upper limits only in the 2–3 keV and 7–8 keV energy bands. The polarization contours were calculated for each bin using Eq. (32) of Muleri (2022) and are shown in Fig. 5a. The resulting PD appears to increase from lower to higher energies, up to 3.3% ± 0.9% in the 6–7 keV range, without any significant rotation of the PA (see also Fig. 6a). We also performed a linear fit for the PD to test the significance of the increasing trend with energy (Fig. 6a). The fit obtained is characterized by a p-value of 0.034, indicating that the observed trend is statistically significant at the 97% confidence level. As highlighted in Sect. 4, Cyg X-2 tracks also the FB during the observation (see also Fig. 2a); therefore, we separated the data during the NB and FB. The polarization in the NB is very similar to that obtained considering the entire observations (with PD = 1.6% ± 0.3% and PA = 136° ±4°), since the source spent most of the time in the NB. However, during the short FB interval, polarization can be constrained at 3.5σ, with a PD of 4.2% ± 1.1% and a PA of 125° ±7° (see also Table 1).
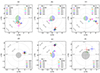 |
Fig. 4. 3D loops traced from the solution of the NLFFF extrapolation at 04:12 UT (left panel) and 22:00 UT (right panel), overplotted on the HMI magnetogram. The colour code of the loops is scaled with the height of the loops: red shows the footpoints and blue shows the highest point of the loops. |
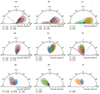 |
Fig. 5. Polarization contours at the 68%, 90%, and 99% confidence levels, computed using Eq. (32) of Muleri (2022). Different colors correspond to different energy bins. For Cyg X-2 and Sco X-1, the gray region corresponds to the jet direction. (a) Cyg X-2. (b) XTE J1701–462 (Obs. I). (c) XTE J1701–462 (Obs. II). (d) GX 5–1 (Obs. I). (e) GX 5–1 (Obs. II). (f) Sco X-1. (g) GX 340+0 (Obs. I). (h) GX 340+0 (Obs. II). (i) GX 349+2. |
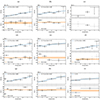 |
Fig. 6. Polarization degree and angle as a function of energy. Errors are at 1σ confidence level, while upper limits correspond to the 99% confidence level. Blue lines show linear fits to the PD data, with resulting p-values. Gray points represent the PAs corresponding to the PD upper limits. Orange lines indicate the average PAs in the 2–8 keV range, with associated 1σ error highlighted by the orange regions. (a) Cyg X-2. (b) XTE J1701–462 (Obs. I). (c) XTE J1701–462 (Obs. II). (d) GX 5–1 (Obs. I). (e) GX 5–1 (Obs. II). (f) Sco X-1. (g) GX 340+0 (Obs. I). (h) GX 340+0 (Obs. II). (i) GX 349+2. |
5.2. XTE J1701–462
IXPE observed XTE J1701–462 twice, about ten days apart, for approximately 48 ks per observation (Cocchi et al. 2023). During the first observation, with the source in the HB, the measured polarization is 4.4% ± 0.4% with −37° ±2°, well constrained at 12σ. In the second observation, the polarization drops and only an upper limit of 1.7%3 is obtained. These results are consistent with those found by Cocchi et al. (2023). The Stokes parameters obtained with PCUBE are shown in Fig. 4b. Unlike Cyg X-2, when considering 1 keV bins, the PD significantly increases only between the first two energy bins, with a slight rotation (≈20°), while both the PD and PA remain almost constant for energy above 3 keV (Figs. 5b and 6b). In fact, the linear fit obtained for the PD is not statistically significant in this case. However, we divided the first observation into two segments that correspond, respectively, to the upper left and upper right parts of the IXPE CCD (Fig. 3b), following the approach of Yu et al. (2025). Although the PD appears to slightly vary from 4.0% ± 0.5% (at 7.2σ significance) in the softer region to 4.9% ± 0.5% (at 9.3σ significance) as the source moves to the other region of the CCD, remaining consistent within the errors, the PA rotates by approximately 10°. For the second observation, we obtained a significant detection only in the 5–6 keV bin, while only upper limits are found at lower and higher energies (Figs. 5c and 6c). We further analyzed the second observation by considering the three segments already introduced in Sect. 4 (see also Zhao et al. 2024), and computing the average polarization in the 2–8 keV band during each segment. Although only an upper limit of 2.8% is obtained during the second interval with the source in the FB, the polarization can be computed during the other two intervals when the source moves along the NB. During the first interval before the FB, there is a marginal detection (at 2.6σ significance) with a PD of 2.2% ± 0.7% and a PA of 59° ±9°, while in the interval after the FB, the PD is well detected at 3.3σ significance with a similar PD of 2.1% ± 0.6% but a PA of −57° ±8°, rotated by approximately 60°. In fact, summing these two intervals to compute the total polarization along the NB, we obtain only an upper limit of 2.1%. The misalignment between the two intervals may explain this upper limit, since we are summing photons with non-parallel PAs.
5.3. GX 5–1
Similarly to XTE J1701–462, IXPE observed GX 5–1 twice, for approximately 48 ks each (Fabiani et al. 2024). Although the time interval between the two observations is longer than that of XTE J1701–462 (≈20 days), IXPE was able to cover the entire Z-track of GX 5–1 (Figs. 2c and 3c). However, IXPE detected significant polarization during both observations: in the first, when the source was in the HB, the polarization is 4.3% ± 0.3% at 13.5σ significance, while it decreases to 2.0% ± 0.3% at 6.5σ significance during the second observation, with the source moving along the NB and FB, consistent with the values obtained by Fabiani et al. (2024). Although the PD varies along the Z-track, the averaged PA in the 2–8 keV band remains consistent within the two observations. The normalized Stokes parameters obtained with PCUBE are shown in Fig. 4c. If we consider the NB and FB separately during the second observation, we find a PD of 1.9% ± 0.3% at 5.6σ significance in the NB, while the PD is 2.9% ± 0.8% during the short FB intervals (at 3.1σ significance), without any notable rotation of the PA between the two branches. Unlike Cyg X-2, for which the FB is significantly more polarized than the NB, in this case the PD measured in the two branches is still consistent within the errors at the 90% confidence level. The polarization contours for the two observations are shown in Figs. 5d and 5e. Similarly to Cyg X-2, the polarization is well constrained when considering 1 keV-energy bins when the source is in the HB and the polarization is higher, without any significant rotation of the PA. During the second observation, there is a slight rotation (≈20°) between the first two bins at lower energies (below 4 keV) compared to the higher-energy bins (see also Figs. 6d and 6e). For the first observation, the PD increases up to 6.9% ± 2.3%, while the linear fit yields a p-value of 0.069, suggesting a possible increasing trend with energy at the 93% confidence level. During the second observation, the PD reaches 2.8% ± 0.8% at high energies, but the observed increasing trend with energy is not statistically significant.
5.4. Sco X-1
Sco X-1 was observed by IXPE for approximately 24 ks, using the gray filter to reduce its high X-ray flux (Ferrazzoli et al. 2020; La Monaca et al. 2024a). The PCUBE algorithm of IXPEOBSSIM overestimates the polarization below 3 keV when the gray filter is used, since the algorithm does not properly account for the response matrices at lower energies (Veledina et al. 2023; La Monaca et al. 2024a). Therefore, for this source, we computed the polarization properties in the 3–8 keV range, rather than in the full 2–8 keV band. IXPE detected significant polarization at 6.4σ significance in the 3–8 keV band, with a PD of 1.1% ± 0.2% and a PA of 11° ±4°, consistent with La Monaca et al. (2024a). The Stokes parameters q and u in the 3–8 keV energy range are shown in Fig. 4d. The polarization contours are reported in Fig. 5f: the PD slightly increases with energy up to 6 keV, while only an upper limit of 2.3% is obtained in the 6–8 keV range. This increasing trend with energy is highly significant at nearly 3σ confidence level, while the PA appears to remain constant with energy (Fig. 6f). During IXPE observation, the source moves along the NB and the FB (see Fig. 2d). In the NB, the measured PD is 0.8% ± 0.2% with a PA of 1° ±8° (at 3.4σ significance), while the PD is 1.3% ± 0.2% with a PA of 17° ±5° (at 5.7σ significance) along the FB. When comparing the polarization in the two branches, while the observed PD is consistent within the errors at the 90% confidence level, the PA appears to show a slight rotation of about 15° at the same confidence level.
Throughout the entire observation and across the different branches of the Z-track, the polarization is much lower than the results obtained by PolarLight during the high-flux state, with a PA misaligned with respect to the jet direction by ≈50° or ≈35° for the NB or the FB, respectively. However, the PolarLight observation was performed by integrating over an extensive exposure time (about 884 ks; Long et al. 2022), during which it was not possible to distinguish and separate the polarization of the individual Z-branches.
5.5. GX 340+0
IXPE observed GX 340+0 twice (La Monaca et al. 2024b; Bhargava et al. 2024a,b). The first observation, lasting approximately 100 ks, was performed with the source moving along the HB, with significant polarization detected at 11.1σ in the 2–8 keV (PD = 4.2% ± 0.4% and PA = 37° ±3°). During the second, longer observation (about 190 ks), the average polarization over the entire exposure is 1.4% ± 0.2% with PA of 37° ±5°, well constrained at 5.5σ. The normalized Stokes parameters computed with PCUBE are shown in Fig. 2e. During the first observation, the PA shows a significant rotation by about 30° between the first energy bin (i.e., 2–2.5 keV) and those at energies greater than 2.5 keV. The PD decreases between the two energy bins, from 5.3% ± 1.2% to 3.3% ± 0.4%, then increases with energy up to 8.0% ± 2.1% in the 7–8 keV energy bin (see Figs. 5g and 6g). Excluding the first energy bin, the increasing trend with energy observed above 2.5 keV is statistically significant at the 99.5% confidence level, while the PA appears to remain constant, with the exception of the 6–7 keV energy bin, where the Fe Kα line is also observed. In this bin, the PA exhibits a slight rotation compared to the others but is still consistent within the errors. During the second observation, the PD increases again with energy, up to 2.3% ± 0.8% in the 6–8 keV range. The increasing energy trend is statistically significant around the 95% confidence level. The PA does not show any significant rotation with energy (see Figs. 5h and 6h). For most of the exposure during this observation, GX 340+0 remains in the NB with a PD of 1.5% ± 0.3% and a PA of 36° ±5° at 5.4σ significance. As highlighted in Fig. 1e by the black interval, GX 340+0 also tracks part of the HB during this observation (Fig. 3e), but only an upper limit of 2.6% is obtained (see also Bhargava et al. 2024b). This upper limit is not consistent with the results from the first observation with the source in the HB. A possible reason for this discrepancy may be a different PD along the HB: during the first observation, the source spends most of the time in the upper left part of the HB (see Fig. 3e), while during the second, there is only a small excursion in that region, with most of the time spent in the right part of the HB. Therefore, it is possible that the harder region is more polarized than the softer region (see also Yu et al. 2025), for which we obtain only the upper limit, since the statistics are not sufficient to constrain the polarization. During the IXPE observations, GX 340+0 also tracks the FB rapidly: only an upper limit of 5.1% can be obtained for the FB, consistent with that found by Bhargava et al. (2024b). However, this upper limit is not very stringent and is also in line with all results obtained in the FB for other Z-sources.
5.6. GX 349+2
GX 349+2 was observed by IXPE for about 96 ks, while the source was mainly in the NB with two excursions in the FB. The last FB interval was identified using the simultaneous NuSTAR data (Fig. 2f), while the others at the beginning of the observation were selected due to the similarity of the IXPE flux behavior with that of the last FB interval. Considering the entire observation, IXPE detected significant polarization in the 2–8 keV band at 3.8σ significance with a PD of 1.1% ± 0.3% and a PA of 30° ±7°. The normalized Stokes parameters derived with PCUBE are shown in Fig. 4f. For this source, the polarization can also be constrained in the 2–4 keV and 4–8 keV energy ranges, as shown by the polarization contours in Fig. 5i. We also considered smaller energy bins (e.g. 2 keV bins), but the statistics in each bin were not sufficient to constrain the polarization. A slightly increasing PD with energy and a rotation of the PA of approximately 30° between the low and high energies are observed (see also Fig. 6i), similar to what was obtained during the second observation of GX 5–1. Moreover, we can compute the observation along the different branches separately: in the NB, the observed polarization is 1.0% ± 0.3% with a PA of 38° ±8° (at 3.3σ significance), while the PD reaches 2.1% ± 0.6% (at 3.1σ significance) when the source moves in the FB. Although the PD measured in the NB and FB is consistent within uncertainties at the 90% confidence level, the PA differs significantly between the two branches at the same confidence level, suggesting a rotation of the PA of approximately 30°.
6. Discussion
In this new analysis, we were able to constrain the polarization of Z-sources along the three different branches of their CCDs and HIDs. We summarize all the results for each source in each branch of the Z-track in Table 2 and Fig. 7. In Table 2 we report the value of the PA as measured directly by IXPE, which therefore depends on the orientation of the system. In Fig. 7 we “renormalize” the PA values with respect to that of the NB of each source, except for XTE J1701–462, for which the only significant PA measurement is in the HB and only upper limits are obtained in the NB and FB. We confirm the general trend already found for some sources, characterized by decreasing polarization as they moved from the HB to the NB (see also Cocchi et al. 2023; Fabiani et al. 2024). We were able to measure the polarization for most of the Z-sources also in the FB. Whereas only upper limits were for XTE J1701–462 and GX 340+0, for the other observed sources we found a qualitatively increasing trend of the PD moving from the NB to the FB (Table 2 and Fig. 7). Cyg X-2 exhibits the greatest variation among the Z-sources, from approximately 1.5% in the NB up to 4.2% in the short FB intervals, without any significant rotation in the PA. GX 5–1 is the only Z-source observed along the CCD with significant polarization detected in each branch: the highest polarization is reached along the HB (≈4%), the PD decreases to ≈2% in the NB and increases again in the FB up to ≈3%, while the PA remains similar between the different branches. Since in these sources the main contribution to the polarization comes from the hard Comptonization emission, the behavior of the polarization in the different branches may suggest a possible variation of the geometric configuration of the Comptonizing region along the Z-track. Slab-like configurations illuminated by the NS and the accretion disk are typically characterized by a PD that may be compatible with the results in the HB, but are too high for the NB (Gnarini et al. 2022, 2024). In contrast, more spherically symmetric configurations are generally low-polarized (Gnarini et al. 2022; Farinelli et al. 2024; Bobrikova et al. 2025) and do not reach the high PD observed in the HB or in the FB.
Polarization degree and angle for each source with the corresponding branch of the Z-track.
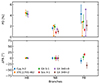 |
Fig. 7. Polarization for each Z-source as a function of the branch (see Table 2). The polarization angle is normalized to the NB value for all sources, except for XTE J1701–462, where the only PA measurement is in the HB. For Sco X-1, PD and PA are computed in the 3–8 keV range (see Sect. 5.4). Errors are at the 90% confidence level; upper limits are reported at the 99% confidence level for one interesting parameter. |
Therefore, there should be a change in the shape or dimension of the corona, e.g., considering a spreading or boundary layer-like geometry with different radial extension and latitudinal coverage of the NS surface as the source moves along its Z-track, varying its accretion rate. Unless there are significant spectral variations, either global or relative to individual components, detectable only through a model-dependent analysis, these polarization variations could suggest the presence of a switching mechanism for an efficient polarizer that is barely or not detectable through low-resolution spectroscopy but plays a crucial role in polarimetry. In this context, the presence of an outflowing wind could be a natural candidate. For example, Poutanen et al. (2023), to explain the high PD of Cyg X-1, which is difficult to reconcile with the source inclination angle, proposed a mechanism in which the inner hot flow is outflowing with a mildly relativistic velocity v/c ≳ 0.4. Although such a high velocity almost certainly cannot be achieved in NS-LXMB winds powered by Compton heating or magnetic driving (Allen et al. 2018), it remains true that regardless of the outflowing velocity, an optically thin wind in which photons undergo just a few scatterings could boost the polarization of the underlying system. However, a more precise evaluation of this effect requires a rather complex setup and has not yet been performed. Furthermore, unlike other Z-sources observed in the FB, Sco X-1 and GX 349+2 also show a rotation of the PA between the NB and the FB. In particular, while the rotation of about 15° is less significant (at the 90% confidence level) in the case of Sco X-1, GX 349+2 exhibits a significant rotation at the 99% confidence level of approximately 30° moving from the NB to the FB.
We also confirmed the general increasing trend of the PD with energy, already found in several NS-LXMBs, including Atoll sources (see also the review by Ursini et al. 2024). Moreover, some Z-sources (i.e., GX 340+0, GX 5–1, and GX 349+2) seem to exhibit a slight rotation of the PA between the lower and higher energy bins of approximately 30° (see also Figs. 5 and 6). This rotation of the PA with energy is not consistent with that expected considering special and general relativistic effects (Connors & Stark 1977; Connors et al. 1980; Ishihara et al. 1988; Schnittman & Krolik 2009, 2010). For a standard NS, depending on the geometric configuration and the inclination of the system, the rotation of the polarization plane due to relativistic effects should range between 5° −20°. Moreover, for axisymmetric systems, we expect that the two main spectral components, i.e., the soft thermal radiation and the hard Comptonized component, should be polarized either parallel or orthogonal to each other, depending on the geometry of the Comptonizing region; therefore, the expected rotation of the PA should be 90°. The observed rotation is lower, suggesting a possible misalignment between the NS spin axis and the accretion plane or a “tilted” inner region of the disk, breaking the symmetry of the system (Abarr & Krawczynski 2020). It is also worth noting that an energy-dependent PA rotation of less than 90° can arise as a convolutional effect of emission at different latitudes of a spreading layer. This has recently been shown by Bobrikova et al. (2025), who considered the case of rest-frame Chandrasekhar-like polarization with a latitudinal emission profile of the spreading layer brightness that is either uniform or follows an analytical law qualitatively matching the results of Inogamov & Sunyaev (1999). Interestingly, in the latter case, for a reliable set of parameters, a rotation of the angle up to 40° in the IXPE band can be achieved. However, it is important to note that this effect applies only to the spreading layer and must be combined with the contributions from both the accretion disk and reflection, meaning that the net observational result depends on the cross-normalization of each of these components.
7. Conclusions
The polarization properties of Z-sources are more complex than previously considered: while the HB is still the most polarized branch, exhibiting the highest PD in the entire 2–8 keV range among NS-LMXBs, the polarization first decreases along the NB and then appears to increase again in the FB. In particular, this increasing trend between the NB and FB is significant for Cyg X-2 and Sco X-1, while the PD value measured for GX 5–1 and GX 349+2 remain consistent at the 90% confidence level between the two branches. Moreover, the behavior of the PA as a function of the position along the Z-track is not unique: although some sources do not show a significant rotation of the PA moving along the different branches, Sco X-1 and GX 349+2 exhibit variations of the PA between the NB and FB at the 90% confidence level. This rotation of the PA, as well as that observed as a function of energy for some sources, is significantly lower than 90°, as would be expected for axisymmetric systems. Furthermore, the only two Z-sources (i.e., Cyg X-2 and Sco X-1) for which the orientation is known from the detection of the radio jet show two different behaviors: Cyg X-2 is characterized by a PA always aligned with the radio jet direction, similar to what is observed in other classes of X-ray accreting sources such as black hole binaries or AGNs. In contrast, the PA detected for Sco X-1 is always misaligned with respect to both the radio jet and the disk direction, likely suggesting a geometric configuration different from Cyg X-2 or a preceding radio jet.
The spectropolarimetric analysis in the upcoming second part of this work will shed new light on the results obtained so far for the Z-sources, as it will allow us to study the polarization of each spectral component describing the X-ray emission of these sources.
For GX 5–1, we used a fixed 60″ radius region to avoid the X-ray halo detected by Chandra (Smith et al. 2006; Clark 2018).
All the uncertainties in the text are reported at the 1σ confidence level.
All upper limits in the text are reported at the 99% confidence level.
Acknowledgments
This research was supported by the Italian Space Agency (Agenzia Spaziale Italiana, ASI) through the contract ASI-INAF-2022-19-HH.0 and by the Istituto Nazionale di Astrofisica (INAF) grant 1.05.23.05.06: “Spin and Geometry in accreting X-ray binaries: The first multi frequency spectro-polarimetric campaign”. This research used data products provided by the IXPE Team (MSFC, SSDC, INAF, and INFN) and distributed with additional software tools by the High-Energy Astrophysics Science Archive Research Center (HEASARC), at NASA Goddard Space Flight Center (GSFC). This work was supported in part by NASA through the NICER mission and the Astrophysics Explorers Program, together with the NuSTAR mission, a project led by the California Institute of Technology, managed by the Jet Propulsion Laboratory, and funded by the National Aeronautics and Space Administration. The NuSTAR Data Analysis Software (NUSTARDAS), jointly developed by the ASI Science Data Center (ASDC, Italy) and the California Institute of Technology (USA), has also been used in this project. This research has made use of data and/or software provided by the High Energy Astrophysics Science Archive Research Center (HEASARC), which is a service of the Astrophysics Science Division at NASA/GSFC.
References
- Abarr, Q., & Krawczynski, H. 2020, ApJ, 889, 111 [NASA ADS] [CrossRef] [Google Scholar]
- Agrawal, V. K., & Sreekumar, P. 2003, MNRAS, 346, 933 [Google Scholar]
- Allen, J. L., Schulz, N. S., Homan, J., et al. 2018, ApJ, 861, 26 [Google Scholar]
- Andrew, B. H., & Purton, C. R. 1968, Nature, 218, 855 [Google Scholar]
- Arnason, R. M., Papei, H., Barmby, P., Bahramian, A., & Gorski, M. D. 2021, MNRAS, 502, 5455 [NASA ADS] [CrossRef] [Google Scholar]
- Baldini, L., Bucciantini, N., Lalla, N. D., et al. 2022, SoftwareX, 19, 101194 [NASA ADS] [CrossRef] [Google Scholar]
- Berendsen, S. G. H., Fender, R., Kuulkers, E., Heise, J., & van der Klis, M. 2000, MNRAS, 318, 599 [NASA ADS] [CrossRef] [Google Scholar]
- Bhargava, Y., Ng, M., Zhang, L., et al. 2024a, ApJ, submitted [arXiv:2405.19324] [Google Scholar]
- Bhargava, Y., Russell, T. D., Ng, M., et al. 2024b, ApJ, submitted [arXiv:2411.00350] [Google Scholar]
- Bobrikova, A., Poutanen, J., & Loktev, V. 2025, A&A, 696, A181 [NASA ADS] [CrossRef] [EDP Sciences] [Google Scholar]
- Bradt, H., Naranan, S., Rappaport, S., & Spada, G. 1968, ApJ, 152, 1005 [Google Scholar]
- Byram, E. T., Chubb, T. A., & Friedman, H. 1966, AJ, 71, 379 [NASA ADS] [CrossRef] [Google Scholar]
- Cackett, E. M., Miller, J. M., Bhattacharyya, S., et al. 2008, ApJ, 674, 415 [NASA ADS] [CrossRef] [Google Scholar]
- Cackett, E. M., Miller, J. M., Homan, J., et al. 2009, ApJ, 690, 1847 [Google Scholar]
- Cackett, E. M., Miller, J. M., Ballantyne, D. R., et al. 2010, ApJ, 720, 205 [Google Scholar]
- Casares, J., Charles, P., & Kuulkers, E. 1998, ApJ, 493, L39 [Google Scholar]
- Chandra, A. D. 2022, ATel, 15594, 1 [Google Scholar]
- Church, M. J., Gibiec, A., Bałucińska-Church, M., & Jackson, N. K. 2012, A&A, 546, A35 [NASA ADS] [CrossRef] [EDP Sciences] [Google Scholar]
- Clark, G. W. 2018, ApJ, 852, 121 [NASA ADS] [CrossRef] [Google Scholar]
- Cocchi, M., Gnarini, A., Fabiani, S., et al. 2023, A&A, 674, L10 [NASA ADS] [CrossRef] [EDP Sciences] [Google Scholar]
- Connors, P. A., & Stark, R. F. 1977, Nat. Astron., 269, 128 [Google Scholar]
- Connors, P. A., Piran, T., & Stark, R. F. 1980, ApJ, 235, 224 [Google Scholar]
- Coughenour, B. M., Cackett, E. M., Miller, J. M., & Ludlam, R. M. 2018, ApJ, 867, 64 [CrossRef] [Google Scholar]
- Cowley, A. P., Crampton, D., & Hutchings, J. B. 1979, ApJ, 231, 539 [NASA ADS] [CrossRef] [Google Scholar]
- D’Aì, A., Iaria, R., Di Salvo, T., Matt, G., & Robba, N. R. 2009, ApJ, 693, L1 [CrossRef] [Google Scholar]
- D’Amico, F., Heindl, W. A., Rothschild, R. E., & Gruber, D. E. 2001, ApJ, 547, L147 [CrossRef] [Google Scholar]
- Di Marco, A., Soffitta, P., Costa, E., et al. 2023, AJ, 165, 143 [CrossRef] [Google Scholar]
- Di Salvo, T., Robba, N. R., Iaria, R., et al. 2001, ApJ, 554, 49 [NASA ADS] [CrossRef] [Google Scholar]
- Di Salvo, T., Farinelli, R., Burderi, L., et al. 2002, A&A, 386, 535 [NASA ADS] [CrossRef] [EDP Sciences] [Google Scholar]
- Di Salvo, T., Goldoni, P., Stella, L., et al. 2006, ApJ, 649, L91 [NASA ADS] [CrossRef] [Google Scholar]
- Fabiani, S., Capitanio, F., Iaria, R., et al. 2024, A&A, 684, A137 [NASA ADS] [CrossRef] [EDP Sciences] [Google Scholar]
- Farinelli, R., Paizis, A., Landi, R., & Titarchuk, L. 2009, A&A, 498, 509 [NASA ADS] [CrossRef] [EDP Sciences] [Google Scholar]
- Farinelli, R., Fabiani, S., Poutanen, J., et al. 2023, MNRAS, 519, 3681 [NASA ADS] [CrossRef] [Google Scholar]
- Farinelli, R., Waghmare, A., Ducci, L., & Santangelo, A. 2024, A&A, 684, A62 [NASA ADS] [CrossRef] [EDP Sciences] [Google Scholar]
- Fender, R. P., & Hendry, M. A. 2000, MNRAS, 317, 1 [NASA ADS] [CrossRef] [Google Scholar]
- Ferrazzoli, R., Muleri, F., Lefevre, C., et al. 2020, J. Astron. Telesc. Instrum. Syst., 6, 048002 [Google Scholar]
- Fomalont, E. B., Geldzahler, B. J., & Bradshaw, C. F. 2001a, ApJ, 553, L27 [NASA ADS] [CrossRef] [Google Scholar]
- Fomalont, E. B., Geldzahler, B. J., & Bradshaw, C. F. 2001b, ApJ, 558, 283 [Google Scholar]
- Frank, J., King, A. R., & Lasota, J. P. 1987, A&A, 178, 137 [NASA ADS] [Google Scholar]
- Friedman, H., Byram, E. T., & Chubb, T. A. 1967, Science, 156, 374 [NASA ADS] [CrossRef] [Google Scholar]
- Gambino, A. F., Iaria, R., Di Salvo, T., et al. 2016, A&A, 589, A34 [NASA ADS] [CrossRef] [EDP Sciences] [Google Scholar]
- Gendreau, K. C., Arzoumanian, Z., Adkins, P. W., et al. 2016, Proc. SPIE, 9905, 99051H [NASA ADS] [CrossRef] [Google Scholar]
- Giacconi, R., Gursky, H., Paolini, F. R., & Rossi, B. B. 1962, Phys. Rev. Lett., 9, 439 [NASA ADS] [CrossRef] [Google Scholar]
- Gilfanov, M., Churazov, E., Sunyaev, R., et al. 1993, ApJ, 418, 844 [NASA ADS] [CrossRef] [Google Scholar]
- Gnarini, A., Ursini, F., Matt, G., et al. 2022, MNRAS, 514, 2561 [NASA ADS] [CrossRef] [Google Scholar]
- Gnarini, A., Lynne Saade, M., Ursini, F., et al. 2024, A&A, 690, A230 [NASA ADS] [CrossRef] [EDP Sciences] [Google Scholar]
- Grimm, H. J., Gilfanov, M., & Sunyaev, R. 2002, A&A, 391, 923 [NASA ADS] [CrossRef] [EDP Sciences] [Google Scholar]
- Harrison, F. A., Craig, W. W., Christensen, F. E., et al. 2013, ApJ, 770, 103 [Google Scholar]
- Hasinger, G., & van der Klis, M. 1989, A&A, 225, 79 [NASA ADS] [Google Scholar]
- Homan, J., Belloni, T., van der Klis, M., et al. 2006, ATel, 725, 1 [Google Scholar]
- Homan, J., Belloni, T., Wijnands, R., et al. 2007a, ATel, 1144, 1 [NASA ADS] [Google Scholar]
- Homan, J., Wijnands, R., Altamirano, D., & Belloni, T. 2007b, ATel, 1165, 1 [Google Scholar]
- Homan, J., van der Klis, M., Fridriksson, J. K., et al. 2010, ApJ, 719, 201 [NASA ADS] [CrossRef] [Google Scholar]
- Homan, J., Steiner, J. F., Lin, D., et al. 2018, ApJ, 853, 157 [NASA ADS] [CrossRef] [Google Scholar]
- Iaria, R., Di Salvo, T., Robba, N. R., et al. 2004, ApJ, 600, 358 [NASA ADS] [CrossRef] [Google Scholar]
- Iaria, R., D’Aí, A., di Salvo, T., et al. 2009, A&A, 505, 1143 [NASA ADS] [CrossRef] [EDP Sciences] [Google Scholar]
- Inogamov, N. A., & Sunyaev, R. A. 1999, Astron. Lett., 25, 269 [NASA ADS] [Google Scholar]
- Ishihara, H., Takahashi, M., & Tomimatsu, A. 1988, Phys. Rev. D, 38, 472 [Google Scholar]
- Iwakiri, W., Serino, M., Negoro, H., et al. 2022, ATel, 15592, 1 [NASA ADS] [Google Scholar]
- Jonker, P. G., Fender, R. P., Hambly, N. C., & van der Klis, M. 2000a, MNRAS, 315, L57 [CrossRef] [Google Scholar]
- Jonker, P. G., van der Klis, M., Wijnands, R., et al. 2000b, ApJ, 537, 374 [Google Scholar]
- Kashyap, U., Chakraborty, M., Bhattacharyya, S., & Ram, B. 2023, MNRAS, 523, 2788 [Google Scholar]
- Kuulkers, E., & van der Klis, M. 1996, A&A, 314, 567 [NASA ADS] [Google Scholar]
- Kuulkers, E., & van der Klis, M. 1998, A&A, 332, 845 [NASA ADS] [Google Scholar]
- Kuulkers, E., van der Klis, M., Oosterbroek, T., et al. 1994, A&A, 289, 795 [NASA ADS] [Google Scholar]
- Kuulkers, E., Parmar, A. N., Owens, A., Oosterbroek, T., & Lammers, U. 1997, A&A, 323, L29 [Google Scholar]
- La Monaca, F., Di Marco, A., Poutanen, J., et al. 2024a, ApJ, 960, L11 [NASA ADS] [CrossRef] [Google Scholar]
- La Monaca, F., Di Marco, A., Ludlam, R. M., et al. 2024b, A&A, 691, A253 [NASA ADS] [CrossRef] [EDP Sciences] [Google Scholar]
- Lin, D., Altamirano, D., Homan, J., et al. 2009a, ApJ, 699, 60 [Google Scholar]
- Lin, D., Remillard, R. A., & Homan, J. 2009b, ApJ, 696, 1257 [NASA ADS] [CrossRef] [Google Scholar]
- Long, K. S., Chanan, G. A., Ku, W. H. M., & Novick, R. 1979, ApJ, 232, L107 [NASA ADS] [CrossRef] [Google Scholar]
- Long, X., Feng, H., Li, H., et al. 2022, ApJ, 924, L13 [NASA ADS] [CrossRef] [Google Scholar]
- Ludlam, R. M. 2024, Ap&SS, 369, 16 [NASA ADS] [CrossRef] [Google Scholar]
- Ludlam, R. M., Cackett, E. M., García, J. A., et al. 2022, ApJ, 927, 112 [NASA ADS] [CrossRef] [Google Scholar]
- Mazzola, S. M., Iaria, R., Di Salvo, T., et al. 2021, A&A, 654, A102 [NASA ADS] [CrossRef] [EDP Sciences] [Google Scholar]
- Migliari, S., & Fender, R. P. 2006, MNRAS, 366, 79 [CrossRef] [Google Scholar]
- Mitsuda, K., Inoue, H., Koyama, K., et al. 1984, PASJ, 36, 741 [NASA ADS] [Google Scholar]
- Mitsuda, K., Inoue, H., Nakamura, N., & Tanaka, Y. 1989, PASJ, 41, 97 [NASA ADS] [Google Scholar]
- Mondal, A. S., Dewangan, G. C., Pahari, M., & Raychaudhuri, B. 2018, MNRAS, 474, 2064 [NASA ADS] [CrossRef] [Google Scholar]
- Muleri, F. 2022, Handbook of X-ray and Gamma-ray Astrophysics (Singapore: Springer Nature), 6 [Google Scholar]
- Oosterbroek, T., Lewin, W. H. G., van Paradijs, J., et al. 1994, A&A, 281, 803 [NASA ADS] [Google Scholar]
- Orosz, J. A., & Kuulkers, E. 1999, MNRAS, 305, 132 [Google Scholar]
- Paizis, A., Farinelli, R., Titarchuk, L., et al. 2006, A&A, 459, 187 [NASA ADS] [CrossRef] [EDP Sciences] [Google Scholar]
- Penninx, W. 1989, ESA Spec. Publ., 1, 185 [Google Scholar]
- Penninx, W., Zwarthoed, G. A. A., van Paradijs, J., et al. 1993, A&A, 267, 92 [NASA ADS] [Google Scholar]
- Piconcelli, E., Jimenez-Bailón, E., Guainazzi, M., et al. 2004, MNRAS, 351, 161 [Google Scholar]
- Poutanen, J., Veledina, A., & Beloborodov, A. M. 2023, ApJ, 949, L10 [NASA ADS] [CrossRef] [Google Scholar]
- Rappaport, S., Zaumen, W., Doxsey, R., & Mayer, W. 1971, ApJ, 169, L93 [NASA ADS] [CrossRef] [Google Scholar]
- Remillard, R. A., Lin, D., ASM Team at MIT,& NASA/GSFC 2006, ATel, 696, 1 [NASA ADS] [Google Scholar]
- Ross, R. R., Fabian, A. C., & Young, A. J. 1999, MNRAS, 306, 461 [NASA ADS] [CrossRef] [Google Scholar]
- Sanna, A., Méndez, M., Altamirano, D., et al. 2010, MNRAS, 408, 622 [NASA ADS] [CrossRef] [Google Scholar]
- Schnittman, J. D., & Krolik, J. H. 2009, ApJ, 701, 1175 [CrossRef] [Google Scholar]
- Schnittman, J. D., & Krolik, J. H. 2010, ApJ, 712, 908 [NASA ADS] [CrossRef] [Google Scholar]
- Seifina, E., Titarchuk, L., & Frontera, F. 2013, ApJ, 766, 63 [NASA ADS] [CrossRef] [Google Scholar]
- Smale, A. P. 1998, ApJ, 498, L141 [NASA ADS] [CrossRef] [Google Scholar]
- Smale, A. P., Done, C., Mushotzky, R. F., et al. 1993, ApJ, 410, 796 [Google Scholar]
- Smith, R. K., Dame, T. M., Costantini, E., & Predehl, P. 2006, ApJ, 648, 452 [CrossRef] [Google Scholar]
- Soffitta, P., Baldini, L., Bellazzini, R., et al. 2021, AJ, 162, 208 [CrossRef] [Google Scholar]
- Spencer, R. E., Rushton, A. P., Bałucińska-Church, M., et al. 2013, MNRAS, 435, L48 [NASA ADS] [CrossRef] [Google Scholar]
- Sunyaev, R., Churazov, E., Gilfanov, M., et al. 1991, A&A, 247, L29 [Google Scholar]
- Thomas, N. T., Jirawala, K., Gudennavar, S. B., & Bubbly, S. G. 2024, MNRAS, 531, 2237 [Google Scholar]
- Titarchuk, L., Seifina, E., & Shrader, C. 2014, ApJ, 789, 98 [NASA ADS] [CrossRef] [Google Scholar]
- Ueda, Y., Mitsuda, K., Murakami, H., & Matsushita, K. 2005, ApJ, 620, 274 [NASA ADS] [CrossRef] [Google Scholar]
- Ursini, F., Gnarini, A., Capitanio, F., et al. 2024, Galaxies, 12, 43 [NASA ADS] [CrossRef] [Google Scholar]
- van der Klis, M. 1989, ARA&A, 27, 517 [NASA ADS] [CrossRef] [Google Scholar]
- van der Klis, M. 1995, Camb. Astrophys. Ser., 26, 252 [Google Scholar]
- van Paradijs, J., Allington-Smith, J., Callanan, P., et al. 1990, A&A, 235, 156 [Google Scholar]
- Veledina, A., Muleri, F., Dovčiak, M., et al. 2023, ApJ, 958, L16 [NASA ADS] [CrossRef] [Google Scholar]
- Vrtilek, S. D., Kahn, S. M., Grindlay, J. E., Helfand, D. J., & Seward, F. D. 1986, ApJ, 307, 698 [Google Scholar]
- Wang, Y. N., Lei, Y. J., Ding, G. Q., et al. 2014, MNRAS, 440, 3726 [Google Scholar]
- Weisskopf, M. C., Soffitta, P., Baldini, L., et al. 2022, JATIS, 8, 1 [Google Scholar]
- White, N. E., Stella, L., & Parmar, A. N. 1988, ApJ, 324, 363 [NASA ADS] [CrossRef] [Google Scholar]
- Yu, W., Bu, Q., Doroshenko, V., et al. 2025, A&A, 695, A108 [NASA ADS] [CrossRef] [EDP Sciences] [Google Scholar]
- Zhao, Q., Li, H., Tao, L., & Feng, H. 2024, ApJ, submitted [arXiv:2411.11352] [Google Scholar]
All Tables
Polarization degree and angle for each source with the corresponding branch of the Z-track.
All Figures
|
Fig. 1. IXPE, NuSTAR, and NICER light curves (count s−1) of each source. The second and fourth rows in each panel show the IXPE hard color (5–8 keV/3–5 keV) and the NuSTAR hard color (10–20 keV/6–10 keV), respectively. Open circles indicate data points not simultaneous with IXPE observation. Blue and red regions correspond to the HB and FB, respectively (see also Sects. 4 and 5 for more details). Time bins of 200 s were used for IXPE and NuSTAR, and 50 s for NICER. (a) Cyg X-2. (b) XTE J1701–462. (c) GX 5–1. (d) Sco X-1. (e) GX 340+0. (f) GX 349+2. |
| In the text | |
|
Fig. 2. CCDs or HIDs using the NuSTAR observations (Table 1) of each source. The soft and hard colors are defined as the ratio of the counts in the 6–10 keV/3–6 keV and 10–20 keV/6–10 keV bands, respectively. The three branches are highlighted with different colors. We considered time bins of 200 s. (a) Cyg X-2. (b) XTE J1701–462. (c) GX 5–1. (d) Sco X-1. (e) GX 340+0. (f) GX 349+2. |
| In the text | |
|
Fig. 3. CCDs of each source using the IXPE observations (Table 1). The soft and hard colors are defined as the ratio of the counts in the 3–5 keV/2–3 keV and 5–8 keV/3–5 keV bands, respectively. Different colors correspond to different observation of the source. Each bin corresponds to 1000 s. (a) Cyg X-2. (b) XTE J1701–462. (c) GX 5–1. (d) Sco X-1. (e) GX 340+0. (f) GX 349+2. |
| In the text | |
|
Fig. 4. 3D loops traced from the solution of the NLFFF extrapolation at 04:12 UT (left panel) and 22:00 UT (right panel), overplotted on the HMI magnetogram. The colour code of the loops is scaled with the height of the loops: red shows the footpoints and blue shows the highest point of the loops. |
| In the text | |
|
Fig. 5. Polarization contours at the 68%, 90%, and 99% confidence levels, computed using Eq. (32) of Muleri (2022). Different colors correspond to different energy bins. For Cyg X-2 and Sco X-1, the gray region corresponds to the jet direction. (a) Cyg X-2. (b) XTE J1701–462 (Obs. I). (c) XTE J1701–462 (Obs. II). (d) GX 5–1 (Obs. I). (e) GX 5–1 (Obs. II). (f) Sco X-1. (g) GX 340+0 (Obs. I). (h) GX 340+0 (Obs. II). (i) GX 349+2. |
| In the text | |
|
Fig. 6. Polarization degree and angle as a function of energy. Errors are at 1σ confidence level, while upper limits correspond to the 99% confidence level. Blue lines show linear fits to the PD data, with resulting p-values. Gray points represent the PAs corresponding to the PD upper limits. Orange lines indicate the average PAs in the 2–8 keV range, with associated 1σ error highlighted by the orange regions. (a) Cyg X-2. (b) XTE J1701–462 (Obs. I). (c) XTE J1701–462 (Obs. II). (d) GX 5–1 (Obs. I). (e) GX 5–1 (Obs. II). (f) Sco X-1. (g) GX 340+0 (Obs. I). (h) GX 340+0 (Obs. II). (i) GX 349+2. |
| In the text | |
|
Fig. 7. Polarization for each Z-source as a function of the branch (see Table 2). The polarization angle is normalized to the NB value for all sources, except for XTE J1701–462, where the only PA measurement is in the HB. For Sco X-1, PD and PA are computed in the 3–8 keV range (see Sect. 5.4). Errors are at the 90% confidence level; upper limits are reported at the 99% confidence level for one interesting parameter. |
| In the text | |
Current usage metrics show cumulative count of Article Views (full-text article views including HTML views, PDF and ePub downloads, according to the available data) and Abstracts Views on Vision4Press platform.
Data correspond to usage on the plateform after 2015. The current usage metrics is available 48-96 hours after online publication and is updated daily on week days.
Initial download of the metrics may take a while.