Fig. 1.
Download original image
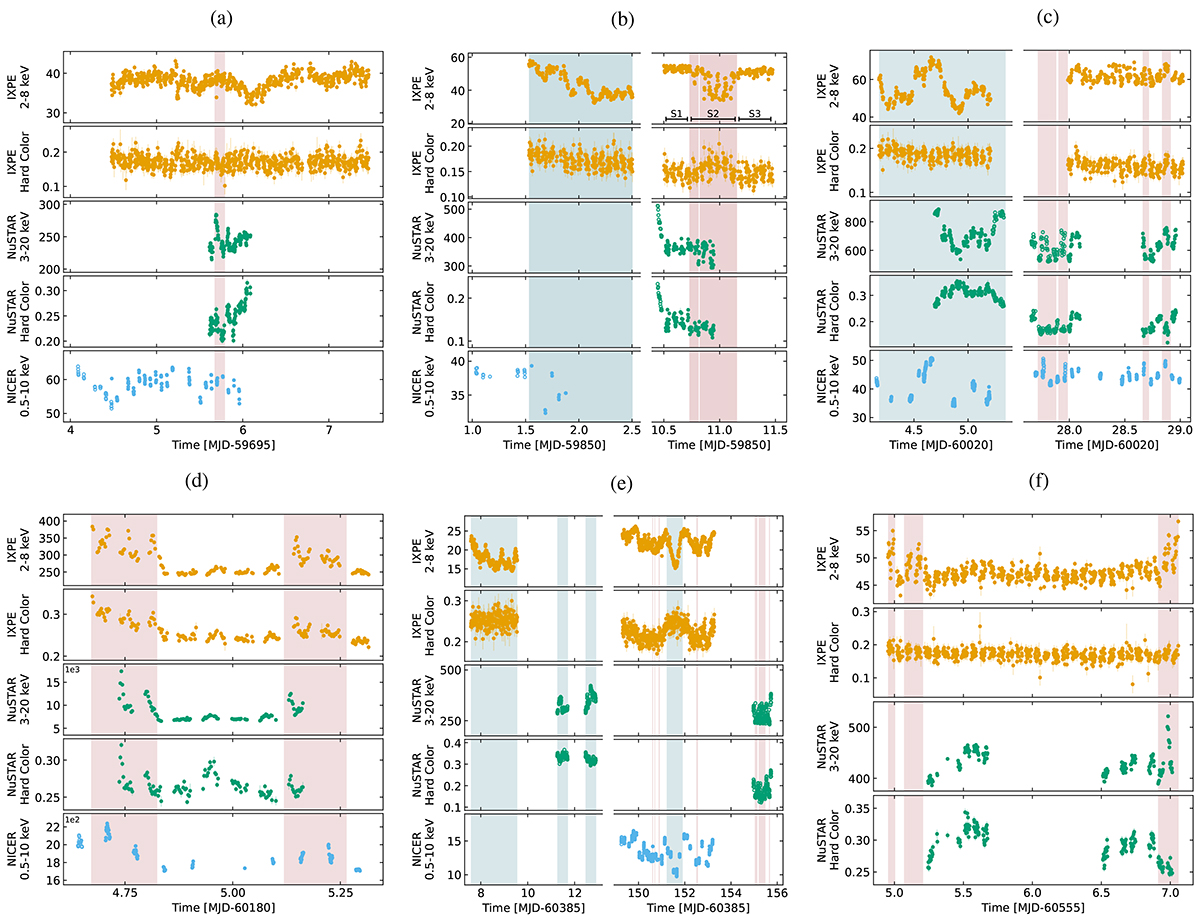
IXPE, NuSTAR, and NICER light curves (count s−1) of each source. The second and fourth rows in each panel show the IXPE hard color (5–8 keV/3–5 keV) and the NuSTAR hard color (10–20 keV/6–10 keV), respectively. Open circles indicate data points not simultaneous with IXPE observation. Blue and red regions correspond to the HB and FB, respectively (see also Sects. 4 and 5 for more details). Time bins of 200 s were used for IXPE and NuSTAR, and 50 s for NICER. (a) Cyg X-2. (b) XTE J1701–462. (c) GX 5–1. (d) Sco X-1. (e) GX 340+0. (f) GX 349+2.
Current usage metrics show cumulative count of Article Views (full-text article views including HTML views, PDF and ePub downloads, according to the available data) and Abstracts Views on Vision4Press platform.
Data correspond to usage on the plateform after 2015. The current usage metrics is available 48-96 hours after online publication and is updated daily on week days.
Initial download of the metrics may take a while.