| Issue |
A&A
Volume 674, June 2023
|
|
|---|---|---|
| Article Number | L10 | |
| Number of page(s) | 7 | |
| Section | Letters to the Editor | |
| DOI | https://doi.org/10.1051/0004-6361/202346275 | |
| Published online | 19 June 2023 | |
Letter to the Editor
Discovery of strongly variable X-ray polarization in the neutron star low-mass X-ray binary transient XTE J1701−462
1
INAF Osservatorio Astronomico di Cagliari, Via della Scienza 5, 09047 Selargius, CA, Italy
e-mail: This email address is being protected from spambots. You need JavaScript enabled to view it.
2
Dipartimento di Matematica e Fisica, Università degli Studi Roma Tre, Via della Vasca Navale 84, 00146 Roma, Italy
3
INAF Istituto di Astrofisica e Planetologia Spaziali, Via del Fosso del Cavaliere 100, 00133 Roma, Italy
4
Department of Physics and Astronomy, University of Turku, 20014 Turku, Finland
5
INAF Osservatorio di Astrofisica e Scienza dello Spazio di Bologna, Via P. Gobetti 101, 40129 Bologna, Italy
6
INAF IASF-Milano, Via Alfonso Corti 12, 20133 Milano, Italy
7
School of Mathematics, Statistics, and Physics, Newcastle University, Newcastle upon Tyne, NE1 7RU
UK
8
Serco for the European Space Agency (ESA), European Space Astronomy Centre, Camino Bajo del Castillo s/n, 28692 Villanueva de la Cañada, Madrid, Spain
9
International Space Science Institute (ISSI), Hallerstrasse 6, 3012 Bern, Switzerland
10
Mullard Space Science Laboratory, University College London, Holmbury St Mary, Dorking, Surrey, RH5 6NT
UK
11
Instituto de Astrofísicade Andalucía – CSIC, Glorieta de la Astronomía s/n, 18008 Granada, Spain
12
INAF Osservatorio Astronomico di Roma, Via Frascati 33, 00040 Monte Porzio Catone, RM, Italy
13
Space Science Data Center, Agenzia Spaziale Italiana, Via del Politecnico snc, 00133 Roma, Italy
14
Istituto Nazionale di Fisica Nucleare, Sezione di Pisa, Largo B. Pontecorvo 3, 56127 Pisa, Italy
15
Dipartimento di Fisica, Università di Pisa, Largo B. Pontecorvo 3, 56127 Pisa, Italy
16
NASA Marshall Space Flight Center, Huntsville, AL, 35812
USA
17
Istituto Nazionale di Fisica Nucleare, Sezione di Torino, Via Pietro Giuria 1, 10125 Torino, Italy
18
Dipartimento di Fisica, Università degli Studi di Torino, Via Pietro Giuria 1, 10125 Torino, Italy
19
INAF Osservatorio Astrofisico di Arcetri, Largo Enrico Fermi 5, 50125 Firenze, Italy
20
Dipartimento di Fisica e Astronomia, Università degli Studi di Firenze, Via Sansone 1, 50019 Sesto Fiorentino, FI, Italy
21
Istituto Nazionale di Fisica Nucleare, Sezione di Firenze, Via Sansone 1, 50019 Sesto Fiorentino, (FI), Italy
22
Agenzia Spaziale Italiana, Via del Politecnico snc, 00133 Roma, Italy
23
Science and Technology Institute, Universities Space Research Association, Huntsville, AL, 35805
USA
24
Istituto Nazionale di Fisica Nucleare, Sezione di Roma “Tor Vergata”, Via della Ricerca Scientifica 1, 00133 Roma, Italy
25
Department of Physics and Kavli Institute for Particle Astrophysics and Cosmology, Stanford University, Stanford, CA, 94305
USA
26
Institut für Astronomie und Astrophysik, Universität Tübingen, Sand 1, 72076 Tübingen, Germany
27
Astronomical Institute of the Czech Academy of Sciences, Boní II 1401/1, 14100 Praha 4, Czech Republic
28
RIKEN Cluster for Pioneering Research, 2-1 Hirosawa, Wako, Saitama, 351-0198
Japan
29
California Institute of Technology, Pasadena, CA, 91125
USA
30
Yamagata University, 1-4-12 Kojirakawa-machi, Yamagata-shi, 990-8560
Japan
31
Osaka University, 1-1 Yamadaoka, Suita, Osaka, 565-0871
Japan
32
University of British Columbia, Vancouver, BC, V6T 1Z4
Canada
33
International Center for Hadron Astrophysics, Chiba University, Chiba, 263-8522
Japan
34
Institute for Astrophysical Research, Boston University, 725 Commonwealth Avenue, Boston, MA, 02215
USA
35
Department of Astrophysics, St. Petersburg State University, Universitetsky pr. 28, Petrodvoretz, 198504 St. Petersburg, Russia
36
Department of Physics and Astronomy and Space Science Center, University of New Hampshire, Durham, NH, 03824
USA
37
Physics Department and McDonnell Center for the Space Sciences, Washington University in St. Louis, St. Louis, MO, 63130
USA
38
Finnish Centre for Astronomy with ESO, 20014 University of Turku, Finland
39
Istituto Nazionale di Fisica Nucleare, Sezione di Napoli, Strada Comunale Cinthia, 80126 Napoli, Italy
40
Université de Strasbourg, CNRS, Observatoire Astronomique de Strasbourg, UMR 7550, 67000 Strasbourg, France
41
MIT Kavli Institute for Astrophysics and Space Research, Massachusetts Institute of Technology, 77 Massachusetts Avenue, Cambridge, MA, 02139
USA
42
Graduate School of Science, Division of Particle and Astrophysical Science, Nagoya University, Furo-cho, Chikusa-ku, Nagoya, Aichi, 464-8602
Japan
43
Hiroshima Astrophysical Science Center, Hiroshima University, 1-3-1 Kagamiyama, Higashi-Hiroshima, Hiroshima, 739-8526
Japan
44
University of Maryland, Baltimore County, Baltimore, MD, 21250
USA
45
NASA Goddard Space Flight Center, Greenbelt, MD, 20771
USA
46
Center for Research and Exploration in Space Science and Technology, NASA/GSFC, Greenbelt, MD, 20771
USA
47
Department of Physics, University of Hong Kong, Pokfulam, Hong Kong
48
Department of Astronomy and Astrophysics, Pennsylvania State University, University Park, PA, 16801
USA
49
Université Grenoble Alpes, CNRS, IPAG, 38000 Grenoble, France
50
Center for Astrophysics, Harvard & Smithsonian, 60 Garden St, Cambridge, MA, 02138
USA
51
INAF Osservatorio Astronomico di Brera, Via E. Bianchi 46, 23807 Merate, LC, Italy
52
Dipartimento di Fisica e Astronomia, Università degli Studi di Padova, Via Marzolo 8, 35131 Padova, Italy
53
Dipartimento di Fisica, Università degli Studi di Roma “Tor Vergata”, Via della Ricerca Scientifica 1, 00133 Roma, Italy
54
Department of Astronomy, University of Maryland, College Park, MD, 20742
USA
55
Anton Pannekoek Institute for Astronomy & GRAPPA, University of Amsterdam, Science Park 904, 1098 XH Amsterdam, The Netherlands
56
Guangxi Key Laboratory for Relativistic Astrophysics, School of Physical Science and Technology, Guangxi University, Nanning, 530004
PR China
Received:
28
February
2023
Accepted:
15
May
2023
Abstract
Context. After about 16 years since its first outburst, the transient neutron star low-mass X-ray binary XTE J1701−462 turned on again in September 2022, allowing for the first study of its X-ray polarimetric characteristics by a dedicated observing program with the Imaging X-ray Polarimeter Explorer (IXPE).
Aims. Polarimetric studies of XTE J1701−462 have been expected to improve our understanding of accreting weakly magnetized neutron stars, in particular, the physics and the geometry of the hot inner regions close to the compact object.
Methods. The IXPE data of two triggered observations were analyzed using time-resolved spectroscopic and polarimetric techniques, following the source along its Z-track of the color–color diagram.
Results. During the first pointing on 2022 September 29, an average 2–8 keV polarization degree of (4.6 ± 0.4)% was measured, the highest value found up to now for this class of sources. Conversely, only a ∼0.6% average degree was obtained during the second pointing ten days later.
Conclusions. The polarimetric signal appears to be strictly related to the higher energy blackbody component associated with the boundary layer (BL) emission and its reflection from the inner accretion disk, and it is as strong as 6.1% and 1.2% (> 95% significant) above 3–4 keV for the two measurements, respectively. The variable polarimetric signal is apparently related to the spectral characteristics of XTE J1701−462, which is the strongest when the source was in the horizontal branch of its Z-track and the weakest in the normal branch. These IXPE results provide new important observational constraints on the physical models and geometry of the Z-sources. Here, we discuss the possible reasons for the presence of strong and variable polarization among these sources.
Key words: accretion, accretion disks / polarization / stars: neutron / stars: individual: XTE J1701−462 / X-rays: binaries
Deceased.
© The Authors 2023
 Open Access article, published by EDP Sciences, under the terms of the Creative Commons Attribution License (https://creativecommons.org/licenses/by/4.0), which permits unrestricted use, distribution, and reproduction in any medium, provided the original work is properly cited.
This article is published in open access under the Subscribe to Open model. This email address is being protected from spambots. You need JavaScript enabled to view it. to support open access publication.
1. Introduction
The successful launch in December 2021 of the Imaging X-ray Polarimetry Explorer (IXPE, Weisskopf et al. 2022; Soffitta et al. 2021) opened a new investigation territory for the astrophysics of several classes of X-ray astronomical objects. In particular, three persistent neutron star low-mass X-ray binaries (NS-LMXBs) were already targeted by IXPE during its 2022 campaign, namely, the Z-class source Cyg X-2 and two bright soft-state Atoll-sources, GS 1826−238 and GX 9+9. These classes are dubbed after the shape of their X-ray observed hard color versus soft color diagrams (CCDs, see, e.g., Hasinger & van der Klis 1989; van der Klis 1995). Cyg X-2 (Farinelli et al. 2023) and GX 9+9 (Chatterjee et al. 2023; Ursini et al. 2023) have shown a significant linearly polarized component (with the polarization degree, PD, of ∼2%).
XTE J1701−462 can be regarded as a rather unique object and is the first transient NS-LMXB to be observed by IXPE’s modern, sensitive X-ray polarimeters. Discovered at the beginning of its 2006 outburst (Remillard & Lin 2006), the source was soon identified as the seventh Z-source, the first one transient in its nature (Homan et al. 2006a, 2007b). It also showed kilohertz quasi-periodic oscillations in the RXTE/PCA data (Homan et al. 2006b, 2010; Sanna et al. 2010) during its Z and atoll (lower banana) phases. A variable radio counterpart to the X-ray source was identified by Fender et al. (2007) along with a very large-scale jet-like multi-blob structure, ∼2′–3′ south of the central object, first considered to be connected to a past, unobserved, activity of XTE J1701−462, but recently considered unrelated to the source (Gasealahwe et al. 2023). The 2006 outburst lasted for a remarkably long time of ∼600 d (Lin et al. 2009), showing an irregular light curve, especially during the long decaying phase (Šimon 2015).
The peculiarity of XTE J1701−462 is characterized by the fact that is has experienced all the known spectral states of the NS-LMXB during the 2006 outburst (Lin et al. 2009). In the high-soft state (HSS), it was observed in all three Z-branches (horizontal, normal, and flaring branches: HB, NB, and FB). Moreover, the source exhibited the typical transient hard tail (THT) usually observed in the HB of the Z-sources (Paizis et al. 2006). Then, XTE J1701−462 evolved (Homan et al. 2007a) into a bright soft Atoll source in the Banana spectral state and finally transitioned into a low-hard Atoll Island state. Up until now, XTE J1701−462 is the only source to have displayed the NS-LMXB complete spectral evolution, also showing the THT spectral component. This has enabled studies of the physics of different accretion states using timing and spectroscopy in an object-unbiased manner.
Though the NS nature of the compact object in XTE J1701−462 was already well established, the detection of two type-I X-ray bursts (Lewin et al. 1993) at the very end of the outburst (Lin et al. 2009) when the source was in its Island state, was the most solid confirmation. The bursts had radius expansion characteristics (Lin et al. 2007) and led to the distance determination of ∼8.8 kpc, using the burst peak luminosity as a standard candle (Kuulkers et al. 2003).
A couple of years after its return to quiescence, renewed activity of XTE J1701−462 was claimed in 2010 by Krimm et al. (2010) using the Swift/BAT data, but not confirmed by Homan et al. (2010). XTE J1701−462 turned on again in September 2022 (Iwakiri et al. 2022), about 16 yr after its first outburst and about nine months after the beginning of the IXPE space operations. The 2022 outburst looks different in shape and is less luminous than the 2006 one (see Fig. 1). According to the MAXI light-curve, the source could have returned to quiescence after ∼200 days. For this second outburst, the X-ray polarimetry is a new important tool to study this NS-LMXB in a unprecedented way. In the following sections, we present and discuss the results of the XTE J1701−462 IXPE campaign.
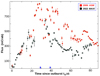 |
Fig. 1. 2022 (black) and 2006 (red) outburst light curves of XTE J1701−462. The starting time t0 are MJD 53731.5 and MJD 59824.5 for 2006 and 2022, respectively. In the instruments’ full energy range, 1 Crab is 75 c s−1 for RXTE/ASM and 3.8 c s−1 for MAXI. The blue ticks on the abscissa indicate the epochs of the two IXPE observations (no MAXI data exist during Obs. 1). |
2. IXPE observations and data analysis
The X-ray polarimeter IXPE (Weisskopf et al. 2022; Soffitta et al. 2021) targeted XTE J1701−462 about 23 days after the MAXI observed onset of the 2022 outburst on September 6 (Iwakiri et al. 2022). IXPE provided high-sensitivity timing, imaging, spectroscopic, and polarimetric of XTE J1701−462 in the 2–8 keV band. Two observations (Obs. 1 and 2) were performed on 2022 Sept. 29–30 and Oct. 8–9 with the nominal exposure of 50 ks each. All the three IXPE detector units (DUs) were fully operational, yielding net exposures of 47.7 ks (DU1, DU2) and 47.2 ks (DU3) for Obs. 1 and 48.1 ks (DU1) and 48.0 ks (DU2,3) for Obs. 2.
Data reduction and analysis were performed using the IXPEOBSSIM software v30.0.1 (Baldini et al. 2022) and HEASOFT package version 6.31.1 (Nasa 2014). The data were filtered by the IXPEOBSSIM tools xpselect and binned with xpbin to produce images and Stokes I, Q, and U spectra suitable for spectro-polarimetric analysis with XSPEC. We used the latest (version 12) IXPE response matrices available on the IXPEOBSSIM public repository1. The source region was selected from the image of each of the three detector units (DU), with the source centred in a circular region of 60″ in radius. No background subtraction was applied due to the relatively high count rate of the source (∼30 cts s−1 per DU) (see Di Marco et al. 2023). The data analysis was performed following the weighted method2.
The normalized Stokes parameters q = Q/I and u = U/I, corresponding to a polarization degree (PD) and angle (PA), as well as their uncertainties were calculated using the model-independent pcube binning algorithm of IXPEOBSSIM. On the contrary, PD and PA obtained with XSPEC require the definition of a spectro-polarimetric model. The time-resolved spectra were obtained using the procedure described above and then the spectro-polarimetric analysis was performed by XSPEC.
3. Results
We constructed the time-resolved CCD for both observations (see Fig. 2). During Obs. 1, the source moved from a lower HB to an upper HB diagram position. This coincides with the 2–8 keV time profile flux decreasing by ∼28%, in an anti-correlation to its 4–8/2–4 keV X-ray hardness ratio, as is typical for a Z-source in the HB. Furthermore, Obs. 2 found the source in its NB, moving from the upper NB to the lower NB. During the observation, the flux and the hardness ratio were stable within a few percent, in agreement with a NB where the source is expected to be very close to its Eddington-limited luminosity.
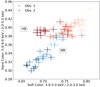 |
Fig. 2. IXPE CCD of XTE J1701−462 during Obs. 1 (red points) and Obs. 2 (blue points). Colors darken with increasing time in order to show the trend of the patterns. Each point corresponds to 500 s integration time. |
The IXPE polarimetric results obtained by ixpeobsim showed a (model-independent) strong variability of the linear PD between the two observations (see Fig. 3). An average PD of (4.6 ± 0.4)% was found during Obs. 1, while in Obs. 2 (∼10 d after Obs. 1), the 2–8 keV polarimetric signal could not be constrained with the 99% upper limit of 1.5%.
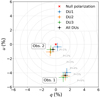 |
Fig. 3. Observed 2–8 keV overall polarization signal (black crosses) and for the single IXPE DUs (colored crosses) for Obs. 1 and Obs. 2. Stokes parameters computed by ixpeobsim. |
We described the time averaged spectra of the two observations by a standard two-component HSS model consisting of a multicolor disk and a harder boundary-spreading layer (BL-SL) emission (e.g., Popham & Sunyaev 2001; Revnivtsev et al. 2013. The BL emission can be modeled in XSPEC either using a pure blackbody (bbodyrad), or an unsaturated Comptonization model, such as comptt (Titarchuk 1994). The wide-band measurements (e.g., with BeppoSAX) suggest a Comptonized emission from a BL (e.g., Di Salvo et al. 2002; Farinelli et al. 2009) as a better way to describe the data. However, the IXPE spectra of XTE J1701−462 turned out difficult to fit by a comptt component without additional assumptions, due to a degeneracy in the parameter space. This is most likely due to the relatively narrow data pass-band, which prevents the energy cutoff from being constrained. Therefore, we considered replacing in the fits the Comptonization model by a pure blackbody component. In this case, the fits converged without further constraints.
The disk emission was modeled by diskbb and diskpn (Mitsuda et al. 1984; Gierliński et al. 1999). Due to the increased parameter space for diskpn, the inner radius resulted unconstrained, so it could not be distinguished from diskbb, and, in fact, the temperatures of the two models are consistent with each other.
A tbabs (Wilms et al. 2000) multiplicative component was included to account for the low-energy absorption due to the interstellar medium; abundances and cross-section tables according to Asplund et al. (2009) and Verner et al. (1996), (aspl, vern in XSPEC). We also included a normalizing cross-calibration multiplicative factor to account for the uncertainties in the effective areas of three telescopes. The resulting best fits for both observations are reported in Table 1 (upper panel) for the disk plus the blackbody-modeled BL. Photon and energy fluxes are slightly higher in Obs. 2, in agreement with an expected larger energy production in the NB. The BL and the inner disk are found to be hotter in Obs. 1, while the inner disk radius seems larger in Obs. 2. The opposite occurs for the BL sphere-equivalent radius. We tested the reasonable hypothesis that NH and the normalizing factors were the same for both observations. Nevertheless, the corresponding fits could be accepted only by relaxing the systematics to 1.3% and 1.5%. On the other hand, the interpolated value (nh ftool, v.3) of NH at the source coordinates is ∼0.6 × 1022cm−2, namely, it is several times lower than those presented in Lin et al. (2009) and in the present work. This suggests the source may be intrinsically (and possibly variably) absorbed by nearby cold structures.
Spectro-polarimetric results for Obs. 1 and 2 for a disk+BL model.
The Obs. 1 spectral best fit is shown in Fig. 4. The softer disk component dominates in photons (upper panel) up to ∼2.5 keV, being still important up to ∼3.5 keV. In the 2–8 keV band, the disk photons account for ∼24% of the total. The harder BL completely dominates the energy budget (lower panel, EFE representation).
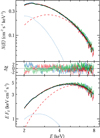 |
Fig. 4. IXPE photon (upper panel) and EFE spectra (lower panel) of XTE J1701−462 during Obs. 1, along with the best-fit model (see Table 1) consisting of diskbb for the accretion disk (blue dotted curve) and bbodyrad for the BL-SL layer (red dashed) as well as their sum (black solid). The residuals are shown in the middle panel. Blue, red, and green color correspond to DUs 1–3, respectively. |
Concerning the average polarization in the two observations, fully ixpeobsim-compatible results were achieved by the spectral-polarimetric data fits using XSPEC (please compare Fig. 5 to 3), where the energy-independent polarized multiplicative model component (polconst) was used (see Table 1).
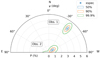 |
Fig. 5. Average polarization for Obs. 1 and 2 computed via spectro-polarimetric analysis using a single polconst convolving component in XSPEC (see Table 1). |
Motivated by the spectral decomposition shown in Fig. 4, we performed a spectro-polarimetric analysis, assuming that the two components may have different polarization properties. In Table 1, lower panel, the average and disk-versus-BL resolved (the latter obtained by applying a dedicated polconst to each of the main spectral components) polarization results are reported. The BL-related signals were constrained in both observations, with a polarization degree of 6.1% and 1.2%, respectively. In Obs. 2 the signal is incompatible with null polarization with a > 99.7% probability. The best fits and errors were obtained by joint variation of the spectral and polarimetric parameters (Garg et al. 2023) starting from the best fit to the spectra shown in the upper part of Table 1. As in Farinelli et al. (2023), we assumed a 90° separation of the disk polarization angle (PA) with respect to the BL one. This is expected in the absence of strong GR effects and because of the different geometries of the scattered BL radiation and the intrinsically polarized disk radiation (e.g., Chandrasekhar 1960). We also investigated the possibility of fully independent PAs for the two components, but no conclusion could be drawn because of the unconstrained and not statistically significant disk signal (see also Fig. 6 for Obs. 1).
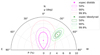 |
Fig. 6. Polarization contours in Obs. 1 for the diskbb and bbodyrad components estimated with polconst (see also Table 1, lower fit). |
The strong average polarization signal during Obs. 1 does not show a clear evidence for time variability during the measurement, although the polarization time profile (obtained in five 10 ks time intervals) may suggest a slightly lower average signal in the first time bin (see Fig. 7). The energy dependence of the polarization during both observations is not evident either (as shown in Fig. 8). Nevertheless, the lowest energy (2–3 keV) bin in Obs. 1 shows a lower polarization at a 90% confidence level with respect to higher energy bins.
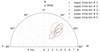 |
Fig. 7. Time-binned polarization of Obs. 1 at 90% confidence level. Zero polarization is excluded for all time bins at 99.9% confidence level. |
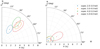 |
Fig. 8. 90% confidence level contours for the PD and PA in four IXPE energy bands (2–3, 3–4, 4–5, and 5–8 keV) for Obs. 1 (left panel) and Obs. 2 (right panel). |
In Obs. 2, only the 5–8 keV energy bin is compatible with a non-null polarization, at a confidence of 99.73%. If we assume Obs. 2 is unpolarized in all the four independent energy bins, the probability of claiming a false polarization for the 5–8 keV bin is 1 − (1 − p)n, where p = 0.27% (for the single-bin confidence level of 99.73%) and n = 4. This probability is 1.08%. The 5–8 keV polarization, being roughly aligned with the signal of Obs. 1, supports the possibility of a (weak) BL-related signal in Obs. 2 as well.
4. Discussion
The results in Sect. 3 show that XTE J1701−462 was observed by IXPE during its outburst Z evolutionary phase, in agreement with the reports of other X-ray observatories (e.g., Thomas et al. 2022). The IXPE light curve, CCD diagrams, and spectroscopic analysis confirm this result with a high level of confidence. In this context, the discovery of a strong polarimetric signal during the 2022 Sept 29 observation (Obs. 1) poses a new important constraint on the physical models and the geometry of the emission region of Z-sources.
The relative fluxes of the disk and the BL during Obs. 1 (Fig. 4) are in agreement with those typically observed for Z-sources in their HB CCD track (Farinelli et al. 2009). Also, the CCD time evolution (Fig. 2) during the observation indicates that the source was in a HB of the Z-track. Conversely, according to the CCD and the average spectral characteristics, Obs. 2 most likely found the source in the NB of the Z-track, with no (or relatively insignificant) excursions to the HB; in this case, only a ∼1% polarized signal that is strictly connected to the BL component could be established. This indicates that polarization is connected to the source position along its Z-track, and it is strongest in the upper-intermediate HB.
Taking these findings into account, it is necessary to explain the evidence for strong (possibly transient) polarization in the upper HB of the Z-track. Actually, the measured PD of ∼6% associated with the BL (direct and/or disk-reflected) emission as observed from a Z-source in a HB is rather challenging to explain.
An electron-scattering dominated accretion disk can be polarized at a level of 4% (Chandrasekhar 1960) for the inclination of i = 75° as inferred for XTE J1701−462 by Lin et al. (2009). However, the disk dominates below ∼3 keV and so, it cannot be responsible for the polarized emission at higher energies where the BL dominates. The BL itself, as a geometrically thicker extension of the inner accretion disk (i.e., lying in the same plane) is not likely to be the source of the polarized signal. Achieving PD of 5% requires a high inclination > 78° (Chandrasekhar 1960), typical for a dipper, while XTE J1701−462 does not show dips. Moreover, in a very similar source, Cyg X-2, polarization is parallel to the jet direction (Farinelli et al. 2023), while the BL model would predict polarization perpendicular to the jet. A high polarization of ∼10% can be easily achieved by multiple Compton scatterings in an optically thin, plane-parallel hot corona above the disk (Poutanen & Svensson 1996), however, this spectral component is not observed in the IXPE data.
The spreading layer (SL; Inogamov & Sunyaev 1999), namely, the BL at the NS surface, can potentially be polarized (Lapidus & Sunyaev 1985). We have computed the expected PD for this model assuming that the local emission corresponds to the semi-infinite electron-scattering dominated atmosphere (Chandrasekhar 1960). We considered layers of different latitudinal extents, narrow belts, and fully covered NS, and we accounted for the relativistic effects related to the rotation of the polarization plane due to the fast motion of the SL (Poutanen 2020). We did not obtain a PD exceeding ∼1.5% in any of these cases. Thus, we can conclude that the SL alone is not responsible for the observed polarization.
However, radiation that is emitted by the SL at the NS surface may be scattered by the surrounding material. If the SL does not extend to very high latitudes, then reflection from the ionized inner accretion disk could produce PD up to 6% in the total spectrum (see Fig. 7 in Lapidus & Sunyaev 1985) parallel to the rotation axis, when neglecting the inner disk direct emission (which is most likely polarized, but counteracting as being perpendicular to the axis). However, it is also important to note that disk polarization drops very rapidly with decreasing inclination, while the PD of the reflected signal has a much slower dependence on inclination. This implies that the PD of the total signal will be somewhat smaller at lower energies due to the dilution by nearly unpolarized disk radiation, but will not drop to zero due to cancellation of perpendicular polarization.
Radiation from the SL can also be scattered in a wind from the disk – or a jet, if one is present in the system. Radio loudness is mostly reported when the Z-sources are found in their HB phase (e.g., Done et al. 2007). Moreover, the observations of transient hard tails (THT) in the spectra of Z-sources are strictly correlated to HB positions in their CCDs (D’Amico et al. 2001; Di Salvo et al. 2002; Iaria et al. 2004; Farinelli et al. 2005) and possibly produced by scattering in a jet-like outflow (Reig & Kylafis 2016).
It is thus tempting to link the HB strong polarimetric signal to the accelerating mechanism (still not fully understood) that produces the jet emission and the possibly jet-related THT (Reig & Kylafis 2016). However, the contribution of the THT to the flux in the IXPE band is not expected to exceed 10% (see, e.g., Paizis et al. 2006) and therefore it is not very likely that this component is responsible for a strong polarized signal, unless the BL photons are single-scattered in the Thomson regime. Furthermore, it is not clear why the PD would then drop at lower energies, unless the spectrum of the THT has a low-energy cutoff around 3–4 keV; however, this can be nevertheless expected because a power-law component with no low energy cutoff would cause a low-energy fit contamination, which is not observed in the wide band spectra of Z-sources during their THT spectral phase (Paizis et al. 2006; Farinelli et al. 2009).
As the previously claimed extended jet-like structure to the south of XTE J1701−462 (Fender et al. 2007) is more likely a background feature (Gasealahwe et al. 2023), there are no convincing arguments as to why the jet would be the source of polarized signal. The central source itself, however, was radio loud (Fender et al. 2007), implying the existence of some outflow from the system. Also, the similarity of XTE J1701−462 to the prototype Cyg X-2 suggests that polarimetric signal is likely parallel to the outflow. The scattering of central radiation in the outflow can produce polarization. If the outflow occupied a large area above the disk, both the emission of the SL and the disk should be polarized in a similar fashion, which is not the case.
On the other hand, the outflow originating from the inner part of the accretion disk may face much larger optical depth along the disk plane than perpendicular to it. Thus, the disk radiation which is beamed strongly along its normal will be affected very little, whereas the SL radiation, which is emitted more isotropically (or even slightly beamed along the disk surface) can be scattered much more efficiently. Radiation injected along a slab and Thomson scattered there gets polarized parallel to the slab normal with the PD = sin2i/(3 − cos2i) (Sunyaev & Titarchuk 1985), reaching the maximum of 33% at 90° inclination. The PD in this case has a rather weak dependence on the inclination and even at i = 70°, the PD is still ∼30%. The observed 5–6% polarization requires that about 20% of the SL radiation is scattered in the wind, which does not appear to be implausible.
Finally, the question of why the PD is much smaller in Obs. 2 must be addressed. If scattering in the wind is responsible for the high PD in Obs. 1, then the wind has to almost disappear – or, at least, its optical depth should become smaller in the NB. If reflection from the disk is the source of the high PD, the most straightforward explanation would be that the latitudinal extent of the SL has decreased during Obs. 2, so that it no longer illuminates the disk efficiently.
Our IXPE data (see Table 1) also suggest that the inner disk could be farther from the SL during Obs. 2, possibly due to very high radiation pressure (Z-sources reach their Eddington limit when in the NB). This fact also points to less efficient disk illumination. Of course, all these speculations need the support of reliable simulations and this will likely be the subject of future investigations.
5. Summary
We reported a ∼5% linearly polarized signal in IXPE observations of the NS transient Z-source XTE J1701−462. The signal is found when the source is at the upper-and-intermediate horizontal branch position in the CCD diagram. The unprecedentedly high strength of the signal for this class of compact objects can hardly be explained by a standard boundary layer plus accretion disk scenario. We speculate that scattering of the boundary-spreading layer radiation by either the accretion disk, a corona above the disk, or an optically thin wind can be responsible for the observed polarimetric characteristics. On the other hand, the polarimetric signal was much lower when the source was in the normal branch, implying a change in the accretion geometry or the wind properties.
In the weighted analysis method, a weight is assigned to each photo-electron track depending on its shape.
Acknowledgments
The Imaging X-ray Polarimetry Explorer (IXPE) is a joint US and Italian mission. The US contribution is supported by the National Aeronautics and Space Administration (NASA) and led and managed by its Marshall Space Flight Center (MSFC), with industry partner Ball Aerospace (contract NNM15AA18C). The Italian contribution is supported by the Italian Space Agency (Agenzia Spaziale Italiana, ASI) through contract ASI-OHBI-2017-12-I.0, agreements ASI-INAF-2017-12-H0 and ASI-INFN-2017.13-H0, and its Space Science Data Center (SSDC) with agreements ASI-INAF-2022-14-HH.0 and ASI-INFN 2021-43-HH.0, and by the Istituto Nazionale di Astrofisica (INAF) and the Istituto Nazionale di Fisica Nucleare (INFN) in Italy. This research used data products provided by the IXPE Team (MSFC, SSDC, INAF, and INFN) and distributed with additional software tools by the High-Energy Astrophysics Science Archive Research Center (HEASARC), at NASA Goddard Space Flight Center (GSFC). J.P. and A.V. acknowledge support from the Academy of Finland grant 333112. A.B. is supported by the Finnish Cultural Foundation grant 00220175. The authors also thank the anonymous referee for the useful comments and suggestions.
References
- Asplund, M., Grevesse, N., Sauval, A. J., & Scott, P. 2009, ARA&A, 47, 481 [NASA ADS] [CrossRef] [Google Scholar]
- Baldini, L., Bucciantini, N., Lalla, N. D., et al. 2022, SoftwareX, 19, 101194 [NASA ADS] [CrossRef] [Google Scholar]
- Chandrasekhar, S. 1960, Radiative Transfer (New York: Dover) [Google Scholar]
- Chatterjee, R., Agrawal, V. K., Jayasurya, K. M., & Katoch, T. 2023, MNRAS, 521, L74 [NASA ADS] [CrossRef] [Google Scholar]
- D’Amico, F., Heindl, W. A., Rothschild, R. E., & Gruber, D. E. 2001, ApJ, 547, L147 [CrossRef] [Google Scholar]
- Di Marco, A., Soffitta, P., Costa, E., et al. 2023, AJ, 165, 143 [CrossRef] [Google Scholar]
- Di Salvo, T., Farinelli, R., Burderi, L., et al. 2002, A&A, 386, 535 [NASA ADS] [CrossRef] [EDP Sciences] [Google Scholar]
- Done, C., Gierliński, M., & Kubota, A. 2007, A&A Rev., 15, 1 [CrossRef] [Google Scholar]
- Farinelli, R., Frontera, F., Zdziarski, A. A., et al. 2005, A&A, 434, 25 [NASA ADS] [CrossRef] [EDP Sciences] [Google Scholar]
- Farinelli, R., Paizis, A., Landi, R., & Titarchuk, L. 2009, A&A, 498, 509 [NASA ADS] [CrossRef] [EDP Sciences] [Google Scholar]
- Farinelli, R., Fabiani, S., Poutanen, J., et al. 2023, MNRAS, 519, 3681 [NASA ADS] [CrossRef] [Google Scholar]
- Fender, R. P., Dahlem, M., Homan, J., et al. 2007, MNRAS, 380, L25 [CrossRef] [Google Scholar]
- Garg, A., Rawat, D., Bhargava, Y., Méndez, M., & Bhattacharyya, S. 2023, ApJ, 948, L10 [NASA ADS] [CrossRef] [Google Scholar]
- Gasealahwe, K. V. S., Monageng, I. M., Fender, R. P., et al. 2023, MNRAS, 521, 2806 [NASA ADS] [CrossRef] [Google Scholar]
- Gierliński, M., Zdziarski, A. A., Poutanen, J., et al. 1999, MNRAS, 309, 496 [CrossRef] [Google Scholar]
- Hasinger, G., & van der Klis, M. 1989, A&A, 225, 79 [NASA ADS] [Google Scholar]
- Homan, J., Altamirano, D., Fridriksson, J. K., & Linares, M. 2010, ATel, 3029, 1 [NASA ADS] [Google Scholar]
- Homan, J., Belloni, T., van der Klis, M., et al. 2006a, ATel, 725, 1 [Google Scholar]
- Homan, J., Belloni, T., van der Klis, M., et al. 2006b, ATel, 748, 1 [NASA ADS] [Google Scholar]
- Homan, J., Belloni, T., Wijnands, R., et al. 2007a, ATel, 1144, 1 [NASA ADS] [Google Scholar]
- Homan, J., van der Klis, M., Wijnands, R., et al. 2007b, ApJ, 656, 420 [NASA ADS] [CrossRef] [Google Scholar]
- Iaria, R., Di Salvo, T., Robba, N. R., et al. 2004, ApJ, 600, 358 [NASA ADS] [CrossRef] [Google Scholar]
- Inogamov, N. A., & Sunyaev, R. A. 1999, Astron. Lett., 25, 269 [NASA ADS] [Google Scholar]
- Iwakiri, W., Serino, M., Negoro, H., et al. 2022, ATel, 15592, 1 [NASA ADS] [Google Scholar]
- Krimm, H. A., Barthelmy, S. D., Baumgartner, W., et al. 2010, ATel, 3028, 1 [NASA ADS] [Google Scholar]
- Kuulkers, E., den Hartog, P. R., in’t Zand, J. J. M., et al. 2003, A&A, 399, 663 [NASA ADS] [CrossRef] [EDP Sciences] [Google Scholar]
- Lapidus, I. I., & Sunyaev, R. A. 1985, MNRAS, 217, 291 [NASA ADS] [CrossRef] [Google Scholar]
- Lewin, W. H. G., van Paradijs, J., & Taam, R. E. 1993, Space Sci. Rev., 62, 223 [CrossRef] [Google Scholar]
- Lin, D., Homan, J., Remillard, R., & Wijnands, R. 2007, ATel, 1183, 1 [NASA ADS] [Google Scholar]
- Lin, D., Remillard, R. A., & Homan, J. 2009, ApJ, 696, 1257 [NASA ADS] [CrossRef] [Google Scholar]
- Mitsuda, K., Inoue, H., Koyama, K., et al. 1984, PASJ, 36, 741 [NASA ADS] [Google Scholar]
- Nasa, H. 2014, Astrophysics Source Code Library [record ascl:1408.004] [Google Scholar]
- Paizis, A., Farinelli, R., Titarchuk, L., et al. 2006, A&A, 459, 187 [NASA ADS] [CrossRef] [EDP Sciences] [Google Scholar]
- Popham, R., & Sunyaev, R. 2001, ApJ, 547, 355 [NASA ADS] [CrossRef] [Google Scholar]
- Poutanen, J. 2020, A&A, 641, A166 [NASA ADS] [CrossRef] [EDP Sciences] [Google Scholar]
- Poutanen, J., & Svensson, R. 1996, ApJ, 470, 249 [CrossRef] [Google Scholar]
- Reig, P., & Kylafis, N. 2016, A&A, 591, A24 [NASA ADS] [CrossRef] [EDP Sciences] [Google Scholar]
- Remillard, R. A., Lin, D., ASM Team at MIT,& NASA/GSFC 2006, ATel, 696, 1 [NASA ADS] [Google Scholar]
- Revnivtsev, M. G., Suleimanov, V. F., & Poutanen, J. 2013, MNRAS, 434, 2355 [NASA ADS] [CrossRef] [Google Scholar]
- Sanna, A., Méndez, M., Altamirano, D., et al. 2010, MNRAS, 408, 622 [NASA ADS] [CrossRef] [Google Scholar]
- Soffitta, P., Baldini, L., Bellazzini, R., et al. 2021, AJ, 162, 208 [CrossRef] [Google Scholar]
- Sunyaev, R. A., & Titarchuk, L. G. 1985, A&A, 143, 374 [NASA ADS] [Google Scholar]
- Thomas, N. T., Anirudh, S., Giridharan, L., et al. 2022, ATel, 15654, 1 [NASA ADS] [Google Scholar]
- Titarchuk, L. 1994, ApJ, 434, 570 [NASA ADS] [CrossRef] [Google Scholar]
- Ursini, F., Farinelli, R., Gnarini, A., et al. 2023, A&A, accepted [arXiv:2306.02740] [Google Scholar]
- van der Klis, M. 1995, in X-ray Binaries, eds. W. H. G. Lewin, E. P. J. van den Heuvel, & J. van Paradijs (Cambridge: Cambridge University Press), Cambridge Astrophysics Series, 26, 252 [NASA ADS] [Google Scholar]
- Verner, D. A., Ferland, G. J., Korista, K. T., & Yakovlev, D. G. 1996, ApJ, 465, 487 [Google Scholar]
- Šimon, V. 2015, New stron.A, 37, 26 [CrossRef] [Google Scholar]
- Weisskopf, M. C., Soffitta, P., Baldini, L., et al. 2022, J. Astron. Telesc. Instrum. Syst., 8, 026002 [NASA ADS] [CrossRef] [Google Scholar]
- Wilms, J., Allen, A., & McCray, R. 2000, ApJ, 542, 914 [Google Scholar]
All Tables
All Figures
|
Fig. 1. 2022 (black) and 2006 (red) outburst light curves of XTE J1701−462. The starting time t0 are MJD 53731.5 and MJD 59824.5 for 2006 and 2022, respectively. In the instruments’ full energy range, 1 Crab is 75 c s−1 for RXTE/ASM and 3.8 c s−1 for MAXI. The blue ticks on the abscissa indicate the epochs of the two IXPE observations (no MAXI data exist during Obs. 1). |
| In the text | |
|
Fig. 2. IXPE CCD of XTE J1701−462 during Obs. 1 (red points) and Obs. 2 (blue points). Colors darken with increasing time in order to show the trend of the patterns. Each point corresponds to 500 s integration time. |
| In the text | |
|
Fig. 3. Observed 2–8 keV overall polarization signal (black crosses) and for the single IXPE DUs (colored crosses) for Obs. 1 and Obs. 2. Stokes parameters computed by ixpeobsim. |
| In the text | |
|
Fig. 4. IXPE photon (upper panel) and EFE spectra (lower panel) of XTE J1701−462 during Obs. 1, along with the best-fit model (see Table 1) consisting of diskbb for the accretion disk (blue dotted curve) and bbodyrad for the BL-SL layer (red dashed) as well as their sum (black solid). The residuals are shown in the middle panel. Blue, red, and green color correspond to DUs 1–3, respectively. |
| In the text | |
|
Fig. 5. Average polarization for Obs. 1 and 2 computed via spectro-polarimetric analysis using a single polconst convolving component in XSPEC (see Table 1). |
| In the text | |
|
Fig. 6. Polarization contours in Obs. 1 for the diskbb and bbodyrad components estimated with polconst (see also Table 1, lower fit). |
| In the text | |
|
Fig. 7. Time-binned polarization of Obs. 1 at 90% confidence level. Zero polarization is excluded for all time bins at 99.9% confidence level. |
| In the text | |
|
Fig. 8. 90% confidence level contours for the PD and PA in four IXPE energy bands (2–3, 3–4, 4–5, and 5–8 keV) for Obs. 1 (left panel) and Obs. 2 (right panel). |
| In the text | |
Current usage metrics show cumulative count of Article Views (full-text article views including HTML views, PDF and ePub downloads, according to the available data) and Abstracts Views on Vision4Press platform.
Data correspond to usage on the plateform after 2015. The current usage metrics is available 48-96 hours after online publication and is updated daily on week days.
Initial download of the metrics may take a while.