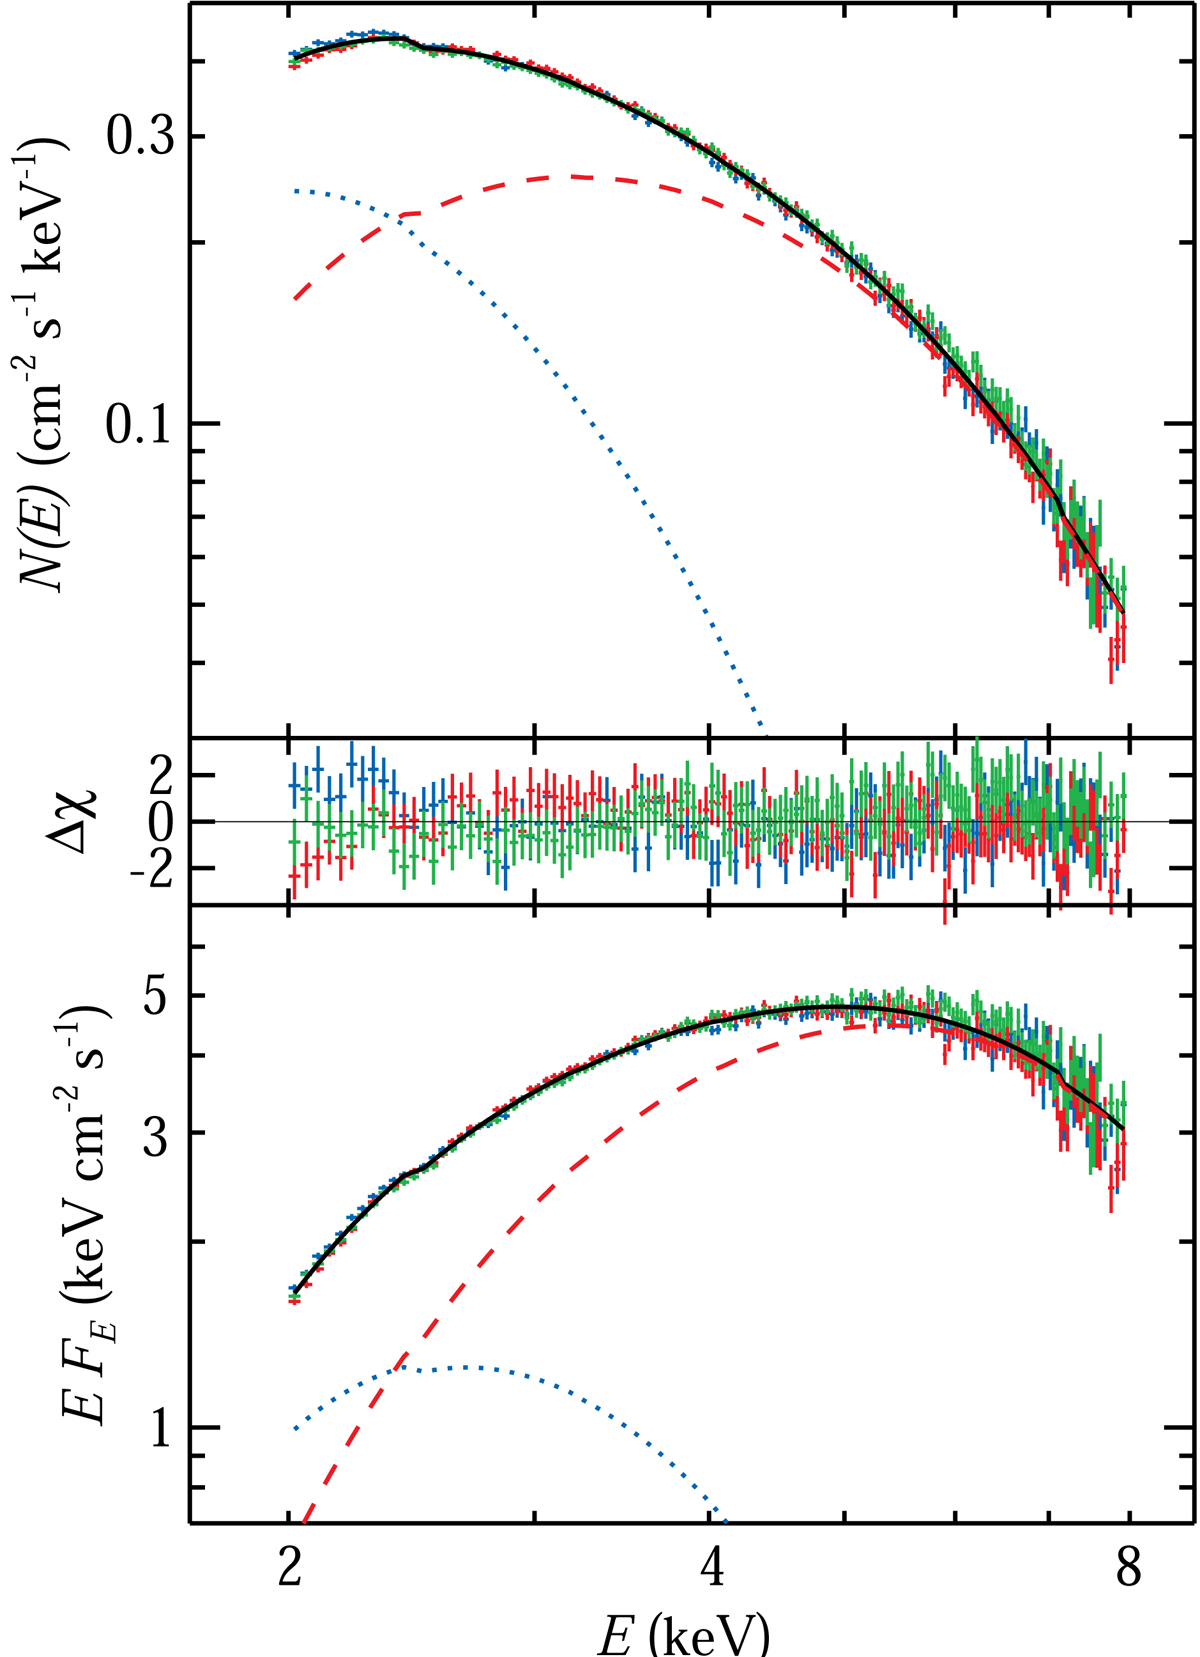
Fig. 4.
Download original image
IXPE photon (upper panel) and EFE spectra (lower panel) of XTE J1701−462 during Obs. 1, along with the best-fit model (see Table 1) consisting of diskbb for the accretion disk (blue dotted curve) and bbodyrad for the BL-SL layer (red dashed) as well as their sum (black solid). The residuals are shown in the middle panel. Blue, red, and green color correspond to DUs 1–3, respectively.
Current usage metrics show cumulative count of Article Views (full-text article views including HTML views, PDF and ePub downloads, according to the available data) and Abstracts Views on Vision4Press platform.
Data correspond to usage on the plateform after 2015. The current usage metrics is available 48-96 hours after online publication and is updated daily on week days.
Initial download of the metrics may take a while.