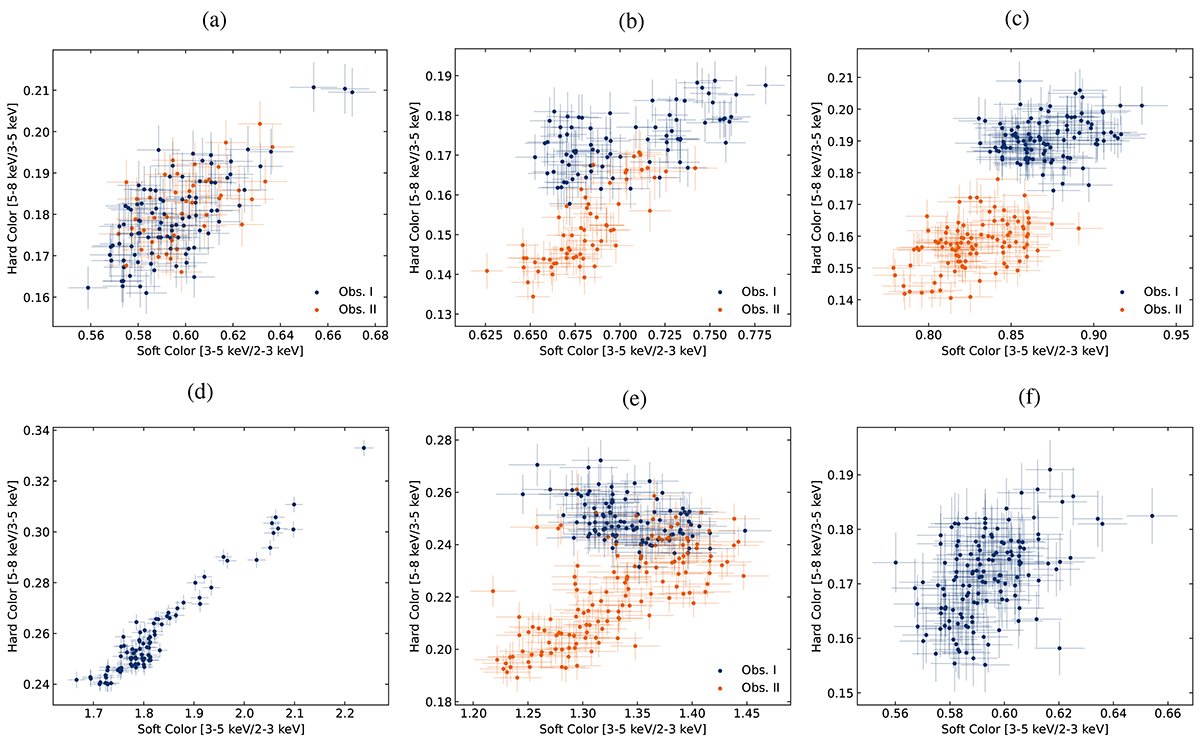
Fig. 3.
Download original image
CCDs of each source using the IXPE observations (Table 1). The soft and hard colors are defined as the ratio of the counts in the 3–5 keV/2–3 keV and 5–8 keV/3–5 keV bands, respectively. Different colors correspond to different observation of the source. Each bin corresponds to 1000 s. (a) Cyg X-2. (b) XTE J1701–462. (c) GX 5–1. (d) Sco X-1. (e) GX 340+0. (f) GX 349+2.
Current usage metrics show cumulative count of Article Views (full-text article views including HTML views, PDF and ePub downloads, according to the available data) and Abstracts Views on Vision4Press platform.
Data correspond to usage on the plateform after 2015. The current usage metrics is available 48-96 hours after online publication and is updated daily on week days.
Initial download of the metrics may take a while.