| Issue |
A&A
Volume 699, July 2025
|
|
|---|---|---|
| Article Number | A312 | |
| Number of page(s) | 19 | |
| Section | Extragalactic astronomy | |
| DOI | https://doi.org/10.1051/0004-6361/202554141 | |
| Published online | 21 July 2025 | |
The rich JWST spectrum of the western nucleus of Arp 220: Shocked hot core chemistry dominates the inner disc
1
Leiden Observatory, Leiden University, PO Box 9513, 2300 RA Leiden, The Netherlands
2
Transdisciplinary Research Area (TRA) ‘Matter’/Argelander-Institut für Astronomie, University of Bonn, Bonn, Germany
3
Physics and Astronomy, University College London, London, UK
4
UK Astronomy Technology Centre, Royal Observatory, Blackford Hill Edinburgh, EH9 3HJ Scotland, UK
5
Centro de Astrobiología (CAB), CSIC-INTA, Camino Bajo del Castillo s/n, 28692 Villanueva de la Cañada, Madrid, Spain
6
Sterrenkundig Observatorium, Universiteit Gent, Krijgslaan 281 S9, 9000 Gent, Belgium
7
European Space Agency, c/o Space Telescope Science Institute, 3700 San Martin Drive, Baltimore, MD 21218, USA
8
Faculty of Aerospace Engineering, Delft University of Technology, Kluyverweg 1, 2629 HS Delft, The Netherlands
9
Centro de Astrobiología (CAB), CSIC–INTA, Cra. de Ajalvir Km. 4, 28850 Torrejón de Ardoz, Madrid, Spain
10
Cosmic Dawn Center (DAWN), Copenhagen, Denmark
11
DTU Space, Technical University of Denmark, Elektrovej, Building 328, 2800 Kgs. Lyngby, Denmark
12
Sorbonne Université, CNRS, UMR 7095, Institut d’Astrophysique de Paris, 98bis bd Arago, 75014 Paris, France
13
Institut Universitaire de France, Ministère de l’Enseignement Supérieur et de la Recherche, 1 Rue Descartes, 75231 Paris Cedex 05, France
14
Telespazio UK for the European Space Agency (ESA), ESAC, Camino Bajo del Castillo s/n, 28692 Villanueva de la Cañada, Spain
15
Department of Astronomy, Stockholm University, The Oskar Klein Centre, AlbaNova 106 91, Stockholm, Sweden
16
Max Planck Institute for Astronomy, Konigstuhl 17, 69117 Heidelberg, Germany
17
Centre for Extragalactic Astronomy, Durham University, South Road, Durham DH1 3LE, UK
18
Dept. of Astrophysics, University of Vienna, Türkenschanzstr. 17, 1180 Vienna, Austria
19
ETH Zürich, Institute for Particle Physics and Astrophysics, Wolfgang-Pauli-Str. 27, 8093 Zürich, Switzerland
20
Dublin Institute for Advanced Studies, 31 Fitzwilliam Place, D02 XF86 Dublin, Ireland
⋆ Corresponding author.
Received:
14
February
2025
Accepted:
14
May
2025
Abstract
We present full 3–28 μm JWST MIRI/MRS and NIRSpec/IFU spectra of the western nucleus of Arp 220, the nearest ultraluminous infrared galaxy. This nucleus has long been suggested to possibly host an embedded Compton-thick AGN. Millimetre observations of the dust continuum suggest the presence of a distinct 20 pc core with a dust temperature of Td≳500 K, in addition to a 100 pc circumnuclear starburst disc. However, unambiguously identifying the nature of this core is challenging, due to the immense obscuration, the nuclear starburst activity, and the nearby eastern nucleus. With the JWST integral field spectrographs, for the first time we can separate the two nuclei across this full wavelength range, revealing a wealth of molecular absorption features towards the western nucleus. We analysed the rovibrational bands detected at 4–22 μm, deriving column densities and rotational temperatures for ten distinct species. Optically thick features of C2H2, HCN, and HNC suggest that this molecular gas is hidden behind a curtain of cooler dust and indicate that the column densities of C2H2 and HCN are an order of magnitude higher than previously derived from Spitzer observations. We identified a warm HCN component with a rotational temperature of Trot = 330 K, which we associate with radiative excitation by the hot inner nucleus. We propose a geometry where the detected molecular gas is located in the inner regions of the starburst disc, directly surrounding the hot 20 pc core. The chemical footprint of the western nucleus is reminiscent of that of hot cores, with additional evidence of shocks. Despite the molecular material's close proximity to the central source, no evidence for the presence of an AGN in the form of X-ray-driven chemistry or extreme excitation was found.
Key words: galaxies: active / galaxies: ISM / galaxies: individual: Arp 220 / galaxies: nuclei / galaxies: starburst
© The Authors 2025
 Open Access article, published by EDP Sciences, under the terms of the Creative Commons Attribution License (https://creativecommons.org/licenses/by/4.0), which permits unrestricted use, distribution, and reproduction in any medium, provided the original work is properly cited.
This article is published in open access under the Subscribe to Open model. This email address is being protected from spambots. You need JavaScript enabled to view it. to support open access publication.
1. Introduction
Arp 220, the nearest ultra-luminous infrared galaxy (ULIRG), has been the subject of extensive observational studies across the electromagnetic spectrum. Its enormous infrared luminosity (LIR = 2 × 10¹² L⊙), first discovered by the Infrared Astronomical Satellite (IRAS) (Soifer et al. 1984), is comparable to the bolometric luminosity of a quasar. This extreme power led to a yet-unresolved debate about its nature as either a ‘superstarburst’ or host to a deeply buried active galactic nucleus (AGN). Optical photometry, as well as HI 21 cm imaging, revealed tidal tails, suggesting that Arp 220 is an advanced-stage major merger of two gas-rich galaxies (Joseph & Wright 1985; Sanders et al. 1988; Hibbard et al. 2000). A prominent dust lane, oriented NW to SE, hides two remnant nuclei only 1″ apart. It was first resolved by radio observations (Norris 1988) and later in ground-based infrared (IR) images (Graham et al. 1990; Soifer et al. 1999).
The two nuclei of Arp 220, hereafter denoted as the western nucleus (WN) and the eastern nucleus (EN), are intriguing structures on their own, with the WN being the more luminous and obscured of the two. Radio-VLBI observations have revealed 97 compact point sources, interpreted as supernovae (SNe) and supernova remnants (SNRs), distributed in ellipses centred on the two nuclei (e.g. Smith et al. 1998; Lonsdale et al. 2006; Varenius et al. 2019). These SNe and SNRs are well-matched to the nuclear disc structures seen in high-resolution ALMA dust continuum observations. The discs are counter-rotating, with the eastern disc approximately aligned with the surrounding kpc-scale rotating structure (Sakamoto et al. 1999, 2017; Scoville et al. 2015, 2017). These findings all point towards a recent nuclear starburst.
Analyses of the millimetre continuum suggest the presence of a distinct inner core component for the WN, with column density N(H2)∼1026 cm−2, in addition to the starburst disc (Scoville et al. 2017; Sakamoto et al. 2017, 2021a). If this core harbours a hidden AGN, it is very Compton-thick, and all of its associated X-ray emission will be absorbed before reaching an outside observer. Indeed, Teng et al. (2015) have concluded that their Fe Kα detection is consistent with this line arising from the starburst. Furthermore, to date, no high-excitation mid-infrared (MIR) AGN lines have been detected (Goldberg et al. 2024; Perna et al. 2024). The extreme optical depths towards the WN impede the search for an AGN, but they also make it difficult to confirm its absence. Indirect probes of AGN activity must therefore be explored.
The nuclear region contains large amounts of chemically rich molecular gas. The earliest interferometric line observations already showed a concentration of 70% of the total CO (1-0) emission in the inner < 1500 pc (Scoville et al. 1986). Later, submillimetre spectral scans revealed complex line forests full of broad emission lines (e.g. Martín et al. 2011; Aladro et al. 2015; Sakamoto et al. 2021b). At the highest spatial resolutions achieved with ALMA, sub-continuum absorption appears towards the compact inner core of the WN in a wide variety of molecular lines (Scoville et al. 2017; Sakamoto et al. 2021b).
Beyond (sub)millimetre rotational lines, the molecular gas of Arp 220 has also been probed with centimetre radio observations and Herschel far-infrared spectroscopy. At centimetre wavelengths, lines of NH3, H2CO, and CH2NH have been detected (Araya et al. 2004; Takano et al. 2005; Ott et al. 2011; Salter et al. 2008). Herschel detected high-excitation rotational lines of CO and HCN as well as H2O, OH, NH3, and several molecular ions (Rangwala et al. 2011; González-Alfonso et al. 2012, 2013). Arp 220 also hosts the first known 18 cm OH megamaser (Baan et al. 1982, 2023; Baan & Haschick 1984).
Evidence of molecular outflows is plentiful. Blueshifted absorption and P Cygni profiles have been found in a variety of lines across a wide spectral range (e.g. Baan et al. 1989; Sakamoto et al. 2009; Rangwala et al. 2011; González-Alfonso et al. 2012; Tunnard et al. 2015; Perna et al. 2020). Barcos-Muñoz et al. (2018) spatially resolved a 200 pc-scale collimated bipolar outflow at the WN in HCN (1-0) and CO (1-0), reaching line-of-sight velocities of 500 km s−1. Wheeler et al. (2020) and Sakamoto et al. (2021b) confirmed this collimated high-velocity outflow in HCN (4-3) and several other CO lines. A less prominent polar outflow has been suggested for the EN, but only the blueshifted absorbing lobe has been firmly detected (Sakamoto et al. 2021b). Furthermore, recent JWST NIRSpec results have revealed kpc-scale hot molecular outflows from both nuclei, traced by H2 S(1) 1-0 emission (Perna et al. 2024; Ulivi et al. 2025).
Given the numerous molecular species detected in Arp 220, a characterisation of its chemistry has been proposed as a potential avenue to find a buried AGN. While much of its chemical footprint is reminiscent of Galactic hot cores and other starburst galaxies (e.g. Lahuis et al. 2007; Martín et al. 2011), evidence of substantial X-ray-driven chemistry or AGN-driven mechanical heating would point towards AGN activity deep inside the nucleus. Such scenarios have been proposed based on overluminous HNC emission (Aalto et al. 2007), elevated [HCN]/[HCO+] abundance ratios (e.g. Tunnard et al. 2015), and high inferred column densities of H2O+, OH+ and OH (Rangwala et al. 2011; González-Alfonso et al. 2012), but none of these diagnostics are without alternative interpretation.
Another angle that has been explored observationally is through lines of vibrationally excited molecules. Salter et al. (2008) already detected several direct l-type transitions of vibrationally excited HCN (HCN-vib) at centimetre wavelengths in absorption. Later submillimetre observations also detected rotational HCN-vib emission lines as well as lines of vibrationally excited HC3N (Martín et al. 2011, 2016; Aalto et al. 2015; Sakamoto et al. 2021b). These lines have been used to probe the hot inner envelopes of Galactic hot cores (e.g. van der Tak et al. 1999; Boonman et al. 2001). They only emerge in regions where a strong MIR continuum (Td>100 K; Sakamoto et al. 2010) can efficiently pump the molecules into a vibrationally excited mode and are therefore not affected by contamination or self-absorption of colder gas in the same way their ground-state counterparts are. Sakamoto et al. (2021b) confirmed this notion by comparing emission sizes of a wide variety of lines in a high-resolution spectral scan, and they found that the HCN-vib emission was very compact.
For HCN, the pumping mechanism in question involves absorption in the 14 μm ν2 band, exciting its bending mode. This absorption band has been observed in Arp 220 and several other U/LIRGs with Spitzer (Lahuis et al. 2007). With the advent of JWST and its integral field spectroscopy (IFS) capabilities, several nuclear regions of other U/LIRGs without reported HCN-vib emission have been added to this list (Buiten et al. 2024; González-Alfonso et al. 2024; García-Bernete et al. 2024). Rovibrational absorption bands provide insight into local excitation conditions. Depending on the size of the effective background continuum source, they can probe a narrower line of sight than the point spread function (PSF) of the telescope. Thus, they are an excellent probe of the inner nuclear regions. Additionally, molecules such as C2H2, CO2, and CH4, which are key components of the interstellar chemistry of high-mass star-forming regions but lack any allowed rotational transitions, can be detected through their rovibrational bands (e.g. Lahuis & van Dishoeck 2000; Sonnentrucker et al. 2007; Barr et al. 2020; Francis et al. 2024; van Gelder et al. 2024). Mid-infrared molecular signatures can therefore serve as a useful chemical probe through direct comparison to spectra of Galactic hot cores.
In this work, we present the detection and analysis of a large number of rovibrational molecular bands in the WN of Arp 220 with JWST MIRI/MRS and NIRSpec/IFU. With JWST, the two nuclei of Arp 220 are, for the first time, separated in near-infrared and MIR spectroscopic observations, and the strong absorption towards the WN is no longer contaminated by continuum emission from the EN. The bands of HCN, C2H2, and CO2, previously detected at low spectral resolution with Spitzer (Lahuis et al. 2007), are now seen in unprecedented detail. This work complements a study of the MIR emission lines in the MIRI/MRS cube (Van der Werf et al., in prep.) and an extensive search for high-excitation fine structure lines by Goldberg et al. (2024) as well as two studies on the emission lines seen with NIRSpec (Perna et al. 2024; Ulivi et al. 2025). In the present paper, we only consider the WN, where the absorption lines are strongest and allow for a highly detailed analysis.
In Section 2, we summarise the JWST observations and data reduction. In Section 3, we describe the spectral fitting procedure used and present the resulting models and inferred gas properties for the detected bands. A discussion on the excitation conditions and chemistry of the observed molecular gas components and their implications for the nature of the nucleus follows in Section 4. Finally, we summarise our findings in Section 5. Throughout this work, we assume a flat Planck cosmology with H0 = 67.4 kms−1 Mpc−1 and Ωm = 0.315 (Planck Collaboration VI 2020). Under these cosmological parameters and assuming a systemic redshift of z = 0.0188, Arp 220 has a luminosity distance of 84.8 Mpc and a projected angular scale of 396 pc/″.
2. Observations and data reduction
2.1. MIRI
A full description of the observations and data reduction is given in Van der Werf et al. (in prep.). Here, we provide a summary.
Arp 220 was observed by the MIRI MRS as part of the Mid-Infrared Characterisation of Nearby Iconic galaxy Centers (MICONIC) Guaranteed Time Observations (GTO) program 1267 (PI: D. Dicken; DOI 10.17909/t6c5-ks25). This program targets the nuclear regions of the Milky Way and several iconic nearby galaxies: Arp 220, Mrk 231 (Alonso Herrero et al. 2024), NGC 6240 (Hermosa Muñoz et al. 2025), Cen A, and SBS 0335-052. Dedicated background exposures and simultaneous images were taken to enable the subtraction of thermal telescope emission and zodiacal light and to allow for astrometric calibration. A four-point dither pattern was used for the science exposures, and two-point dithering for the backgrounds. The uncalibrated data products were downloaded through the MAST portal and reduced with the JWST Science Calibration pipeline v1.13.4, using CRDS context file jwst_1200.pmap. Several non-standard settings were used for the Stage 1 outlier detection, most notably the use of the cosmic ray shower detection step. Pixel-based ‘image-from-image’ background subtraction was performed in Stage 2, making use of the dedicated backgrounds. In Stage 2, we also used the pixel replacement option. Finally, in the Stage 3 outlier detection, we used a larger kernel size of 11×11 pixels. The MIRI MRS cubes cover a spectral range of 4.9−27.9 μm and have a resolving power varying between 1330 at the longest wavelengths and 3710 at the shortest (Jones et al. 2023; Wright et al. 2023; Argyriou et al. 2023).
In post-processing, the astrometry of the data cubes was corrected based on Gaia Data Release 3 stars (Gaia Collaboration 2023) in the simultaneous imaging data. An aperture of 0 435 in radius centred on the WN was selected for spectral extraction (see Fig. 1). This aperture size was chosen to reduce the effect of ‘wiggles’ due to spatial undersampling of the PSF (Law et al. 2023), in order to reveal weak molecular absorption lines. We note that in channel 4, the PSF becomes too wide to completely separate the two nuclei, and the continuum emission from the WN becomes dominant. However, as we exclusively use continuum-normalised spectra to study absorption features, the increasing PSF size does not affect our analysis, and we do not need to apply an aperture correction. For each channel, the redshift was manually calibrated using H2 lines to ensure that velocities are measured with respect to the bulk of the warm molecular gas. The redshifts derived from H2 lines generally correspond well to the value of zWN = 0.01786±0.00005 derived from rotational CO and HCO+ lines by Sakamoto et al. (2009). A more detailed analysis of the H2 lines detected with the MIRI MRS is presented by Van der Werf et al. (in prep.). The full extracted MIRI MRS spectrum of the WN is presented in Fig. 2.
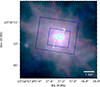 |
Fig. 1. MIRI false-colour image of Arp 220 using the F1280W (red), F1130W (green), and F770W (blue) filters. The blue rectangles indicate the smallest (channel 1) and largest (channel 4) fields of view of the MRS observations. The cyan circles indicate extraction apertures for the western and eastern nuclei, both with a radius of 0 |

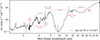 |
Fig. 2. Combined NIRSpec/IFU G395H/F290LP + MIRI MRS spectrum of the WN of Arp 220, extracted from a circular aperture of 0 |

2.2. NIRSpec
In coordination with the MIRI observations, NIRSpec observations were taken as well. These are presented by Perna et al. (2024) and Ulivi et al. (2025); here we summarise the data acquisition and reduction. The nuclear region was observed with each of the three high-resolution grating settings, using a four-point dither pattern. Data reduction was performed using a modified version of the JWST Science Calibration pipeline v1.8.2 and CRDS context file jwst_1063.pmap. Modifications included corrections for 1/f noise to the count-rate images, and outlier detection as implemented by D’Eugenio et al. (2024). Of the three final data cubes, in this work we only use the one from the G395H/F290LP grating setting. This cube covers a wavelength range 2.9−5.2 μm with resolving power R≈2700 (Böker et al. 2023).
We extract the spectrum from an aperture of 0 15 in radius, centred on the WN. Given the higher angular resolution of NIRSpec, a smaller aperture than for the MIRI data was used to avoid contaminating emission from the nearby bright star cluster (Perna et al. 2024). Experimentation with aperture size led us to conclude that, indeed, the CO absorption is deeper in the smaller aperture, suggesting that the continuum emission is not fully dominated by the WN at these wavelengths. This is substantiated by comparatively faint, somewhat extended emission seen in narrow-band images extracted from NIRSpec cubes (Perna et al. 2024). A spectrum extracted from an aperture 0
 435 in radius, to match that used for the MIRI data, is shown in Fig. 2.
In addition to the GTO program, MIRI and NIRCam imaging observations were taken as part of Director's Discretionary program 2739, available at DOI 10.17909/94a9-h925. In the present work, MIRI imaging in three filters is used exclusively for the purpose of visualising the MIRI/MRS and NIRSpec fields of view, and the aperture selection, shown in Fig. 1.
3. Results and analysis
The extracted JWST spectra of the WN of Arp 220 contain a large number of molecular bands. Here we present these detections, alongside model spectra of the bands. The inferred properties of the gas are summarised in Table 1. In the following we outline the general method used to model the molecular bands.
Summary of derived gas properties.
The first step in the analysis of each band is to extract the background continuum. We model the local continuum by fitting a basis spline with manually placed nodes, and divide the observed spectrum by this continuum model. Throughout this work we assume that the lines are pure absorption lines and that the absolute fluxes are therefore irrelevant. We reflect on this assumption in Section 4.1.2.
Given the large line widths and the chemical complexity of the nucleus, almost no isolated individual lines are present in the spectrum, and therefore a rotation diagram analysis (Goldsmith & Langer 1999) is insufficient to describe the observed molecular signatures. Instead, throughout this work we adopt a spectral fitting procedure with local thermodynamic equilibrium (LTE) models and Markov Chain Monte Carlo (MCMC) sampling, implemented through the emcee Python package (Foreman-Mackey et al. 2013). We estimate radial velocities and dispersions from direct measurements where possible, or from visual comparison to model spectra otherwise, and fix these kinematics in the models1. For each gas component, the rotational excitation temperature Trot and column density N are left as free parameters. In many cases, bands of several species overlap, and they must be fit together.
The dust continuum observed towards the nuclei of U/LIRGs is typically produced not by a single uniform emission source, as we implicitly assume our background to be, but rather by a distribution of dust with a temperature gradient (e.g. Armus et al. 2007; Donnan et al. 2024). The detected molecular gas could be located anywhere in this dust distribution. If, at any wavelength, a significant fraction of the observed continuum is produced in the foreground, the absorption signal produced in a deeper layer will be diluted by this foreground emission. In this work we do not model the spectral energy distribution of the continuum, remaining deliberately agnostic about the location of the molecular gas and avoiding the complexity and degeneracies involved in SED models. Instead, we parametrise the fraction of observed continuum flux that passes through the absorbing gas through the background fraction fbg. This parameter is mathematically equivalent to the covering factor, which describes the projected overlap between a uniform background source and a uniform absorbing cloud. However, we do not consider this a correct interpretation here, as high-resolution ALMA data of the Arp 220 nuclei show extended molecular gas traced by many lines (e.g. Sakamoto et al. 2021b).
The background fraction is largely degenerate with column density unless (some of) the features become optically thick. If the deepest features are no longer optically thin, the absorption depth ratio between optically thick and optically thin features becomes a probe of the background fraction. In particular, the detection of both a deep, blended Q branch and the shallower P and R branch lines can break the degeneracy between background fraction and column density, if the Q branch is shallower than expected from the R and P branch lines. In our analysis, we try to simultaneously fit the background fraction along with the temperature and column density. We use a scalar background fraction under the assumption that across the spectral range of the fit, the spectral shape of the unabsorbed continuum does not vary greatly from that of the assumed total continuum. For the narrow range of a single rovibrational band, this assumption is typically valid. In cases where the background fraction is unconstrained, we present a range of inferred column densities based on the minimum and maximum possible background fraction. In the absence of obviously saturated features, the minimum possible background fraction is equal to the absorption depth of the deepest feature: fbg,min = 1−Iobs,min/Iobs,cont.
To construct the spectral models, we adopt line lists and partition functions primarily from the HITRAN database (Gordon et al. 2022). CDMS (Endres et al. 2016) is used instead for N2H+, HC3N (Section 3.1), HCO+ (Section 3.5), and C2H (Section 3.6); for HNC (Section 3.5) the line list is taken from GEISA (Delahaye et al. 2021) and the partition function from CDMS. For each spectral fit, the final best-fit model is constructed by taking the median of the sampled posterior for each parameter, and modelling the spectrum under those conditions. Details for each individual spectral region are provided in the relevant sections. All inferred gas properties are summarised in Table 1.
3.1. C2H2 and HCN fundamental bands
The MIRI spectrum around 14 μm shows prominent absorption features of HCN and C2H2 (Fig. 3). The Q branches, previously detected with Spitzer (Lahuis et al. 2007) and now seen at higher spatial and spectral resolution, reach absorption depths of 25% and 30% respectively. Additionally, a large number of R and P branch lines of both species are clearly detected. Three weaker but clearly detected features can be attributed to the Q branches of CO2, N2H+, and HC3N.
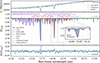 |
Fig. 3. Top panel: Observed spectrum and total model of the 14 μm region. Middle panel: Continuum-normalised spectrum and model absorption spectrum. The model includes C2H2, two HCN components, N2H+, and CO2. A fiducial model of HC3N with N = 3×1015 cm−2, T = 50 K is plotted as well. All components are shown with fbg = 0.28, following the value inferred from C2H2 and HCN. The inset shows the model of the HCN Q branch in detail, illustrating that a 330 K component is needed to explain the asymmetric shape of the Q branch. Strong lines in the R and P branches of C2H2 and HCN are labelled for reference. Bottom panel: Residual spectrum. The grey shaded area indicates the 68% interval of the residuals. |
We estimated the radial velocity and velocity dispersion of C2H2 and HCN from their R branch lines, considering only those that are relatively unaffected by contamination from the other species. We then took the median radial velocity and dispersion of each species separately and used these as fixed parameters in the spectral fits. We note that by using the directly measured line widths, we implicitly assumed that the lines are optically thin. This assumption can be verified by considering the maximum optical depth of the lines. For C2H2, the background fraction must exceed 0.31 to produce the observed Q branch depth. Its deepest R branch line reaches an absorption depth of 10%. Therefore, the true peak optical depth of this line is at most τ0<0.4, and we can safely use the directly measured line widths in our fits.
Initial fits exhibited an asymmetry between lines arising from ortho and para levels of C2H2, where the ortho-C2H2 lines were well-fit but the para-C2H2 lines were underpredicted. For this reason, we implemented the ortho-to-para ratio (OPR) for this species as a free parameter. Furthermore, we find that a single HCN component cannot explain the shape of the Q branch at 14.0 μm, and incorporate a second, warmer HCN component. We note that attempts to fit the background fraction of each component separately led to very similar values for C2H2 and the cold HCN component, but failed to constrain that of the warm HCN component. This latter background fraction may be smaller if the warm HCN is located in a deeper layer of the nucleus, in which case its implied column density would be larger.
After constraining the C2H2 and HCN properties, we combine the best-fit model spectrum with models of CO2 and N2H+ to simultaneously fit for the properties of the latter two species. For these species we only detect the Q branches, and therefore we ran the fit for both fbg = 1 and fbg = 0.05 to determine the full range of possible column densities. The corresponding total model spectrum is shown in Fig. 3. A fiducial model of HC3N, which has a Q branch at 15.07 μm, is presented as well. The inferred column densities and temperatures of C2H2, HCN, CO2 and N2H+ are summarised in Table 1.
ALMA observations of the WN previously found a collimated, compact molecular outflow perpendicular to the disc at radial velocities of up to −520 km s−1 (Barcos-Muñoz et al. 2018). This outflow was clearest in HCN (1-0), and therefore we would expect to see evidence of this outflow in cold HCN. Although our MIR absorption lines of HCN are blueshifted, the derived radial velocities are only ∼−75 km s−1. We find no blueshifted features of C2H2 or HCN at the 280−520 km s−1 outflow velocities reported by Barcos-Muñoz et al. (2018), but we note that one of relatively low column density ≲1016 cm−2 or much smaller background fraction could be buried beneath the more prominent bulk features. We also note that we do not detect any clear hot band absorption (i.e. from a higher vibrational state) for either HCN or C2H2.
3.2. Water vapour
We detect prominent rovibrational water absorption between 5 μm and 7 μm, as shown in Fig. 4. As the water lines dominate the absorption over a wide spectral region, we do not simultaneously model other species. The P branch lines at wavelengths λ>6.3 μm appear significantly weaker than the R branch lines, possibly indicative of P and R branch asymmetry (e.g. González-Alfonso et al. 2002; Buiten et al. 2024). This asymmetry arises from the fact that absorption lines into a particular vibrationally excited level are typically much stronger in the R branch than in the P branch. The P branch can thus more easily be filled in, if some emission is also present. Therefore, in all cases where such an asymmetry is found, we restricted our fits to the R branch only.
 |
Fig. 4. Spectrum around 6 μm and the best-fit H2O model for fbg = 0.35. The top panel shows the absolute flux spectrum and continuum model. The middle panel shows the continuum-normalised spectrum. Strong H2O lines are labelled by their upper- and lower-level quantum numbers as Ju,Ka,u,Kc,u−Jl,Ka,l,Kc,l. Several strong emission lines and absorption lines of C2H are labelled as well. The pink shaded area indicates the spectral region considered in the fit. The bottom panel shows the residuals on the continuum-normalised spectrum; the grey shaded area indicates their 68% interval. |
Martín et al. (2011) and González-Alfonso et al. (2012) detected lines from the H18O isotopologue in submillimetre and far-infrared rotational lines respectively. We do not unambiguously detect any lines of H O, but we note that even at the elevated H
 O abundances that have been reported for Arp 220 (González-Alfonso et al. 2012), these isotopologue features would be at most 5% deep (if fbg = 1) and largely indistinguishable from the much stronger H
 O lines. The rotational water lines at 12−26 μm, commonly seen towards Galactic protostars (Francis et al. 2024; van Gelder et al. 2024), are not detected. This non-detection is not unexpected as these MIR rotational lines trace very highly excited gas and are predicted to be much weaker than the far-infrared H2O lines, assuming the rotational temperature derived from the rovibrational band.
A complicating factor in the water spectrum is the strong contribution of PAH emission in this spectral range, in particular the feature at 6.2 μm. If this emission arises in the foreground, it fills in the absorption lines with a particular spectral shape that a scalar background fraction cannot account for. Spoon et al. (2004) noted that in the ISO spectrum of Arp 220, the PAH features are not strongly deformed by the 9.7 μm silicate absorption, implying that the PAH emission indeed originates from in front of most of the obscuring dust. Therefore, in our analysis, we assume that the PAH emission is produced in the foreground. As such, we fit a basis spline to the apparent 6.2 μm PAH feature, and subtract it before dividing out the continuum. We note that we also detect weaker PAH features at 5.25 μm, 5.43 μm and 6.02 μm (Chown et al. 2024); we do not make any correction for these features in the H2O fit. The shape of the underlying H2O ice feature is treated as continuum, as both the gas and ice features are in absorption.
The fact that the strongest H2O lines have similar absorption depths (∼30% in the R branch) suggests that some of these lines may be optically thick. We therefore estimate the velocity dispersion of the lines by leaving both the background fraction and the line width as free parameters, taking fbg>0.35 as a lower limit based on the maximum absorption depth found in this band. This approach results in a best-fit velocity dispersion of 90 km s−1, but fails to constrain the background fraction. Initially, we varied the OPR as well, but we fixed it later as we found no significant deviation from the equilibrium value of 3.
Figure 4 shows the best-fit model spectrum for fbg = 0.35. Only a single component was used in this model. Evidently, the model significantly underestimates the absorption in several R branch lines, while overpredicting most P branch lines. The failure to fit the P branch can be attributed to the P–R branch asymmetry noted above. However, the underpredicted R branch lines at 5.4−5.8 μm require an explanation. We attempted LTE models with two temperature components, but we found that an additional high-excitation component did not improve the fit. This is unsurprising, as the discrepant lines arise from low- to medium-excitation levels; in an LTE model, deep lines from these levels would therefore be accompanied by detectable additional optical depth in the low-J lines. One possible explanation is a steep negative slope with increasing wavelength of the ‘true’ background continuum: if the background fraction varies significantly over the spectral range, long-wavelength lines will be more diluted than short-wavelength ones. This scenario is possible if the background source has a temperature of Tbg≳600 K.
We further note that with the high critical densities of its rotational transitions and the wide variety of allowed radiative transitions (in the submillimetre, far-infrared and MIR), H2O is highly susceptible to far-infrared radiative excitation, which will strongly affect the population of the rotational levels. Indeed the 43,2, 33,0 and 32,1 levels, all of which have excess population with respect to the model in Fig. 4, are efficiently populated by strong far-infrared radiation, as shown by the Herschel/PACS observations González-Alfonso et al. (2012). Modelling these effects is beyond the scope of our LTE approach, and we therefore do not analyse the H2O excitation further in the present paper.
3.3. Carbon monoxide
At 4.7 μm, the fundamental band of CO is clearly detected with NIRSpec, with very prominent absorption from the J<5 levels, and higher-excitation tails extending out to J = 27, as seen in Fig. 5. However, the overall shape of the spectrum is peculiar, with a broad absorption feature visible between 4.4 μm and 4.67 μm, and irregular spacing of absorption features in the P branch beyond 4.7 μm. With no ice band known that could produce the broad shape seen in the R branch, we propose that this broad absorption is a pseudocontinuum formed by broad (∼200 km s−1) gas-phase CO lines, with possibly some contribution from OCN− ice at 4.6 μm. Similar CO-induced pseudocontinuum formation has been observed in absorption in several U/LIRGs (Onishi et al. 2024) and in emission towards the Galactic SNR Cassiopeia A (Rho et al. 2024).
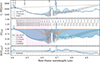 |
Fig. 5. Best-fit model spectrum for CO, extracted from an |

For the continuum estimation, we extend the 3.5–4.4 μm slope out to 5.08 μm. However, on the red side of the CO band, it is unclear where exactly the CO-induced pseudocontinuum ends, in part because the P branch is contaminated by absorption from 13CO and C18O. Furthermore, the CO fundamental band is known to show P–R branch asymmetry (e.g González-Alfonso et al. 2002; Pereira-Santaella et al. 2024a; Buiten et al. 2024), with the P branch preferentially seen in emission and the R branch in absorption. For these reasons, we restrict our spectral fit to the 4.42−4.67 μm spectral region.
We attempt to fit both a 2-component model and a 3-component model, fixing the background fraction to 1 and 0.77 to determine the minimum and maximum column densities, respectively. The radial velocities and velocity dispersions are fixed in the models; they are estimated visually through experimentation with spectral models, as there are no isolated lines available for direct measurements. We find that the model with three velocity components better represents the data; the best-fit model spectrum for fbg = 0.77 is shown in Fig. 5. In this model we assume a 60 km s−1 blueshift for the warm component, and a 60 km s−1 redshift for the cold component. We note that the relative contributions of the cold and warm component vary strongly with small changes to the assumed kinematics, and therefore the column densities inferred for them may not represent a unique solution.
The exact inferred rotational temperatures and column densities depend on the choice of continuum. Nevertheless, the overall shape of the spectrum on the R branch side, between 4.4 μm and 4.67 μm, can be reproduced well by broad (σV≈190 km s−1) lines of CO at a rotational temperature of Trot≈700 K. The obtained constraints on the CO properties are summarised in Table 1.
3.4. HCN, C2H2 and CH4 at 7 micron
3.4.1. The 7.7 μm complex
At ∼7−8 μm, the 7.7 μm PAH complex leads to a bump in the spectrum that smoothly transitions into the broad 9.7 μm silicate absorption band (see Fig. 2). In the spectrum of the WN, absorption features of several species are imprinted on top of this bump. The tail of the H2O P branch extends out to ∼7.1 μm (Fig. 4). Between 6.9 μm and 7.3 μm, we detect the HCN 2ν2 overtone band (see Section 3.4.2; Fig. 7). Further redwards, deep absorption lines appear due to the combination of CH4 and the C2H2 ν4+ν5 band, as presented in Fig. 6. The peculiar, broader feature at 7.7 μm is the Q branch of the gas-phase CH4 band combined with CH4 ice absorption, with an additional contribution from the C2H2 ν4+ν5 P branch. Finally, the 7.7–8.0 μm region contains a series of very closely spaced absorption lines produced by CS, with some contribution from the CH4 P branch.
 |
Fig. 6. Continuum-normalised spectrum between 7.2 μm and 8.1 μm versus the best-fit LTE model for fbg(C2H2) = 0.2. The model includes the C2H2 ν4+ν5 combination band, CH4 gas, and CH4 ice. Only the spectral region indicated in by the pink shaded area was included in the fit in order to avoid the effects of Pf α contamination, CS absorption, and further systematic uncertainties in the continuum estimation. The grey shaded area in the bottom panel indicates the 68% interval of the residuals. |
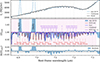 |
Fig. 7. Best-fit LTE model for the HCN 2ν2 overtone band and the interloping H2O lines at 7 μm for fbg = 1. The pink shaded area indicates the spectral region used in the fit. A simultaneously fit H2O model is also shown. The HCN overtone lines are labelled, and the residuals are shown in the bottom panel. A fiducial model of the HCN 3ν2−ν2 band, with N(HCN) = 2 × 1018 cm−2, Tvib = 330 K, Trot = 50 K, and fbg = 1 is shown in purple. The grey shaded area in the bottom panel indicates the 68% interval of the residuals. |
Our ability to draw strong conclusions on the excitation temperatures, column densities, and covering factors for these spectral bands is severely limited by several complications. First, the overlap of a number of spectral bands leads to strong degeneracies. Second, the spectrum between 7.64 μm and 8.06 μm is most likely affected by pseudocontinuum formation due to CH4 and CS absorption. Third, if a significant portion of the 7.7 μm PAH emission arises in the foreground, the shape of the perceived absorption spectrum is severely distorted, with the CH4 Q branch being more filled-in than the R branch. The latter two problems lead to considerable systematic uncertainties on the continuum estimate. We attempt to take the pseudocontinuum into account by fitting a very smooth spline to estimate the continuum. Ideally, we would model the combined dust continuum and 7.7 μm PAH complex, and subtract the latter before taking the first as our background continuum. However, this approach would introduce additional degeneracies and uncertainties, and is beyond the scope of this work. We therefore make no explicit correction for foreground PAH emission here.
We use the 7.35–7.7 μm spectrum to simultaneously fit for C2H2, gas-phase CH4, and solid CH4. For the methane ice band, we use a Gaussian with a fixed central wavelength of 1303 cm−1 (7.674 μm) and a full width at half maximum (FWHM) of 11 cm−1 (Boogert et al. 2015), and only fit for the amplitude. For the C2H2 we assume an OPR of 1.71, as determined from the 14 μm analysis; for CH4 we assume equilibrium conditions. As the C2H2 ν4+ν5 band lacks a Q branch, its background fraction is unconstrained. We therefore chose to fix the C2H2 background fraction to 1 and 0.2 here, resulting in a lower and upper limit on its column density. Only the CH4 gas background fraction is left as a free parameter.
The resulting best-fit model spectrum is presented in Fig. 6. We note that although CS absorption is clearly detected, we do not model it due to large systematic uncertainties beyond 7.7 μm. For the CH4 ice band, modelled as a simple Gaussian with unity background fraction, we derive a column density of ∼1017 cm−2.
3.4.2. The HCN overtone band
The shallow HCN 2ν2 overtone band, presented in Fig. 7, is contaminated by P branch H2O lines. To mitigate their effect on the inferred HCN column density, we simultaneously fit for HCN and H2O between 6.8 μm and 7.32 μm, masking out the strong H2 S(5) and [Ar II] lines. Here we fix the H2O background fraction and velocity dispersion to the values that were derived separately from the R branch (see Section 3.2). Similarly to our treatment of the C2H2 ν4+ν5 band, we fix the HCN 2ν2 background fraction to 1 and fbg,min = 0.1 in the fit, leading to a lower limit on the column density. The best-fit model spectrum for fbg = 1 is presented in Fig. 7.
Some residual lines remain in between the HCN overtone lines. We tentatively identify these with the HCN 3ν2−ν2 band; that is, the transitions from already vibrationally excited HCN – most likely through the strong 14 μm-pumping – to the third excited state. This is a surprising result, as we do not detect any hot band absorption at 14 μm. To assess the plausibility of this identification, we construct a fiducial model of this band based on ALMA observations of HCN and HCN−vib lines. Tunnard et al. (2015) analysed isotopologue ratios with large velocity gradient (LVG) modelling, and derived an HCN column density of 2.3×1018 cm−2, corrected for the 90 km s−1 velocity dispersion that we measure. From the HCN-vib line fluxes obtained by Martín et al. (2016) – who attempted to account for the severe line blending in the WN – and the emission size estimated by Sakamoto et al. (2021b), we can infer ν2 = 1f column densities ∼1017 cm−2. Combining these two column density estimates, we find vibrational temperatures of 300−500 K.
A fiducial model based on these estimates, with Trot = 50 K and Tvib = 330 K, is shown alongside the HCN 2ν2 + H2O fit in Fig. 7. Although the exact values for these parameters are uncertain, we find that for these credible column densities, the HCN 3ν2−ν2 R branch lines match well with the strongest residual lines observed, at a small redshift with respect to the 2ν2 lines. However, the Q branch is overpredicted, and the P branch lines do not seem to be present at all. Thus, if the identification with the HCN 3ν2−ν2 band is correct, we again observe an asymmetry between the branches, as for H2O and CO (see Figures 4 and 5). This asymmetry indicates the presence of emission, affecting the P branch most, the Q branch less, and the R branch least. While modelling of this effect requires non-LTE methods, we discuss the possible implications in Section 4.1.2.
The inferred column densities and rotational temperatures for HCN, C2H2 and CH4 in the 7 μm to 8 μm range are listed in Table 1. Even the lower limits inferred here are a factor 1.6–2.0 higher than those derived from the corresponding 14 μm bands. We reflect on this discrepancy in Section 4.1.
3.5. HNC and HCO+
The strong HCN absorption in both the ν2 and 2ν2 bands provides a compelling argument to search for its isomer HNC. HNC has its ν2 band at 21.6 μm. At this long wavelength, the MIRI MRS spectra suffer from significant fringing, even after the residual fringe correction in Stage 2 of the reduction pipeline (see Section 2). To mitigate this effect, we apply the additional 1D residual fringe correction to the extracted Channel 4B spectrum. The last remaining fringes are taken into account in fitting the continuum by first smoothing the spectrum with a Gaussian filter, and fitting a spline to the smoothed spectrum. The resulting spectrum, shown in Fig. 8, reveals a clear detection of not only the HNC Q branch, but five R branch lines as well. This combination of branches allowed us to constrain the background fraction.
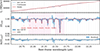 |
Fig. 8. Spectrum at 21 μm (blue) and best-fit model for HNC (red). The pink shaded areas indicate the spectral region used in the fit. The residuals are shown in the bottom panel, with the 68% interval indicated by the grey shaded area. |
We estimated the radial velocity of the HNC gas by direct measurement from the R(1)–R(4) lines. We find that they are all consistent with the systemic redshift of the WN zWN = 0.01786 (Sakamoto et al. 2009), except for the R(2) line, which appears to be redshifted by ∼100 km s−1. In the spectral models, we fix the radial velocity to zero. The velocity dispersion is included in the fit as a free parameter to account for broadening due to optical depth. We fit a single-component LTE model to a selected spectral region with the clearest HNC features, masking out the noisy R(0) line. The best-fit model is presented in Fig. 8. We find a rotational temperature of Trot = 38±4 K, roughly equivalent to the cold HCN component, and a remarkably low background fraction of fbg = 0.06±0.02. However, we note that the R(0e) and R(1e) lines are not well-fit by this model. Given the limited data quality at these long wavelengths, we do not attempt to fit for a second component.
The inferred HNC column density is 3×1016 cm−2. Given the similar rotational temperatures, we assume that the observed HNC traces the same gas as the cold HCN component observed at 14 μm, resulting in a column density ratio N(HCN)/N(HNC)≈8. If we instead take the HCN column density range derived from the overtone band, we find N(HCN)/N(HNC) = 16−220. Regardless of the HCN measurement used, we do not find HNC enhancement.
Another species of interest is HCO+. The submillimetre HCN/HCO+ line ratios have been proposed to be an AGN indicator (e.g. Kohno et al. 2001; Krips et al. 2008; Imanishi et al. 2009; Manohar & Scoville 2017; Butterworth et al. 2022; Nishimura et al. 2024). HCO+ has its strongest rovibrational band at 12.1 μm. We investigate this spectral region, and find a small apparent 1% dip at the wavelength of the HCO+ Q branch, as shown in Fig. 9. However, the absorption depth is similar to that of unexplained noise peaks in this region, making it difficult to solidly identify it with HCO+. The 11.8 μm–12.6 μm is shown alongside a fiducial HCO+ model in Fig. 9. We note that the lack of a clear HCO+ detection implies a relatively low column density compared to that of the dominant 50K HCN component, with an abundance ratio HCN/HCO+≳50.
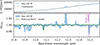 |
Fig. 9. Fiducial model for the tentative HCO+ band at 12.1 μm. This model has a temperature of T = 50 K, a column density of N(HCO+) = 5×1015 cm−2, a velocity dispersion of σV = 75 km s−1, and a background fraction of fbg = 0.28, matching that found for HCN and C2H2 at 14 μm. The detected ν4 band of protonated hydrogen cyanide is indicated as well. |
At 12.5 μm, we find a deeper absorption feature, which we attribute to the Q branch of the HCNH+ ν4 band (Tanaka et al. 1986). Protonated hydrogen cyanide is a direct precursor of both HCN and HNC, and its only previous extragalactic detection was through a rotational line in the nearby starburst galaxy NGC 253 (Harada et al. 2024). In the absence of an available line list for the ν4 band, we cannot derive a column density or temperature from this band, but we note that the lack of a blue wing to the Q branch is suggestive of a relatively low rotational temperature (Trot≲100 K).
3.6. C2H and NO
On the far blue end of the H2O band (at 5.4 μm; see Figures 4 and 10), we find a series of regularly spaced absorption lines. We identify these lines with NO and C2H. As their bands overlap, we fit a model for these two species simultaneously, masking out the strong [Fe II] and H2 S(7) emission lines and several H2O absorption lines. The continuum is affected by weak PAH emission peaks at 5.25 μm and 5.535 μm; both of these bands have recently also been detected in the Orion Bar (Chown et al. 2024). Assuming that this emission fully arises in the foreground, we subtract it from the observed spectrum before dividing out the continuum. We cannot constrain the background fraction here as the NO Q branch completely overlaps with the [Fe II] line; therefore, we fixed the background fraction to 1 and 0.2 to find the lower and upper limits to the column density. For both species, we take a radial velocity of −50 kms−1 and a velocity dispersion of 75 kms−1. The best-fit model for fbg = 1 is shown in Fig. 10.
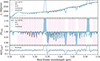 |
Fig. 10. Best-fit LTE model for NO and C2H at 5 μm, with fbg = 1. The top panel shows the absorption model with the continuum and PAH emission, the middle panel shows the absorption spectrum, and the bottom panel shows the residuals on the absorption spectrum. Pink shaded areas indicate the spectral regions used in the fit. The grey shaded area in the bottom panel indicates the 68% interval of the residuals. All model spectra are rebinned onto the spectral axis of the observed spectrum to enable a more precise visual comparison to the data. |
4. Discussion
4.1. Emission effects
4.1.1. Interpretation of the background fraction
Although we can only constrain the background fraction fbg for bands with clearly saturated features (i.e. HCN, C2H2, HNC, and to a lesser extent CH4 and H2O; see Figures 3, 4, 6, and 8), the inferred values have interesting implications. First, we note that where constrained, the values are decidedly below unity, suggesting that overall there is considerable foreground dust adding to the total continuum flux and diluting the detected absorption signal. Second, we find a particularly low background fraction of only fbg = 0.06 for HNC at 21.6 μm, our longest-wavelength band.
We propose the following scenario to explain these two observations: the background continuum against which most of the molecular absorption features arise is that of an embedded hot T∼500−1000 K dust component, for which the flux decreases with increasing wavelength at λ≳3−6 μm. The observed continuum, however, rises up to λ∼100 μm, due to the contribution of cooler dust, which becomes dominant for λ≳8 μm (Armus et al. 2007). The relative contribution of this cool component increases with wavelength, resulting in more dilution of the absorption at longer wavelengths and hence a lower derived background fraction. This hypothesis also offers a natural explanation for the non-detection of CO2 ice at 15 μm, despite the strength of the corresponding band at 4.2 μm (Perna et al. 2024, see also Fig. 2).
To illustrate this mechanism, we construct a toy model where the observed continuum consists of a hot 1000 K background blackbody and a cool 1000 K foreground modified blackbody. The foreground dust both attenuates the background and produces emission itself. A shell of molecular gas is located in between the hot background and the cool foreground. In the following we consider HCN gas in this intermediate layer, adopting a column density of N(HCNν2 = 0) = 2×1018 cm−2, a vibrational temperature of Tvib = 440 K, and a rotational temperature of Trot = 150 K, based on independent submillimetre studies (see Section 3.4.2). The optical depth of the foreground dust is parametrised by a power law τd=(λ/λ0)−β, with index β = 1.8 and reference wavelength λ0 = 25 μm, where the dust becomes optically thick. This scenario and its associated continuum spectrum are illustrated in Fig. 11. In this simple toy model, we do not include silicate features or PAH bands.
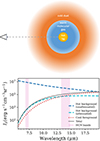 |
Fig. 11. Top: Schematic illustration of the proposed line-of-sight geometry. The molecular gas is embedded in cool dust that produces significant foreground emission, filling in the features produced by absorption of hot background photons. Bottom: Expected continuum spectrum for a toy model consisting of a 1000 K background blackbody and a 100 K foreground modified blackbody. |
As the hot background spectrum is bluer, it can dominate the total observed continuum at 7 μm, while contributing only a small fraction at 14 μm, depending on the exact optical depth spectrum of the foreground dust and the beam filling factors of both dust components. If we now consider the HCN ν2 and 2ν2 bands, we find that relative to the total observed continuum, the 7 μm 2ν2 band does not noticeably change, while the 14 μm ν2 band is diluted considerably. This effect is demonstrated in Fig. 12. However, even for fbg = 1, the column densities derived from the HCN and C2H2 bands at 7 μm still exceed those derived from the 14 μm bands by a factor 2 (see Table 1 and Sections 3.1, 3.4.1 and 3.4.2), so foreground dust continuum alone cannot account for this discrepancy.
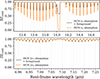 |
Fig. 12. HCN ν2 and 2ν2 absorption bands relative to the observed continuum in the toy model of Fig. 11). A column density of 2×1018 cm−2 and a rotational temperature of 150 K were used. |
For similarly obscured starburst galaxies, spectral decompositions using various codes have demonstrated that much of the apparent continuum from 5−9 μm consists of broad overlapping PAH profiles (e.g. Smith et al. 2007; Lai et al. 2022; Donnan et al. 2024). If this emission arises largely in the foreground, the background fraction we derive is suppressed at these wavelengths. The strong 7.7 μm PAH features further complicate the analysis, as they fill in the CH4 Q branch much more than the corresponding R branch lines, severely distorting the absorption spectrum and thereby decreasing the inferred background fraction. As such, all properties derived from the C2H2 ν4+ν5 and CH4 bands should be treated with caution.
4.1.2. Potential molecular line emission
Throughout our analysis, we have assumed that the lines are pure absorption lines. In the following we consider the effects of possible molecular line emission partly filling in the absorption lines, in the context of the toy model described in Section 4.1.1.
Both line emission and foreground continuum emission can suppress absorption features; these effects are degenerate unless the line emission overtakes the background continuum. All rovibrational bands studied in this work appear in absorption: across the full spectral range, the incident continuum radiation is more intense than the molecular line emission. However, if the background continuum is not completely dominant, hidden line emission partially fills in the absorption features. In this case, the background fraction derived from optically thick features, under the assumption of pure absorption, is an underestimate, as the absorption floor would be deeper in the absence of line emission. Nevertheless, the high vibrational temperatures (Tvib≳200 K) required to produce appreciable rovibrational emission can only be achieved in the presence of a strong local MIR radiation field. Thus, any molecular gas for which line emission affects our analysis, must still be located close to the nucleus.
Whether a rovibrational line is observed in emission or absorption is determined by the competition between the intensity of a blackbody at the vibrational temperature of the gas on the one hand, and the strength of the true background continuum on the other. If the incoming radiation is that of an unattenuated hot blackbody with Tbg>Tvib, this competition is more easily won by emission at long wavelengths. Thus, in the proposed scenario (Tvib≈400 K; Tbg≳500 K), we expect any line emission effects to be much greater at 14 μm than at 7 μm. This mechanism could explain the discrepancy in column densities found for HCN and C2H2 between their fundamental and overtone/combination bands: the short-wavelength bands are almost unaffected by emission, while the long-wavelength bands are partially filled in. Additionally, if the vibrational temperature is higher than the rotational temperature, our LTE fits of the absorption bands underestimate the total column density, because the excess population in higher vibrational states is not considered. Both of these effects may play a role in reducing our inferred column densities and producing the apparent discrepancy between 7 μm and 14 μm.
The tentative detection of the HCN 3ν2−ν2 hot band (Section 3.4.2) can be explained in a similar fashion. Depending on the exact beam filling factors, temperatures and column density, it is possible to fill in all detectable 2ν2−ν2 absorption at 14 μm while leaving the 3ν2−ν2 hot band almost unchanged. An example is shown in Fig. 13. We note that the tentatively detected 3ν2−ν2 hot band displays a prominent R branch, weak Q branch and no obvious P branch. As noted in Section 3.2, this branch asymmetry reveals the presence of emission filling in the absorption lines, with the strongest effect on the P branch, weaker effect on the Q branch and the weakest effect on the R branch. Emission from the ν2 = 3 level (3047 K above the ground state) could reveal the presence of a very hot radiation field populating the ν2 = 3 level. However, quantitative modelling of this situation requires a sophisticated non-LTE approach and a detailed treatment of all emission effects, which is beyond the scope of the present paper.
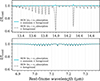 |
Fig. 13. HCN 2ν2−ν2 and 3ν2−ν2 hot bands relative to the observed continuum in the toy model of Fig. 11 for both a pure absorption model and a model including both absorption and emission. A column density of 2×1018 cm−2, a rotational temperature of 150 K, and a vibrational temperature of 440 K were used. The modelled 14 μm absorption is completely filled in by line emission, while the 7 μm band is almost unchanged. |
In summary, the variety in inferred background fractions, the difference in column densities between the 7 μm and 14 μm bands of HCN and C2H2, and the potential HCN hot band detection at 7 μm without the corresponding 14 μm hot band can all be naturally explained if the background continuum that produces the molecular absorption features is that of a hot central source. The implication is that the bulk of the molecular gas is located deep inside the nuclear region, embedded in the cooler dust that produces most of the bolometric luminosity. This physical concept is illustrated in Fig. 11. We further emphasise that despite our treatment of the background fraction, our LTE pure absorption analysis may still underestimate the column densities if the vibrational temperatures are high.
4.2. Properties of the embedded molecular gas
We detect a number of species in the gas phase, for which we derive different rotational temperatures, as summarised in Table 1. As discussed in Section 4.1, the inferred background fraction is below unity wherever it is constrained, suggesting that the bulk of the molecular gas is located behind large amounts of cooler dust and must therefore be close to the nucleus itself. We stress that for this nuclear gas, the inferred rotational temperatures may not reflect the actual gas temperatures. Both subthermal excitation and radiative excitation may play a role, particularly for species with high (rotational) critical densities. Nevertheless, the rotational temperature offers a useful way to categorise our detections.
We distinguish four groups based on rotational temperature: cold Trot≲60 K gas (CO, HCN, CO2, NO, HNC); moderately warm Trot∼150 K gas (CO, C2H2, HCN, C2H); and warm Trot∼300 K gas (H2O, CH4, HCN). The CO fundamental band is dominated by a hot 650 K component, and it is the only band for which we derive such a high temperature. Given the combination of a high temperature and broad (σV≈190 km s−1) line widths, and the similarity to the CO band detected towards the Galactic SNR Cas A (Rho et al. 2024), we posit that this gas is most likely shocked. We note that the contributions of the two other CO components are largely degenerate, and therefore the column densities and excitation temperatures derived for the cold and warm CO suffer from large systematic uncertainties.
All species detected with cold rotational temperatures are simple molecules that can form efficiently in the gas and/or sublimate from ices. CO is ubiquitous in the nuclear region of Arp 220, as confirmed by its large emission size in high-resolution ALMA studies (Sakamoto et al. 2021b), and can trace molecular gas in almost any physical environment. For HCN and HNC, the low-J levels are possibly subthermally excited, as they have high critical densities (ncrit(HCN)∼106−107 cm−3) and do not couple to the radiation field as easily as the high-J levels.
The molecular ions detected in this work – N2H+, HCO+ and HCNH+ – do not have well-constrained rotational temperatures. However, their Q branches appear to be symmetric, and we therefore tentatively grouped them under the cold components. The cosmic ray ionisation rate (CRIR) in the WN of Arp 220 is orders of magnitude above the Milky Way average (Pereira-Santaella et al. 2024b), so fairly large columns of molecular ions are not unexpected.
Several species are detected with a moderately warm T∼150 K rotational temperature, without a clear colder component. C2H2 in particular has a well-constrained excitation temperature of 150−180 K in both detected bands. Its direct parent species C2H is found at a similar rotational temperature. C2H2 has no allowed rotational transitions, so its rotational temperature probes either the gas temperature or the local 7−14 μm radiation field. C2H has rotational critical densities of ≳106 cm−3 (Nagy et al. 2015), so we consider it likely that radiative excitation plays an important role for this molecule.
A moderately warm 110 K component is found for HCN in the 2ν2 overtone band at 7.1 μm. Given the many processes capable of forming HCN, its appearance in a moderately warm phase is not surprising, and the HCN overtone band may trace the same gas as the C2H2. Alternatively, the 50 K and 330 K HCN components identified at 14 μm could be blended into one apparent 110 K component in the overtone band, depending on their true column densities and background fractions at 7 μm. Due to the limited absorption depth and the contamination in this band, we did not attempt to fit for more than one HCN component here.
The warm components of H2O, CH4 and HCN stand out. For H2O, LTE models could not sufficiently reproduce the observed spectrum, and the derived excitation temperature should be interpreted with caution; for HCN, however, a 330 K component with N(HCN)≥1×1017 cm−2 is decidedly needed to account for the blue wing of the Q branch. These high-J levels (J≳10) are most likely radiatively excited. Unlike HCN, CH4 only appears in a warm Trot≈300 K component, although its exact rotational temperature is uncertain due to the strongly peaked PAH feature its band lies on top of. Like C2H2, methane lacks a permanent dipole moment and must therefore probe either the kinetic gas temperature or the local radiation temperature at 7.7 μm.
4.3. A multi-wavelength view of HCN in Arp 220
The molecular gas in Arp 220 has been extensively studied, from centimetre wavelengths to the mid- and near-infrared. In general, emission line studies with single-dish telescopes derive lower column densities than we do, due to their large beam sizes. Even with interferometers and at the highest resolutions, it is challenging to separate relatively cool, more extended gas from the warm gas in the inner nucleus through rotational emission lines. Absorption studies, on the other hand, benefit from the pencil beam effect, restricting detection of gas to a narrow line of sight towards the compact effective background source. In the following, we therefore compare our derived molecular gas properties to other works that were able to probe the compact inner region. The focus of this discussion is on HCN, as this species has been especially well-targeted in previous observations of Arp 220.
The C2H2, HCN and CO2 absorption bands at ∼14 μm were previously detected in the Spitzer IRS spectrum of Arp 220 (Lahuis et al. 2007). These observations could not separate the two nuclei, and the spectral resolution was too low to detect the individual P and R branch lines. The Q branches of all three species were analysed together, assuming LTE conditions, a single common excitation temperature, and a unity covering factor. Lahuis et al. (2007) derived an excitation temperature of 250 K, with an uncertainty of up to 30%. They found column densities of 1.7×1016 cm−2, 2.9× 1016 cm−2 and 0.7× 1016 cm−2 for C2H2, HCN and CO2 respectively.
The column densities inferred here for the WN are an order of magnitude higher than previously reported. This difference is caused by a combination of effects. First, with the MIRI MRS, we can now resolve out the two nuclei of Arp 220 and thus remove contaminating continuum emission from the EN. Second, the clear detection of P and R branch lines of both C2H2 and HCN, and the saturation of the Q branches, now lifts the degeneracy between column density and covering factor/background fraction. Despite the removal of the EN, we still find a background fraction of only fbg = 0.28, and so the true optical depth of the lines is much higher than previously thought. Using the same methods as Lahuis et al. (2007), we now derive abundances of ∼10−6 for C2H2 and HCN, and ∼10−7 for CO2.
The excitation temperature derived by Lahuis et al. (2007) was highly uncertain due to the limited spectral resolution of the Spitzer IRS. With MIRI MRS, however, the improved spatial and spectral resolving power allows us to decouple the rotational temperatures of the three species and puts much tighter constraints on them. The velocity dispersion and radial velocity can also be directly measured from the individual lines, removing a source of systematic uncertainty in the modelling. We find that lower rotational temperatures dominate the signal (50 K for HCN and 150 K for C2H2), but with a necessary additional 330 K HCN component.
This rotational temperature was also derived from high-J rotational lines seen in absorption with Herschel/SPIRE (Rangwala et al. 2011), although they inferred a much lower column density of N(HCN) = 2× 1015 cm−2. Given the two HCN components we find at 14 μm, the high-J lines probed by Rangwala et al. (2011) should be completely dominated by the Trot∼300 K component, and therefore their rotational temperature is entirely consistent with our results. Their lower derived column density is likely a result of contaminating emission from both the EN and cool foreground dust. Indeed, using a more complex model involving multiple continuum sources, González-Alfonso et al. (2012) infer much higher column densities of N(HCN)∼1017−1018 cm−2, consistent with our findings.
HCN absorption has also been seen in direct l-type transitions in the ν2 = 1f J = 4 and J = 6 levels at centimetre wavelengths. These suggest a rotational temperature of Trot∼150 K (Salter et al. 2008). However, these lines show evidence of several velocity components that are not taken into account, and the two nuclei were blended together in their Arecibo observations.
Vibrationally excited HCN has been proposed as a way to isolate the inner nucleus in emission studies. A strong MIR radiation field is required to populate these levels, and the subsequent HCN-vib rotational emission lines therefore only arise in the most compact, dense, and/or warm regions (e.g. Aalto et al. 2015; Martín et al. 2016). Towards Arp 220, such lines have been detected for HCN and HC3N, and Sakamoto et al. (2021b) used a high-resolution ALMA spectral scan to confirm the relatively compact emission sizes of vibrationally excited species. ALMA observations of the HCN ν2 = 1f J = 3−2 and J = 4−3 emission lines indicate a rotational temperature of 38 K in the WN (Martín et al. 2016). For vibrationally excited HC3N, of which many more transitions have been detected, Martín et al. (2011) derived a rotational temperature Trot∼350 K, closer to the warm HCN component identified in the present work.
In the 14 μm Q branch, the 330 K component is dominant for J≥10. For these high levels, the rotational critical densities exceed 108 cm−3. Although the effective critical density will be reduced through photon trapping, for these high values it is unlikely that the levels are collisionally excited. It is more probable that the 330 K rotational temperature is driven by the local radiation field, either through the rotational transitions or through the 14 μm pumping. Rangwala et al. (2011) argue for MIR pumping, requiring a local radiation temperature of Trad,14 μm>350 K. González-Alfonso et al. (2012) instead find far-infrared radiation to dominate the high-J levels, but we make note of the dependence on their choice of dust and gas distribution.
The importance of the vibrational and rotational radiative excitation processes for populating the levels depends on the product of the Einstein A coefficient and the photon occupation number nγ at the transition frequency (see Buiten et al. (2024) for details). For the rovibrational lines at 14 μm, the Einstein A coefficients are Arovib∼1 s−1, and the product Arovib×nγ(14 μm) depends only on the radiation temperature and the dilution factor; it is almost constant across J-levels. The rotational transitions, however, lie at a wide range of frequencies, and the strength of the rotational radiative excitation therefore varies between levels. Their Einstein A values range from 2×10⁻⁵ s−1 for J = 1−0 to 0.5 s−1 for J = 25−24.
Considering again the structure of the toy model sketched in Fig. 11, suppose the local radiation field at the position of the warm molecular gas is entirely dominated by the geometrically diluted but unattenuated hot Td≳500 K background component identified by Sakamoto et al. (2017). For such a blackbody, the rotational pumping rate will be higher than the vibrational pumping rate for J≥9; we thus expect rotational radiative pumping to dominate the rotational temperature of high-J levels. In that case, we can derive the dilution factor fD directly from the rotational temperature Trot and the background temperature Tbg:
 (1)
(1)
Here, Eul is the energy difference between the levels and kB is the Boltzmann constant. For Trot = 330 K and 600 K<Tbg<1500 K, we find dilution factors fD = 0.2−0.5. This result is consistent with the picture that the molecular gas seen in absorption is located at or near the edge of the optically thick background source. The gas cannot be fully embedded in the hot dust itself, as the dilution factor is decidedly below unity, but it must be close to it for the radiation field to still set the rotational temperature to a relatively high 330 K. We therefore propose that the absorbing molecular gas we detect in the MIR is located either in an outer layer of the ∼10 pc nucleus identified by Sakamoto et al. (2017) or in the inner regions of the starburst disc (see Section 4.5).
4.4. A hot-core-like chemistry
The wide variety of molecular species detected in this work and the high signal-to-noise (S/N) ratios on their features provide several new insights into the chemistry of the WN. In the following we characterise this chemistry. Given the extraordinarily high optical depths derived for the WN of Arp 220, as well as the layered structure of the dust continuum, it is unclear whether the 9.8 μm silicate depth is a good indicator of the total H2 column density traced by the various molecular absorption bands. We therefore refrain from presenting abundances with respect to H2 for these species. Instead, we consider column density ratios between the species studied in this work and compare these to abundance ratios predicted by chemical models. However, we cautiously note that the medium is not uniform along the line of sight, and thus the column densities of different species may be dominated by different physical environments. We further emphasise that the derived rotational temperatures do not necessarily reflect the temperature of the gas.
We find the highest column densities for CO and H2O: both have components with column densities ∼1019 cm−2. CH4, HCN, C2H2, C2H and NO are all found with column densities 10–100 times smaller. This implies elevated abundances: in cold gas, HCN and C2H2 are typically 10−4 times as abundant as CO. We find considerably lower column densities for HNC, CO2, N2H+, and our tentative HCO+ and HC3N detections, with ratios to CO of ∼10−3,10−3,10−4,10−4 and 10−3, respectively.
The chemical footprint of the WN is remarkably similar to that of Galactic hot cores; this resemblance is a common feature of compact obscured nuclei (CONs; e.g. Lahuis et al. 2007; Aalto et al. 2015; Falstad et al. 2015; Costagliola et al. 2015; Gorski et al. 2023). In hot core envelopes, ice evaporation and warm gas-phase chemistry can efficiently produce C2H2, HCN and CH4, enhancing their gas-phase abundances by orders of magnitude at temperatures T>200 K (e.g Doty et al. 2002). While Galactic massive protostellar objects often show particularly elevated CO2 abundances due to its efficient formation through a reaction between CO and OH (e.g. Boonman et al. 2003; Francis et al. 2024), the CO2 column density derived here for the Arp 220 WN is an order of magnitude lower than that of HCN and C2H2. This suggests that the gas temperature is T>250 K, at which temperature OH is rapidly driven into H2O, blocking the main gas-phase formation route of CO2 (e.g van Dishoeck et al. 2023). The large columns of H2O detected in this work are further evidence of this scenario.
The temperatures inferred, however, are lower than those required to efficiently produce the derived density ratios. C2H2, which is expected to be collisionally excited as it has no radiative pure rotational transitions, is found at only Trot≈150 K. We do derive Trot≈300 K for CH4, but we do not consider this measurement reliable due to the overlap of this band with the 7.7 μm PAH complex (see Sections 3.4.1 and 4.1.1). Lahuis et al. (2007) suggested that the HCN, C2H2 and CO2 abundances could be produced in hotter (≳800 K) gas, which is then diffused to cooler layers by winds or turbulent motions. This mechanism requires the chemical timescale to be longer than the mixing timescale. However, under the greatly enhanced CRIR measured for the Arp 220 WN (Pereira-Santaella et al. 2024a), the chemistry is expected to be rapid. Furthermore, the higher column densities derived in the present work translate to a larger path length than estimated by Lahuis et al. (2007). Thus, we consider it unlikely that the hot gas can be transported to cooler regions sufficiently rapidly to fully explain the observed chemical signature.
Shocks could also play a role in decreasing the CO2 abundance. Charnley & Kaufman (2000) demonstrated that C-type shocks can efficiently destroy CO2 to form CO, H2O and OH. In these models, the [H2O]/[CO] abundance ratio stabilises at ∼1 in the post-shock gas, similar to the column density ratio we derive for the Arp 220 WN. If this shocked gas subsequently collapses to form protostars and undergoes hot core chemistry, the CO2 abundance will increase again but will not reach the high levels predicted for pure hot core chemistry. In a merger, where large amounts of gas are driven into the nucleus, this scenario is not unexpected. Evidence of shocks in Arp 220 is plentiful: several lines of SiO have been detected towards the WN (e.g. Wheeler et al. 2020; Sakamoto et al. 2021b), the starburst discs contain numerous SNRs, and we attribute the Trot≈700 K, σV≈190 km s−1 CO component found in this work to shocks as well. We therefore conclude that this combination of shocks and high-mass star formation may be responsible for the comparative lack of CO2 found in Arp 220 and other U/LIRGs (Lahuis et al. 2007).
Another striking similarity to hot cores is found in the ortho-to-para ratio of C2H2, for which we have tight constraints due to the high-S/N detection of individual R and P branch lines in the ν5 band. This OPR of 1.71±0.05 is decidedly below the value of 3 expected for gas in equilibrium at high temperatures, but it coincides with those found for the Orion IRc2 and AFGL 2136 IRS1 hot cores (Rangwala et al. 2018; Barr et al. 2020). In Orion IRc2, the low OPR was proposed to be a remnant of an earlier cold phase, as gas-phase reactions are slow to change the OPR.
Contrary to Aalto et al. (2007), we find an HCN/HNC ratio of 10−102, well above unity. This result suggests that the reported overluminous HNC is an excitation effect rather than a sign of X-ray driven chemistry. For the center of the starburst galaxy NGC 253, Behrens et al. (2022) derived HCN/HNC ratios much closer to unity, which they attributed to the efficient formation of both species from HCNH+ at very high cosmic ray ionisation rates (CRIR). As the CRIR in the WN of Arp 220 is similarly high (Pereira-Santaella et al. 2024b), the high HCN/HNC could indicate that mechanical heating plays a role in the chemistry (e.g. Meijerink et al. 2011). This picture is consistent with our hypothesis that both shocks and high-mass star formation are relevant chemical drivers in the WN of Arp 220.
4.5. The geometry of the western nucleus
High-resolution radio and (sub)millimetre studies have led to a detailed a picture of the structure of the WN. SNe, dust continuum, and molecular lines all trace an inclined, rotating starburst disc with a major axis size (FWHM) of ∼100 pc (Varenius et al. 2019; Barcos-Muñoz et al. 2015; Scoville et al. 2017; Sakamoto et al. 2017, 2021a). At the centre of the disc, molecular rotational lines exhibit narrow absorption features, and the continuum shows a more symmetric hot dust peak with a FWHM size of ∼20 pc and significant opacity up to wavelengths of ∼3 mm (Scoville et al. 2017; Sakamoto et al. 2017). We interpret this additional component as a distinct opaque inner nucleus. A fast molecular outflow, spanning ∼200 pc across in projection, was identified by Barcos-Muñoz et al. (2018); it has a blueshifted lobe to the south of the nucleus and a redshifted lobe to the north. This biconical outflow appears to be normal to the disc in the plane of the sky.
The ratio of the major and minor axis of the disc suggests an inclination of ≳52° (Barcos-Muñoz et al. 2015; Sakamoto et al. 2017). However, there is no clear consensus as to the direction of the disc tilt: infrared observations suggest that the north side of the disc is facing us (Scoville et al. 1998; Van der Werf et al., in prep.), while millimetre studies find the opposite (Tunnard et al. 2015; Sakamoto et al. 2021b). Likewise, the inclination of the outflow is not well-constrained, and it is unclear whether it is normal to the disc or slanted. In the following discussion, we adopt the interpretation of Sakamoto et al. (2021b), who argue for an outflow orientation perpendicular to the disc, with the south side of the disc facing us. This configuration is illustrated in Fig. 14.
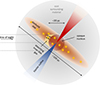 |
Fig. 14. Schematic illustration of the proposed geometry of the WN along the line of sight. Following the interpretation of Sakamoto et al. (2021b), we assumed that the south side of the disc faces us with an inclination of i≈60° and that the biconical outflow is normal to the disc. The direction of the tilt is debated (Scoville et al. 1998; Van der Werf et al., in prep.), but we note that it does not affect the interpretation of the absorption bands in this work. |
Estimates of the geometric thickness of the disc are limited. Scoville et al. (2017) use kinematic modelling of CO (1-0) emission to calculate the disc thickness as a function of radius for the case of a fully self-gravitating disc. However, they assume an inclination of only 30°, underestimating the effect of outflowing material on the measurement of the minor axis size. Correcting for the inclination, we obtain a mean disc thickness of ∼20 pc (FWHM) – approximately the size of the inner nucleus. This estimate suggests that the inner core is (nearly) entirely embedded in the surrounding starburst disc, as sketched in Fig. 14.
Under the assumption that the opaque nucleus is the dominant background source for our MIR absorption bands, Fig. 14 illustrates that only a small fraction of the disc falls within our detection beam. We estimate the path length along which we detect our warm molecular gas through from the derived HCN column density of 1017−1018 cm−2. In the warm gas, the HCN abundance is likely elevated; González-Alfonso et al. (2012) derive an abundance XHCN∼10−6, and this abundance is also commonly found in Galactic hot cores (e.g. Boonman et al. 2001; Barr et al. 2020; van Gelder et al. 2024). Our measured HCN column density then translates to an H2 column density of 1023−1024 cm−2. Though high, this falls short of the highest column densities of 1026 cm−2 estimated for the opaque nucleus by two orders of magnitude, corroborating the picture that we do not see into the nucleus. The gas density is estimated at 105−106 cm−3 (Scoville et al. 2015; Tunnard et al. 2015); the implied average path length is then 0.1−10 pc.
We propose the following picture for the origin of the observed MIR absorption features: the ‘moderately warm’ and ‘warm’ molecular gas is located in the inner regions of the starburst disc and externally irradiated by the Td≳500 K nucleus, causing significant radiative excitation in the case of HCN and H2O. In these inner regions, CO2 is so depleted through previous shocks that we only observe it in colder, shielded regions in the midplane of the disc, where the detected ices are also protected from evaporation. The detected Trot≈700 K CO, with high velocity dispersion, is located in shocked regions of the disc affected by SNRs.
The geometry of the WN as sketched in Fig. 14 also demonstrates an explanation for the non-detection of the outflow in our MIR spectrum. The mass and size presented for the southern lobe by Barcos-Muñoz et al. (2018) suggest an average HCN column density of 6×1016 cm−2 – slightly above the detection limit indicated by our spectral models. However, the outflow covers only a small fraction of the opaque nucleus in the plane of the sky, suppressing any absorption lines through continuum emission from the uncovered part of background source. From the observation that the extreme blueshift is only seen south of the nucleus, the covering factor is at most fcov<0.5, even if the opening angle is wide or the outflow is slanted. As a result, combined with the effect of foreground dust emission described in Section 4.1, the MIR absorption of this fast outflow is not detected.
5. Summary and conclusions
In this work, we studied the WN of Arp 220 using MIRI/MRS and NIRSpec/IFU spectroscopy. Owing to the leap in sensitivity and spatial and spectral resolution brought by JWST, we were able to detect rovibrational absorption bands of 14 distinct molecular species in a narrow line of sight towards the opaque 20 pc nucleus and perform a detailed analysis of the strongest features. Using LTE spectral models, we characterised the column densities and excitation of this molecular gas and reached the following conclusions:
-
Optically thick features of C2H2, HCN, and HNC indicate that a considerable fraction of the observed continuum emission does not pass through the absorbing molecular gas, particularly for HNC at 21 μm. The implication is that the bulk of this gas must be hidden behind large columns of cooler dust, with the associated foreground continuum emission diluting the absorption signal. When we account for this effect, we derive HCN, C2H2, and CO2 column densities an order of magnitude above the previous MIR estimates (Lahuis et al. 2007, Sections 3.1, 4.1.1). We note that these column densities may still be underestimates if the vibrational temperatures are higher than the derived rotational temperatures (Section 4.1.2).
-
We find two temperature components for HCN. The warm 330 K component is radiatively excited, most likely through its far-infrared rotational transitions, and it probes the local radiation field. This excitation can be produced by a postulated unattenuated 600−1500 K blackbody under a dilution factor 0.5-0.2. The implied H2 column density is of the order of 1024 cm−2. We therefore propose that the detected HCN is located in the inner regions of the 100 pc circumnuclear starburst disc directly surrounding the optically thick 20 pc Td≳500 K background source identified by Sakamoto et al. (2017) (Sections 4.3 and 4.5).
-
The fast collimated molecular outflow found in submillimetre studies (Barcos-Muñoz et al. 2018) is not detected in the MIR despite the fact that the implied average column density is above our detection limit. We attribute this non-detection to a dilution of the absorption signal, as the blueshifted southern lobe covers only a small fraction of the opaque nucleus in the plane of the sky (Section 4.5).
-
The molecular footprint probed by the MIR absorption bands resembles that of a hot core with additional evidence of shocks. In particular, the HCN/HNC ratio is well above unity and favours a hot core chemistry over X-ray-driven chemistry. We also obtained the first extragalactic measurement of the C2H2 ortho-to-para ratio, finding a decidedly non-equilibrium value of 1.71±0.05. This value is remarkably consistent with measurements in hot cores (Rangwala et al. 2018; Barr et al. 2020, Section 4.4).
-
We detected large columns of CO at a rotational temperature of Trot≈700 K and with extremely broad lines (σV≈190 km s−1. CO has the highest rotational temperature and velocity dispersion in our sample of rovibrational bands, and we attribute this to shocks induced by SNe in the starburst disc (Sections 3.3 and 4.5).
-
Although we find evidence for considerable radiative excitation and line emission from vibrationally excited states, the inferred radiation temperatures do not evidently require the presence of an AGN. The detected molecular gas is located outside the central Td≳500 K radiation source, so we do not pierce deeply into the inner nucleus. The chemical footprint of the detected gas also shows no evidence of being influenced by X-rays from an obscured AGN, despite the proximity of this gas to the hot central source.
The JWST IFU observations of the WN of Arp 220 demonstrate the immense power of MIR molecular absorption bands to probe and characterise the central concentrations of molecular gas in compact obscured nuclei. With its exceptional data quality, the extracted Arp 220 spectrum presented here may serve as a guide for similar studies of other U/LIRGs. Our analysis has shed new light on both the chemistry and excitation of the gas as well as its embedded location in the dust distribution. We have found no unambiguous evidence for the presence of an AGN, and the absorbing molecular gas appears to trace an extreme, deeply buried nuclear starburst. Future detailed modelling of the chemistry and the radiative excitation is needed to determine whether all observed characteristics presented in this work can be achieved by pure star formation in the opaque 20 pc background source.
Acknowledgments
We thank the anonymous reviewer for their helpful suggestions. We are grateful to Santiago Arribas for help with the NIRSpec data. We thank Susanne Aalto, Loreto Barcos-Muñoz, John Black, George Rieke, Nick Scoville, and Henrik Spoon for helpful discussions. S.V. acknowledges support from the European Research Council (ERC) Advanced Grant MOPPEX 833460. AAH and LHM acknowledge support from grant PID2021-124665NB-I00 funded by MCIN/AEI/10.13039/501100011033 and by ERDF A way of making Europe. LC acknowledges support by grant PIB2021-725127718NB-100 from the Spanish Ministry of Science and Innovation/State Agency of Research MCIN/AEI/10.13039/501100011033. GÖ acknowledges support from the Swedish National Space Agency (SNSA). TRG acknowledges funding from the Cosmic Dawn Center (DAWN), funded by the Danish National Research Foundation (DNRF) under grant DNRF140. TRG is also grateful for support from the Carlsberg Foundation via grant No. CF20-0534. MP acknowledges grant PID2021-127718NB-I00 funded by the Spanish Ministry of Science and Innovation/State Agency of Research (MICIN/AEI/ 10.13039/501100011033), and the grant RYC2023-044853-I, funded by MICIU/AEI/10.13039/501100011033 and European Social Fund Plus (FSE+). This work is based on observations made with the NASA/ESA/CSA James Webb Space Telescope. The data were obtained from the Mikulski Archive for Space Telescopes at the Space Telescope Science Institute, which is operated by the Association of Universities for Research in Astronomy, Inc., under NASA contract NAS 5-03127 for JWST. These observations are associated with program #1267, and are available via DOI 10.17909/t6c5-ks25. This research has made use of the NASA/IPAC Extragalactic Database (NED) which is operated by the Jet Propulsion Laboratory, California Institute of Technology, under contract with the National Aeronautics and Space Administration. This research made use of Astropy, a community-developed core Python package for Astronomy (Astropy Collaboration 2018, 2013). This research made use of SciPy (Virtanen et al. 2020). This research made use of matplotlib, a Python library for publication quality graphics (Hunter 2007). This research made use of NumPy (Harris et al. 2020). This research made use of spectralcube, a library for astronomical spectral data cubes. This research made use of APLpy, an open-source plotting package for Python (Robitaille & Bressert 2012).
References
- Aalto, S., Spaans, M., Wiedner, M. C., & Hüttemeister, S. 2007, A&A, 464, 193 [NASA ADS] [CrossRef] [EDP Sciences] [Google Scholar]
- Aalto, S., Martín, S., Costagliola, F., et al. 2015, A&A, 584, A42 [NASA ADS] [CrossRef] [EDP Sciences] [Google Scholar]
- Aladro, R., Martín, S., Riquelme, D., et al. 2015, A&A, 579, A101 [NASA ADS] [CrossRef] [EDP Sciences] [Google Scholar]
- Alonso Herrero, A., Hermosa Muñoz, L., Labiano, A., et al. 2024, A&A, 690, A95 [NASA ADS] [CrossRef] [EDP Sciences] [Google Scholar]
- Araya, E., Baan, W. A., & Hofner, P. 2004, ApJS, 154, 541 [NASA ADS] [CrossRef] [Google Scholar]
- Argyriou, I., Glasse, A., Law, D. R., et al. 2023, A&A, 675, A111 [NASA ADS] [CrossRef] [EDP Sciences] [Google Scholar]
- Armus, L., Charmandaris, V., Bernard-Salas, J., et al. 2007, ApJ, 656, 148 [NASA ADS] [CrossRef] [Google Scholar]
- Astropy Collaboration (Robitaille, T. P., et al.) 2013, A&A, 558, A33 [NASA ADS] [CrossRef] [EDP Sciences] [Google Scholar]
- Astropy Collaboration (Price-Whelan, A. M., et al.) 2018, AJ, 156, 123 [Google Scholar]
- Baan, W. A., & Haschick, A. D. 1984, ApJ, 279, 541 [Google Scholar]
- Baan, W. A., Wood, P. A. D., & Haschick, A. D. 1982, ApJ, 260, L49 [Google Scholar]
- Baan, W. A., Haschick, A. D., & Henkel, C. 1989, ApJ, 346, 680 [Google Scholar]
- Baan, W. A., Aditya, J. N. H. S., An, T., & Klöckner, H. -R. 2023, MNRAS, 523, 5487 [Google Scholar]
- Barcos-Muñoz, L., Leroy, A. K., Evans, A. S., et al. 2015, ApJ, 799, 10 [Google Scholar]
- Barcos-Muñoz, L., Aalto, S., Thompson, T. A., et al. 2018, ApJ, 853, L28 [Google Scholar]
- Barr, A. G., Boogert, A., DeWitt, C. N., et al. 2020, ApJ, 900, 104 [NASA ADS] [CrossRef] [Google Scholar]
- Behrens, E., Mangum, J. G., Holdship, J., et al. 2022, ApJ, 939, 119 [NASA ADS] [CrossRef] [Google Scholar]
- Böker, T., Beck, T. L., Birkmann, S. M., et al. 2023, PASP, 135, 038001 [CrossRef] [Google Scholar]
- Boogert, A. C. A., Gerakines, P. A., & Whittet, D. C. B. 2015, ARA&A, 53, 541 [Google Scholar]
- Boonman, A. M. S., Stark, R., van der Tak, F. F. S., et al. 2001, ApJ, 553, L63 [NASA ADS] [CrossRef] [Google Scholar]
- Boonman, A. M. S., van Dishoeck, E. F., Lahuis, F., & Doty, S. D. 2003, A&A, 399, 1063 [NASA ADS] [CrossRef] [EDP Sciences] [Google Scholar]
- Buiten, V. A., van der Werf, P. P., Viti, S., et al. 2024, ApJ, 966, 166 [NASA ADS] [CrossRef] [Google Scholar]
- Butterworth, J., Holdship, J., Viti, S., & García-Burillo, S. 2022, A&A, 667, A131 [NASA ADS] [CrossRef] [EDP Sciences] [Google Scholar]
- Charnley, S. B., & Kaufman, M. J. 2000, ApJ, 529, L111 [Google Scholar]
- Chown, R., Sidhu, A., Peeters, E., et al. 2024, A&A, 685, A75 [NASA ADS] [CrossRef] [EDP Sciences] [Google Scholar]
- Costagliola, F., Sakamoto, K., Muller, S., et al. 2015, A&A, 582, A91 [NASA ADS] [CrossRef] [EDP Sciences] [Google Scholar]
- Delahaye, T., Armante, R., Scott, N. A., et al. 2021, J. Mol. Spectr., 380, 111510 [Google Scholar]
- D’Eugenio, F., Pérez-González, P. G., Maiolino, R., et al. 2024, Nat. Astron., 8, 1443 [CrossRef] [Google Scholar]
- Donnan, F. R., García-Bernete, I., Rigopoulou, D., et al. 2024, MNRAS, 529, 1386 [NASA ADS] [CrossRef] [Google Scholar]
- Doty, S. D., van Dishoeck, E. F., van der Tak, F. F. S., & Boonman, A. M. S. 2002, A&A, 389, 446 [NASA ADS] [CrossRef] [EDP Sciences] [Google Scholar]
- Endres, C. P., Schlemmer, S., Schilke, P., Stutzki, J., & Müller, H. S. P. 2016, J. Mol. Spectr., 327, 95 [NASA ADS] [CrossRef] [Google Scholar]
- Falstad, N., González-Alfonso, E., Aalto, S., et al. 2015, A&A, 580, A52 [NASA ADS] [CrossRef] [EDP Sciences] [Google Scholar]
- Foreman-Mackey, D., Hogg, D. W., Lang, D., & Goodman, J. 2013, PASP, 125, 306 [Google Scholar]
- Francis, L., van Gelder, M. L., van Dishoeck, E. F., et al. 2024, A&A, 683, A249 [NASA ADS] [CrossRef] [EDP Sciences] [Google Scholar]
- Gaia Collaboration (Vallenari, A., et al.) 2023, A&A, 674, A1 [NASA ADS] [CrossRef] [EDP Sciences] [Google Scholar]
- García-Bernete, I., Pereira-Santaella, M., González-Alfonso, E., et al. 2024, A&A, 682, L5 [NASA ADS] [CrossRef] [EDP Sciences] [Google Scholar]
- Goldberg, C. E., Buiten, V. A., Rieke, G. H., et al. 2024, ApJ, 977, 55 [NASA ADS] [CrossRef] [Google Scholar]
- Goldsmith, P. F., & Langer, W. D. 1999, ApJ, 517, 209 [Google Scholar]
- González-Alfonso, E., Wright, C. M., Cernicharo, J., et al. 2002, A&A, 386, 1074 [NASA ADS] [CrossRef] [EDP Sciences] [Google Scholar]
- González-Alfonso, E., Fischer, J., Graciá-Carpio, J., et al. 2012, A&A, 541, A4 [NASA ADS] [CrossRef] [EDP Sciences] [Google Scholar]
- González-Alfonso, E., Fischer, J., Bruderer, S., et al. 2013, A&A, 550, A25 [NASA ADS] [CrossRef] [EDP Sciences] [Google Scholar]
- González-Alfonso, E., García-Bernete, I., Pereira-Santaella, M., et al. 2024, A&A, 682, A182 [NASA ADS] [CrossRef] [EDP Sciences] [Google Scholar]
- Gordon, I. E., Rothman, L. S., Hargreaves, R. J., et al. 2022, J. Quant. Spectrosc. Radiat. Transfer, 277, 107949 [NASA ADS] [CrossRef] [Google Scholar]
- Gorski, M. D., Aalto, S., König, S., et al. 2023, A&A, 670, A70 [NASA ADS] [CrossRef] [EDP Sciences] [Google Scholar]
- Graham, J. R., Carico, D. P., Matthews, K., et al. 1990, ApJ, 354, L5 [Google Scholar]
- Harada, N., Meier, D. S., Martín, S., et al. 2024, ApJS, 271, 38 [NASA ADS] [CrossRef] [Google Scholar]
- Harris, C. R., Millman, K. J., van der Walt, S. J., et al. 2020, Nature, 585, 357 [NASA ADS] [CrossRef] [Google Scholar]
- Hermosa Muñoz, L., Alonso-Herrero, A., Labiano, A., et al. 2025, A&A, 693, A321 [NASA ADS] [CrossRef] [EDP Sciences] [Google Scholar]
- Hibbard, J. E., Vacca, W. D., & Yun, M. S. 2000, AJ, 119, 1130 [NASA ADS] [CrossRef] [Google Scholar]
- Hunter, J. D. 2007, Comput. Sci. Eng., 9, 90 [NASA ADS] [CrossRef] [Google Scholar]
- Imanishi, M., Nakanishi, K., Tamura, Y., & Peng, C. -H. 2009, AJ, 137, 3581 [Google Scholar]
- Jones, O. C., Álvarez-Márquez, J., Sloan, G. C., et al. 2023, MNRAS, 523, 2519 [Google Scholar]
- Joseph, R. D., & Wright, G. S. 1985, MNRAS, 214, 87 [NASA ADS] [Google Scholar]
- Kohno, K., Matsushita, S., Vila-Vilaró, B., et al. 2001, in The Central Kiloparsec of Starbursts and AGN: The La Palma Connection, eds. J. H. Knapen, J. E. Beckman, I. Shlosman, T. J. Mahoney, Astronomical Society of the Pacific Conference Series, 249, 672 [NASA ADS] [Google Scholar]
- Krips, M., Neri, R., García-Burillo, S., et al. 2008, ApJ, 677, 262 [NASA ADS] [CrossRef] [Google Scholar]
- Lahuis, F., & van Dishoeck, E. F. 2000, A&A, 355, 699 [NASA ADS] [Google Scholar]
- Lahuis, F., Spoon, H. W. W., Tielens, A. G. G. M., et al. 2007, ApJ, 659, 296 [Google Scholar]
- Lai, T. S. Y., Armus, L., U, V., et al. 2022, ApJ, 941, L36 [NASA ADS] [CrossRef] [Google Scholar]
- Law, D. R., Morrison, J. E., Argyriou, I., et al. 2023, AJ, 166, 45 [NASA ADS] [CrossRef] [Google Scholar]
- Lonsdale, C. J., Diamond, P. J., Thrall, H., Smith, H. E., & Lonsdale, C. J. 2006, ApJ, 647, 185 [Google Scholar]
- Manohar, S., & Scoville, N. 2017, ApJ, 835, 127 [Google Scholar]
- Martín, S., Krips, M., Martín-Pintado, J., et al. 2011, A&A, 527, A36 [NASA ADS] [CrossRef] [EDP Sciences] [Google Scholar]
- Martín, S., Aalto, S., Sakamoto, K., et al. 2016, A&A, 590, A25 [NASA ADS] [CrossRef] [EDP Sciences] [Google Scholar]
- Meijerink, R., Spaans, M., Loenen, A. F., & van der Werf, P. P. 2011, A&A, 525, A119 [NASA ADS] [CrossRef] [EDP Sciences] [Google Scholar]
- Nagy, Z., Ossenkopf, V., Van der Tak, F. F. S., et al. 2015, A&A, 578, A124 [NASA ADS] [CrossRef] [EDP Sciences] [Google Scholar]
- Nishimura, Y., Aalto, S., Gorski, M. D., et al. 2024, A&A, 686, A48 [NASA ADS] [CrossRef] [EDP Sciences] [Google Scholar]
- Norris, R. P. 1988, MNRAS, 230, 345 [NASA ADS] [Google Scholar]
- Onishi, S., Nakagawa, T., Baba, S., et al. 2024, ApJ, 976, 106 [Google Scholar]
- Ott, J., Henkel, C., Braatz, J. A., & Weiß, A. 2011, ApJ, 742, 95 [NASA ADS] [CrossRef] [Google Scholar]
- Pereira-Santaella, M., González-Alfonso, E., García-Bernete, I., García-Burillo, S., & Rigopoulou, D. 2024a, A&A, 681, A117 [NASA ADS] [CrossRef] [EDP Sciences] [Google Scholar]
- Pereira-Santaella, M., González-Alfonso, E., García-Bernete, I., et al. 2024b, A&A, 689, L12 [NASA ADS] [CrossRef] [EDP Sciences] [Google Scholar]
- Perna, M., Arribas, S., Catalán-Torrecilla, C., et al. 2020, A&A, 643, A139 [NASA ADS] [CrossRef] [EDP Sciences] [Google Scholar]
- Perna, M., Arribas, S., Lamperti, I., et al. 2024, A&A, 690, A171 [NASA ADS] [CrossRef] [EDP Sciences] [Google Scholar]
- Planck Collaboration VI. 2020, A&A, 641, A6 [NASA ADS] [CrossRef] [EDP Sciences] [Google Scholar]
- Rangwala, N., Maloney, P. R., Glenn, J., et al. 2011, ApJ, 743, 94 [NASA ADS] [CrossRef] [Google Scholar]
- Rangwala, N., Colgan, S. W. J., Le Gal, R., et al. 2018, ApJ, 856, 9 [NASA ADS] [CrossRef] [Google Scholar]
- Rho, J., Park, S. H., Arendt, R., et al. 2024, ApJ, 969, L9 [Google Scholar]
- Robitaille, T., & Bressert, E. 2012, Astrophysics Source Code Library [record ascl:1208.017] [Google Scholar]
- Sakamoto, K., Scoville, N. Z., Yun, M. S., et al. 1999, ApJ, 514, 68 [NASA ADS] [CrossRef] [Google Scholar]
- Sakamoto, K., Aalto, S., Wilner, D. J., et al. 2009, ApJ, 700, L104 [Google Scholar]
- Sakamoto, K., Aalto, S., Evans, A. S., Wiedner, M. C., & Wilner, D. J. 2010, ApJ, 725, L228 [Google Scholar]
- Sakamoto, K., Aalto, S., Barcos-Muñoz, L., et al. 2017, ApJ, 849, 14 [Google Scholar]
- Sakamoto, K., González-Alfonso, E., Martín, S., et al. 2021a, ApJ, 923, 206 [NASA ADS] [CrossRef] [Google Scholar]
- Sakamoto, K., Martín, S., Wilner, D. J., et al. 2021b, ApJ, 923, 240 [NASA ADS] [CrossRef] [Google Scholar]
- Salter, C. J., Ghosh, T., Catinella, B., et al. 2008, AJ, 136, 389 [Google Scholar]
- Sanders, D. B., Soifer, B. T., Elias, J. H., et al. 1988, ApJ, 325, 74 [Google Scholar]
- Scoville, N. Z., Sanders, D. B., Sargent, A. I., et al. 1986, ApJ, 311, L47 [Google Scholar]
- Scoville, N. Z., Evans, A. S., Dinshaw, N., et al. 1998, ApJ, 492, L107 [NASA ADS] [CrossRef] [Google Scholar]
- Scoville, N., Sheth, K., Walter, F., et al. 2015, ApJ, 800, 70 [NASA ADS] [CrossRef] [Google Scholar]
- Scoville, N., Murchikova, L., Walter, F., et al. 2017, ApJ, 836, 66 [Google Scholar]
- Smith, H. E., Lonsdale, C. J., Lonsdale, C. J., & Diamond, P. J. 1998, ApJ, 493, L17 [NASA ADS] [CrossRef] [Google Scholar]
- Smith, J. D. T., Draine, B. T., Dale, D. A., et al. 2007, ApJ, 656, 770 [Google Scholar]
- Soifer, B. T., Helou, G., Lonsdale, C. J., et al. 1984, ApJ, 283, L1 [Google Scholar]
- Soifer, B. T., Neugebauer, G., Matthews, K., et al. 1999, ApJ, 513, 207 [Google Scholar]
- Sonnentrucker, P., González-Alfonso, E., & Neufeld, D. A. 2007, ApJ, 671, L37 [NASA ADS] [CrossRef] [Google Scholar]
- Spoon, H. W. W., Moorwood, A. F. M., Lutz, D., et al. 2004, A&A, 414, 873 [NASA ADS] [CrossRef] [EDP Sciences] [Google Scholar]
- Takano, S., Nakanishi, K., Nakai, N., & Takano, T. 2005, PASJ, 57, L29 [NASA ADS] [Google Scholar]
- Tanaka, K., Kawaguchi, K., & Hirota, E. 1986, J. Mol. Spectr., 117, 408 [Google Scholar]
- Teng, S. H., Rigby, J. R., Stern, D., et al. 2015, ApJ, 814, 56 [Google Scholar]
- Tunnard, R., Greve, T. R., Garcia-Burillo, S., et al. 2015, ApJ, 800, 25 [NASA ADS] [CrossRef] [Google Scholar]
- Ulivi, L., Perna, M., Lamperti, I., et al. 2025, A&A, 693, A36 [NASA ADS] [CrossRef] [EDP Sciences] [Google Scholar]
- van der Tak, F. F. S., van Dishoeck, E. F., Evans, N. J. II., Bakker, E. J., & Blake, G. A. 1999, ApJ, 522, 991 [NASA ADS] [CrossRef] [Google Scholar]
- van Dishoeck, E. F., Grant, S., Tabone, B., et al. 2023, Farad. Disc., 245, 52 [Google Scholar]
- van Gelder, M. L., Francis, L., van Dishoeck, E. F., et al. 2024, A&A, 692, A197 [NASA ADS] [CrossRef] [EDP Sciences] [Google Scholar]
- Varenius, E., Conway, J. E., Batejat, F., et al. 2019, A&A, 623, A173 [NASA ADS] [CrossRef] [EDP Sciences] [Google Scholar]
- Virtanen, P., Gommers, R., Oliphant, T. E., et al. 2020, Nat. Methods, 17, 261 [Google Scholar]
- Wheeler, J., Glenn, J., Rangwala, N., & Fyhrie, A. 2020, ApJ, 896, 43 [NASA ADS] [CrossRef] [Google Scholar]
- Wright, G. S., Rieke, G. H., Glasse, A., et al. 2023, PASP, 135, 048003 [NASA ADS] [CrossRef] [Google Scholar]
All Tables
All Figures
|
Fig. 1. MIRI false-colour image of Arp 220 using the F1280W (red), F1130W (green), and F770W (blue) filters. The blue rectangles indicate the smallest (channel 1) and largest (channel 4) fields of view of the MRS observations. The cyan circles indicate extraction apertures for the western and eastern nuclei, both with a radius of 0 |
| In the text | |
|
Fig. 2. Combined NIRSpec/IFU G395H/F290LP + MIRI MRS spectrum of the WN of Arp 220, extracted from a circular aperture of 0 |
| In the text | |
|
Fig. 3. Top panel: Observed spectrum and total model of the 14 μm region. Middle panel: Continuum-normalised spectrum and model absorption spectrum. The model includes C2H2, two HCN components, N2H+, and CO2. A fiducial model of HC3N with N = 3×1015 cm−2, T = 50 K is plotted as well. All components are shown with fbg = 0.28, following the value inferred from C2H2 and HCN. The inset shows the model of the HCN Q branch in detail, illustrating that a 330 K component is needed to explain the asymmetric shape of the Q branch. Strong lines in the R and P branches of C2H2 and HCN are labelled for reference. Bottom panel: Residual spectrum. The grey shaded area indicates the 68% interval of the residuals. |
| In the text | |
|
Fig. 4. Spectrum around 6 μm and the best-fit H2O model for fbg = 0.35. The top panel shows the absolute flux spectrum and continuum model. The middle panel shows the continuum-normalised spectrum. Strong H2O lines are labelled by their upper- and lower-level quantum numbers as Ju,Ka,u,Kc,u−Jl,Ka,l,Kc,l. Several strong emission lines and absorption lines of C2H are labelled as well. The pink shaded area indicates the spectral region considered in the fit. The bottom panel shows the residuals on the continuum-normalised spectrum; the grey shaded area indicates their 68% interval. |
| In the text | |
|
Fig. 5. Best-fit model spectrum for CO, extracted from an |
| In the text | |
|
Fig. 6. Continuum-normalised spectrum between 7.2 μm and 8.1 μm versus the best-fit LTE model for fbg(C2H2) = 0.2. The model includes the C2H2 ν4+ν5 combination band, CH4 gas, and CH4 ice. Only the spectral region indicated in by the pink shaded area was included in the fit in order to avoid the effects of Pf α contamination, CS absorption, and further systematic uncertainties in the continuum estimation. The grey shaded area in the bottom panel indicates the 68% interval of the residuals. |
| In the text | |
|
Fig. 7. Best-fit LTE model for the HCN 2ν2 overtone band and the interloping H2O lines at 7 μm for fbg = 1. The pink shaded area indicates the spectral region used in the fit. A simultaneously fit H2O model is also shown. The HCN overtone lines are labelled, and the residuals are shown in the bottom panel. A fiducial model of the HCN 3ν2−ν2 band, with N(HCN) = 2 × 1018 cm−2, Tvib = 330 K, Trot = 50 K, and fbg = 1 is shown in purple. The grey shaded area in the bottom panel indicates the 68% interval of the residuals. |
| In the text | |
|
Fig. 8. Spectrum at 21 μm (blue) and best-fit model for HNC (red). The pink shaded areas indicate the spectral region used in the fit. The residuals are shown in the bottom panel, with the 68% interval indicated by the grey shaded area. |
| In the text | |
|
Fig. 9. Fiducial model for the tentative HCO+ band at 12.1 μm. This model has a temperature of T = 50 K, a column density of N(HCO+) = 5×1015 cm−2, a velocity dispersion of σV = 75 km s−1, and a background fraction of fbg = 0.28, matching that found for HCN and C2H2 at 14 μm. The detected ν4 band of protonated hydrogen cyanide is indicated as well. |
| In the text | |
|
Fig. 10. Best-fit LTE model for NO and C2H at 5 μm, with fbg = 1. The top panel shows the absorption model with the continuum and PAH emission, the middle panel shows the absorption spectrum, and the bottom panel shows the residuals on the absorption spectrum. Pink shaded areas indicate the spectral regions used in the fit. The grey shaded area in the bottom panel indicates the 68% interval of the residuals. All model spectra are rebinned onto the spectral axis of the observed spectrum to enable a more precise visual comparison to the data. |
| In the text | |
|
Fig. 11. Top: Schematic illustration of the proposed line-of-sight geometry. The molecular gas is embedded in cool dust that produces significant foreground emission, filling in the features produced by absorption of hot background photons. Bottom: Expected continuum spectrum for a toy model consisting of a 1000 K background blackbody and a 100 K foreground modified blackbody. |
| In the text | |
|
Fig. 12. HCN ν2 and 2ν2 absorption bands relative to the observed continuum in the toy model of Fig. 11). A column density of 2×1018 cm−2 and a rotational temperature of 150 K were used. |
| In the text | |
|
Fig. 13. HCN 2ν2−ν2 and 3ν2−ν2 hot bands relative to the observed continuum in the toy model of Fig. 11 for both a pure absorption model and a model including both absorption and emission. A column density of 2×1018 cm−2, a rotational temperature of 150 K, and a vibrational temperature of 440 K were used. The modelled 14 μm absorption is completely filled in by line emission, while the 7 μm band is almost unchanged. |
| In the text | |
|
Fig. 14. Schematic illustration of the proposed geometry of the WN along the line of sight. Following the interpretation of Sakamoto et al. (2021b), we assumed that the south side of the disc faces us with an inclination of i≈60° and that the biconical outflow is normal to the disc. The direction of the tilt is debated (Scoville et al. 1998; Van der Werf et al., in prep.), but we note that it does not affect the interpretation of the absorption bands in this work. |
| In the text | |
Current usage metrics show cumulative count of Article Views (full-text article views including HTML views, PDF and ePub downloads, according to the available data) and Abstracts Views on Vision4Press platform.
Data correspond to usage on the plateform after 2015. The current usage metrics is available 48-96 hours after online publication and is updated daily on week days.
Initial download of the metrics may take a while.