Fig. 6.
Download original image
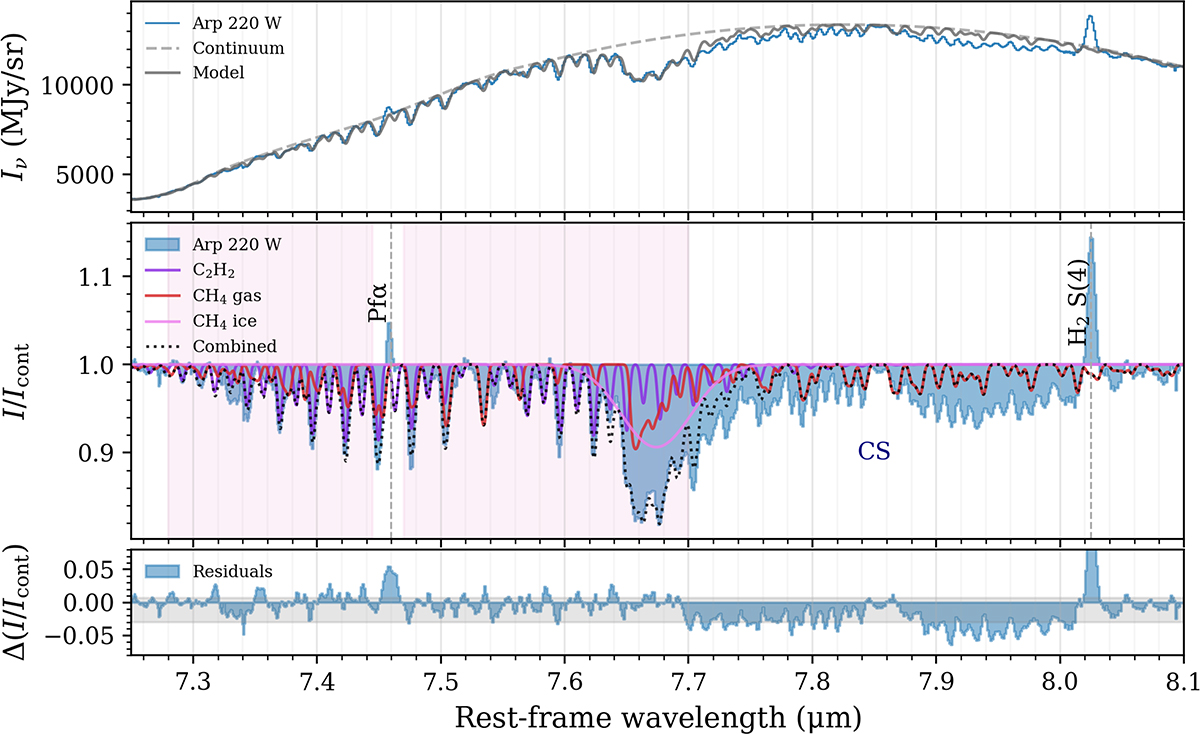
Continuum-normalised spectrum between 7.2 μm and 8.1 μm versus the best-fit LTE model for fbg(C2H2) = 0.2. The model includes the C2H2 ν4+ν5 combination band, CH4 gas, and CH4 ice. Only the spectral region indicated in by the pink shaded area was included in the fit in order to avoid the effects of Pf α contamination, CS absorption, and further systematic uncertainties in the continuum estimation. The grey shaded area in the bottom panel indicates the 68% interval of the residuals.
Current usage metrics show cumulative count of Article Views (full-text article views including HTML views, PDF and ePub downloads, according to the available data) and Abstracts Views on Vision4Press platform.
Data correspond to usage on the plateform after 2015. The current usage metrics is available 48-96 hours after online publication and is updated daily on week days.
Initial download of the metrics may take a while.