Fig. 5.
Download original image
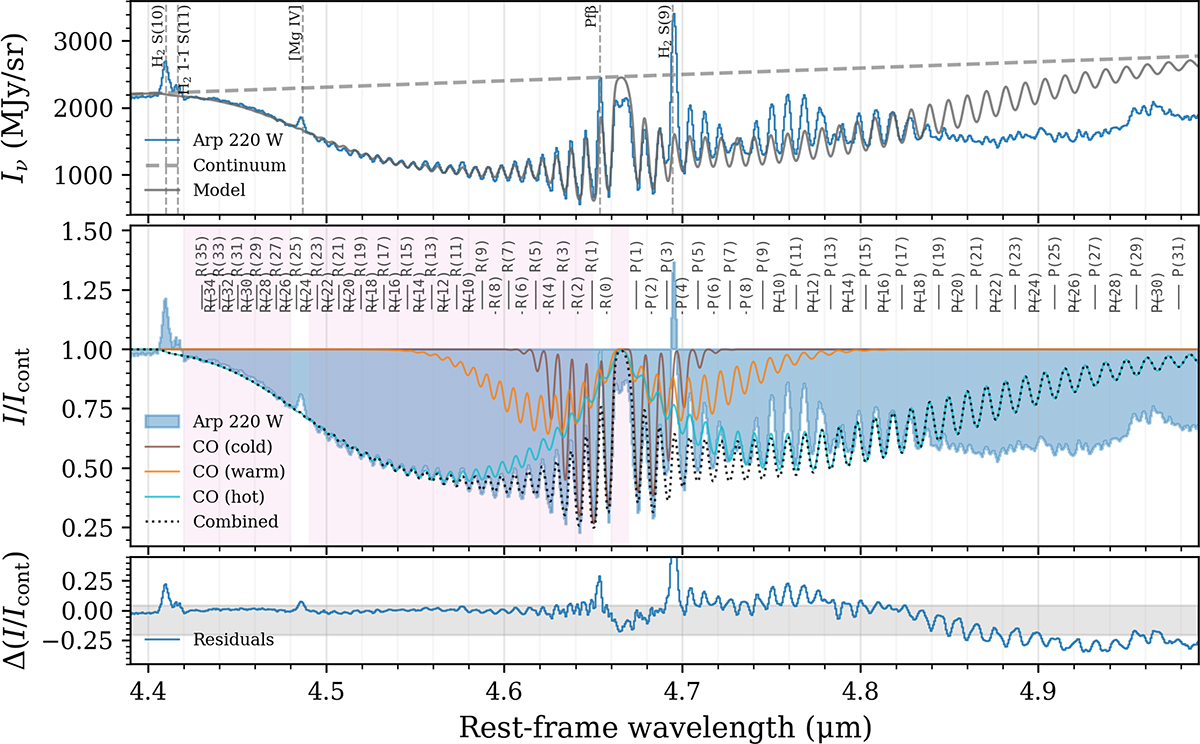
Best-fit model spectrum for CO, extracted from an ![]() aperture, with fbg = 0.77. The top panel shows the total model including the continuum, the middle panel shows the continuum-normalised spectrum, and the bottom panel shows the residuals on the continuum-normalised spectrum. The grey shaded area in the bottom panel indicates the 68% interval of the residuals. The pink shaded area indicates the spectral region used in the fit.
aperture, with fbg = 0.77. The top panel shows the total model including the continuum, the middle panel shows the continuum-normalised spectrum, and the bottom panel shows the residuals on the continuum-normalised spectrum. The grey shaded area in the bottom panel indicates the 68% interval of the residuals. The pink shaded area indicates the spectral region used in the fit.
Current usage metrics show cumulative count of Article Views (full-text article views including HTML views, PDF and ePub downloads, according to the available data) and Abstracts Views on Vision4Press platform.
Data correspond to usage on the plateform after 2015. The current usage metrics is available 48-96 hours after online publication and is updated daily on week days.
Initial download of the metrics may take a while.