Fig. 7.
Download original image
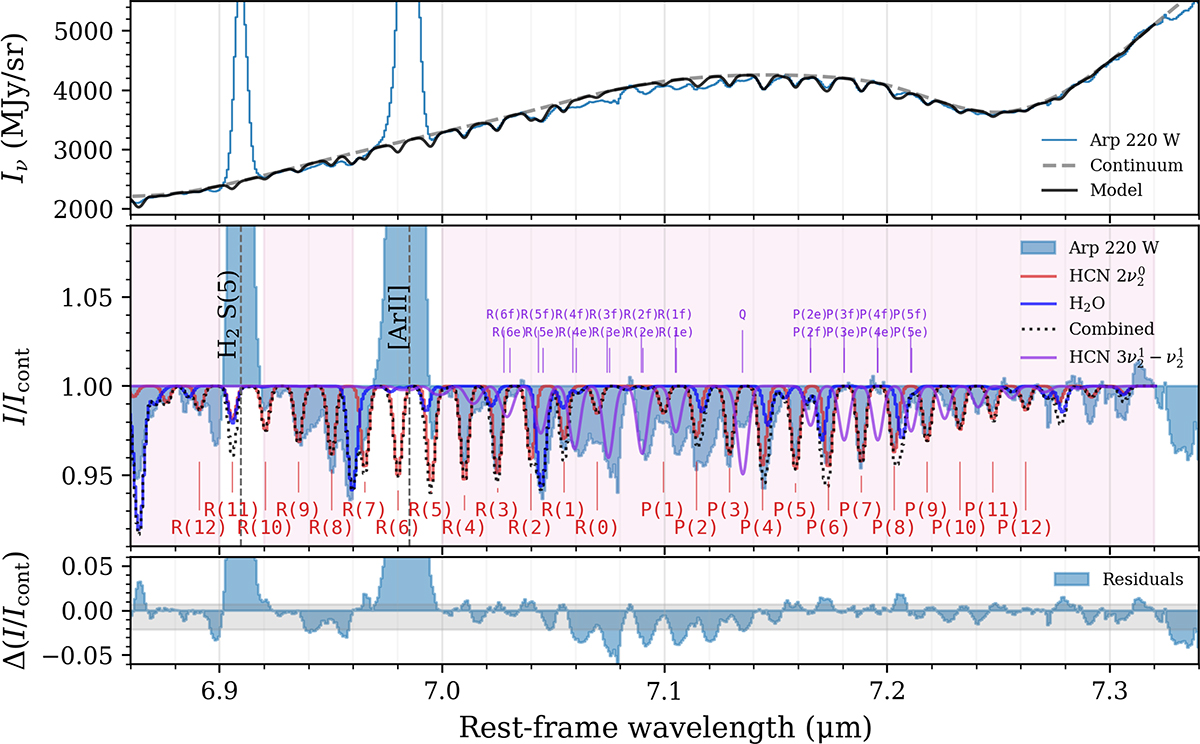
Best-fit LTE model for the HCN 2ν2 overtone band and the interloping H2O lines at 7 μm for fbg = 1. The pink shaded area indicates the spectral region used in the fit. A simultaneously fit H2O model is also shown. The HCN overtone lines are labelled, and the residuals are shown in the bottom panel. A fiducial model of the HCN 3ν2−ν2 band, with N(HCN) = 2 × 1018 cm−2, Tvib = 330 K, Trot = 50 K, and fbg = 1 is shown in purple. The grey shaded area in the bottom panel indicates the 68% interval of the residuals.
Current usage metrics show cumulative count of Article Views (full-text article views including HTML views, PDF and ePub downloads, according to the available data) and Abstracts Views on Vision4Press platform.
Data correspond to usage on the plateform after 2015. The current usage metrics is available 48-96 hours after online publication and is updated daily on week days.
Initial download of the metrics may take a while.