Fig. 3.
Download original image
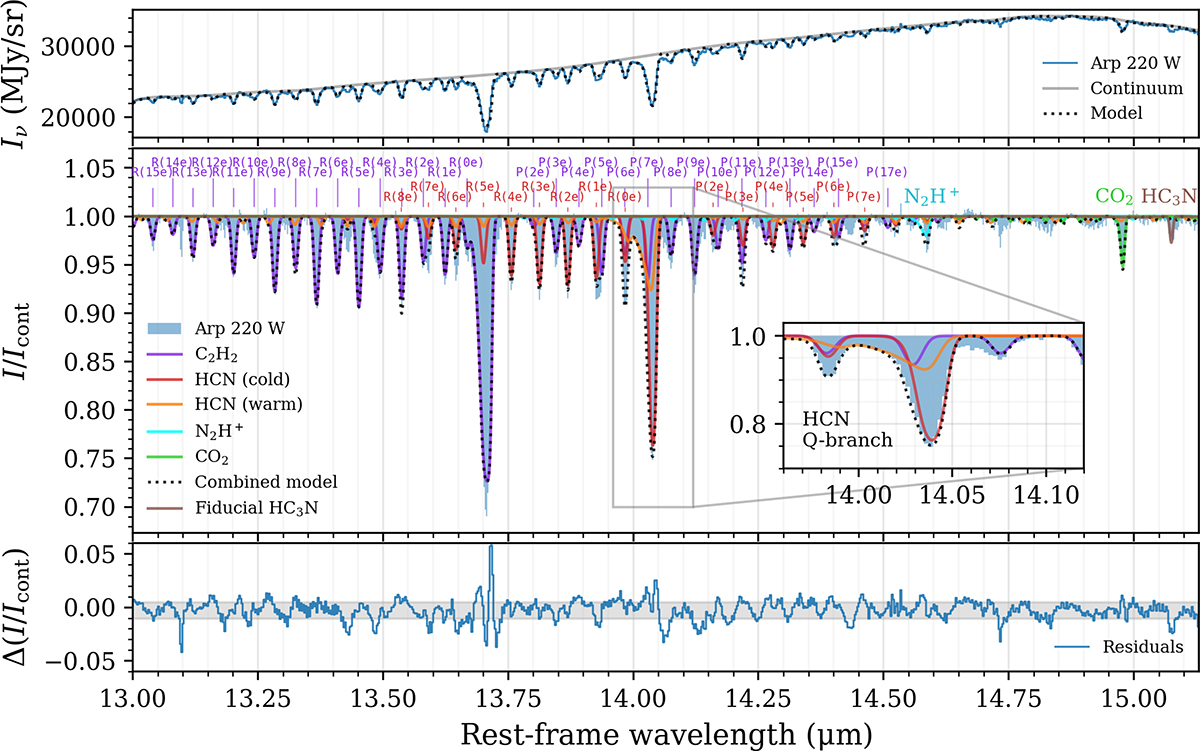
Top panel: Observed spectrum and total model of the 14 μm region. Middle panel: Continuum-normalised spectrum and model absorption spectrum. The model includes C2H2, two HCN components, N2H+, and CO2. A fiducial model of HC3N with N = 3×1015 cm−2, T = 50 K is plotted as well. All components are shown with fbg = 0.28, following the value inferred from C2H2 and HCN. The inset shows the model of the HCN Q branch in detail, illustrating that a 330 K component is needed to explain the asymmetric shape of the Q branch. Strong lines in the R and P branches of C2H2 and HCN are labelled for reference. Bottom panel: Residual spectrum. The grey shaded area indicates the 68% interval of the residuals.
Current usage metrics show cumulative count of Article Views (full-text article views including HTML views, PDF and ePub downloads, according to the available data) and Abstracts Views on Vision4Press platform.
Data correspond to usage on the plateform after 2015. The current usage metrics is available 48-96 hours after online publication and is updated daily on week days.
Initial download of the metrics may take a while.