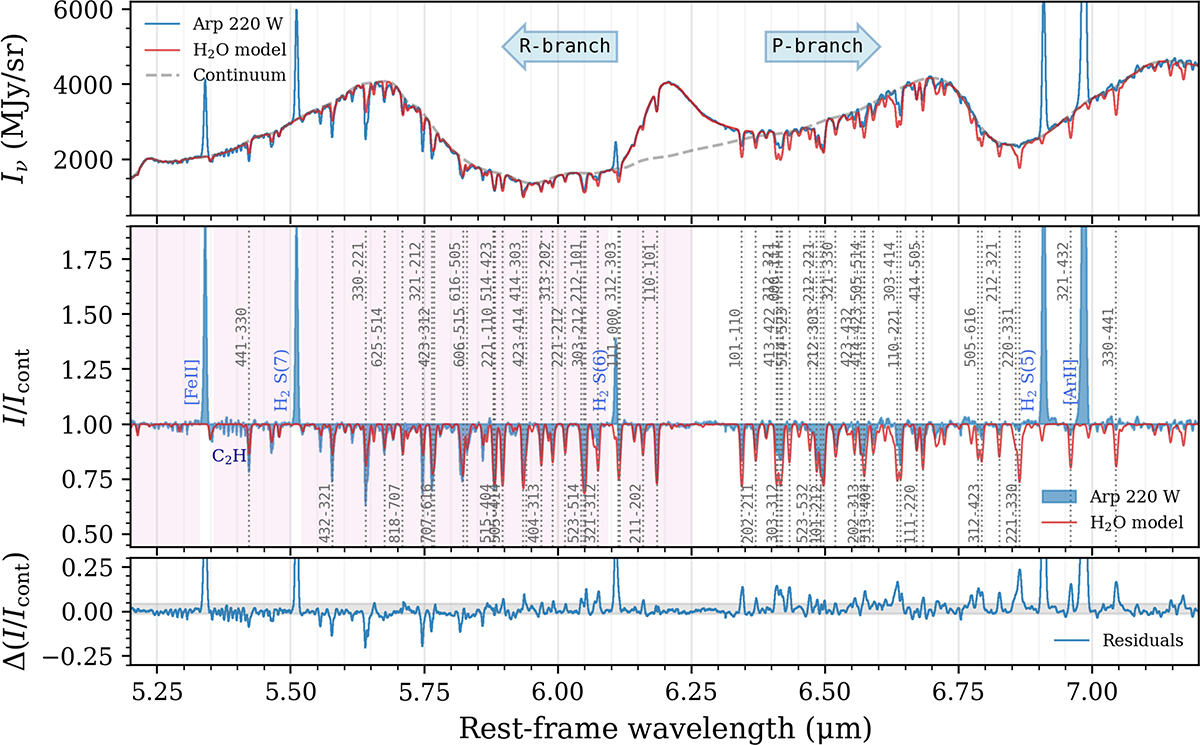
Fig. 4.
Download original image
Spectrum around 6 μm and the best-fit H2O model for fbg = 0.35. The top panel shows the absolute flux spectrum and continuum model. The middle panel shows the continuum-normalised spectrum. Strong H2O lines are labelled by their upper- and lower-level quantum numbers as Ju,Ka,u,Kc,u−Jl,Ka,l,Kc,l. Several strong emission lines and absorption lines of C2H are labelled as well. The pink shaded area indicates the spectral region considered in the fit. The bottom panel shows the residuals on the continuum-normalised spectrum; the grey shaded area indicates their 68% interval.
Current usage metrics show cumulative count of Article Views (full-text article views including HTML views, PDF and ePub downloads, according to the available data) and Abstracts Views on Vision4Press platform.
Data correspond to usage on the plateform after 2015. The current usage metrics is available 48-96 hours after online publication and is updated daily on week days.
Initial download of the metrics may take a while.