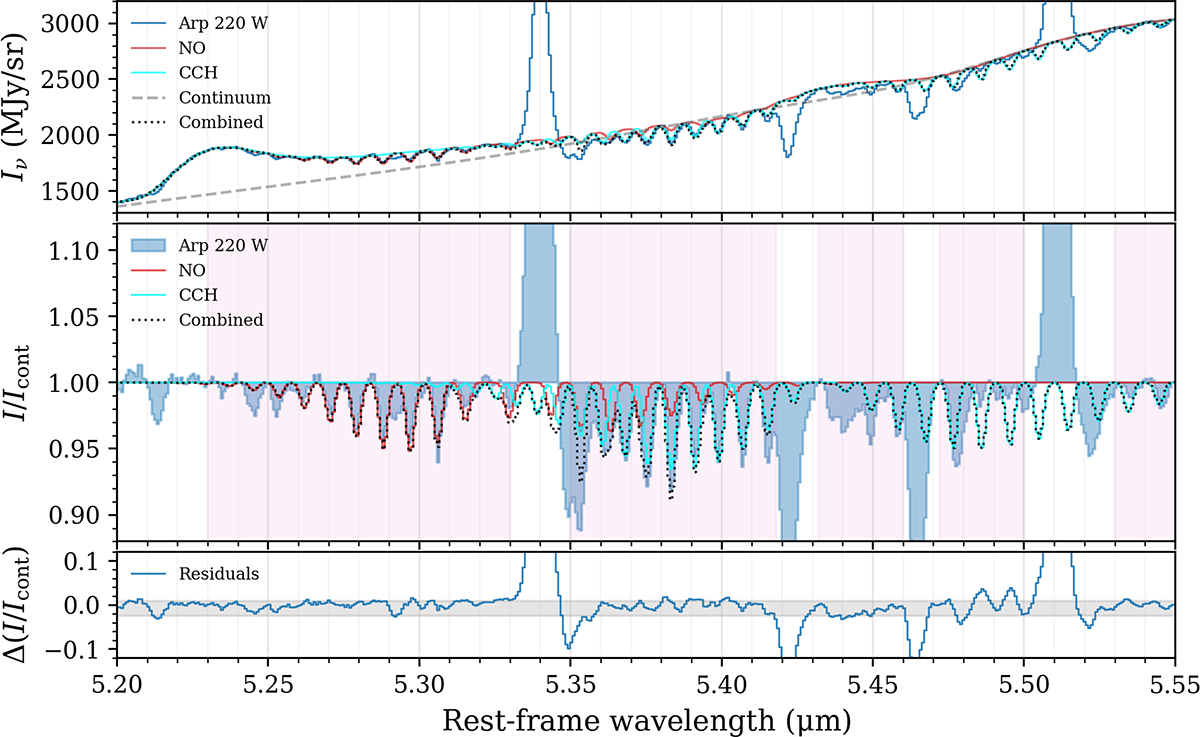
Fig. 10.
Download original image
Best-fit LTE model for NO and C2H at 5 μm, with fbg = 1. The top panel shows the absorption model with the continuum and PAH emission, the middle panel shows the absorption spectrum, and the bottom panel shows the residuals on the absorption spectrum. Pink shaded areas indicate the spectral regions used in the fit. The grey shaded area in the bottom panel indicates the 68% interval of the residuals. All model spectra are rebinned onto the spectral axis of the observed spectrum to enable a more precise visual comparison to the data.
Current usage metrics show cumulative count of Article Views (full-text article views including HTML views, PDF and ePub downloads, according to the available data) and Abstracts Views on Vision4Press platform.
Data correspond to usage on the plateform after 2015. The current usage metrics is available 48-96 hours after online publication and is updated daily on week days.
Initial download of the metrics may take a while.