| Issue |
A&A
Volume 699, July 2025
|
|
|---|---|---|
| Article Number | A105 | |
| Number of page(s) | 12 | |
| Section | Cosmology (including clusters of galaxies) | |
| DOI | https://doi.org/10.1051/0004-6361/202553971 | |
| Published online | 02 July 2025 | |
Multi-object spectroscopic survey of the massive galaxy cluster SMACS J0723.3-7327
1
Instituto de Investigación en Astronomía y Ciencias Planetarias (INCT), Universidad de Atacama, Copiapó, Atacama, Chile
2
Institute of Astrophysics, Facultad de Ciencias Exactas, Universidad Andrés Bello, Sede Concepción, Talcahuano, Chile
3
INAF-Osservatorio Astronomico di Trieste, Via Tiepolo 11, I-34131 Trieste, Italy
4
University of Helsinki, Department of Physics, Gustaf Hällstromin katu 2, 00560 Helsinki, Finland
5
Millennium Nucleus for Galaxies (MINGAL), Chile
⋆ Corresponding authors: This email address is being protected from spambots. You need JavaScript enabled to view it.
: This email address is being protected from spambots. You need JavaScript enabled to view it.
Received:
30
January
2025
Accepted:
21
April
2025
Abstract
Aims. We present a new wide-field spectroscopic survey of the galaxy cluster SMACS J0723.3-7327 at z ∼ 0.39, with the aim of mapping the large-scale structure around this massive cluster. We also aim to detect infalling galaxy groups in combination with XMM-Newton and eROSITA X-ray data, while studying the evolution and transformation of cluster galaxies out to ∼2r200.
Methods. We carried out new multi-slit spectroscopic observations of SMACS J0723-3-7327 with the IMACS f/2 instrument on the 6.5 m Magellan-Baade telescope, obtaining spectra for 193 galaxies selected using deep near-infrared (NIR) photometry from the Galaxy Clusters at VIRCAM (GCAV) survey. We examined the infall pattern of galaxies in the caustic diagram out to ∼2r200 and used it to identify 93 cluster members from our sample as being located within the caustic curves. Incorporating redshifts from previous studies of the cluster core, we produced a catalogue of 150 spectroscopically-confirmed cluster members.
Results. We measured a central cluster redshift of z = 0.3910 ± 0.0007 and a velocity dispersion of σV = 1431 ± 150 km s−1 for galaxies within r200. We found sub-structures within the velocity distribution function and a filamentary structure passing SE-NW through the cluster, likely related to the highly elongated mass distribution and X-ray emission seen in the central regions of the cluster. Using an optical colour-colour separation, we determine the fraction of star-forming galaxies as a function of cluster-centric radius out to 5r200 using photometric data, finding it consistently lower compared to coeval field galaxies even at 5r200. We identified a number of clumps of red galaxies in the cluster infall regions, suggestive of infalling groups in which galaxies could be undergoing pre-processing, even if we were unable to detect any associated X-ray emission in the XMM or eROSITA data.
Conclusions. This work confirms the dynamical complexity of cluster SMACS J0723.3-7327 and the surrounding large-scale structure, similar to that seen for other massive clusters at z ∼ 0.4. Further spectroscopic analyses across larger cluster-centric distances are essential to comprehensively assess the dynamical state of the cluster and investigate how environmental mechanisms influence star formation quenching in galaxies at varying radial distances.
Key words: galaxies: clusters: general / galaxies: evolution / galaxies: general / galaxies: clusters: individual: SMACS J0723-7327
Deceased.
© The Authors 2025
 Open Access article, published by EDP Sciences, under the terms of the Creative Commons Attribution License (https://creativecommons.org/licenses/by/4.0), which permits unrestricted use, distribution, and reproduction in any medium, provided the original work is properly cited.
This article is published in open access under the Subscribe to Open model. This email address is being protected from spambots. You need JavaScript enabled to view it. to support open access publication.
1. Introduction
Galaxy clusters are the largest known gravitationally bound structures in the Universe, containing hundreds to thousands of galaxies. Structure in the Universe forms hierarchically (Dekel & Silk 1986), where the most massive dark matter halos, such as galaxy clusters, grow by continually accreting lower-mass halos, such as groups and individual galaxies. In other words, these clusters are continuously evolving through gravitational interactions and actively exchanging gas via the intracluster medium. Therefore, studying them is fundamental to understanding the formation and evolution of the large-scale structures of the Universe. Studies have shown that red or quiescent galaxies are more prevalent towards the cluster centre, while blue or star-forming galaxies are increasing towards the outskirts (Lewis et al. 2002; Balogh et al. 2004; Haines et al. 2015). The red-and-dead galaxies (ellipticals) and blue-star-forming galaxies (spirals) exhibit different colours, luminosities, and metallicities (Hubble & Humason 1931; Dressler et al. 1999). This gradient in star-forming and quiescent galaxies illustrates an ongoing galaxy evolution, influenced by one or more environmental mechanisms like ram-pressure stripping, starvation, harassment, and strangulation (Gunn et al. 1972; Boselli & Gavazzi 2006; Cortese et al. 2021). Thus, the local density or the environment in which the galaxies reside, significantly affects their gas contents, star formation activities and morphologies.
A galaxy’s local density is seen to influence its star formation activity, in addition to its position with respect to the cluster centre (Gómez et al. 2003). Galaxy transformation occurs not just in the most extreme environments such as the cores of massive clusters, but also much milder environments such as galaxy groups (Lewis et al. 2002). Numerous studies have shown that environmental mechanisms significantly affect the star formation in galaxies as they approach the virialised region of a cluster (Spitzer & Baade 1951; Gunn et al. 1972; Lin & Faber 1983; Deshev et al. 2020). Additionally, research on galaxy groups (Balogh et al. 2004; Yang et al. 2007), and extensive studies within the LoCuSS Survey1 (Haines et al. 2013, 2015, 2018) also suggest that environmental processes significantly influence star formation at a local scale. Importantly, the cold gas which is essential for star formation can be easily removed or depleted, causing galaxies to become quenched even before they enter the cluster’s virial radius through mechanisms such as pre-processing (see reviews by Boselli & Gavazzi 2006; Cortese et al. 2021). Pre-processing is defined as an environmental transformation occurring in galaxy groups that subsequently fall into the cluster. It is a combination of gravitational mechanisms such as tidal interactions and hydrodynamical mechanisms such as ram-pressure stripping, making it a hybrid mechanism (Boselli & Gavazzi 2006) that influences star formation in galaxies within groups and that is seen to act beyond the virial radius of the cluster (Zabludoff et al. 1996; Zabludoff & Mulchaey 1998; Balogh et al. 1999; Fujita 2004; Dressler et al. 2004; McGee et al. 2009; Bravo-Alfaro et al. 2011). Although it is evident that the environmental mechanisms transform the galaxy properties within galaxy groups in the infall regions of massive clusters (Bianconi et al. 2018; Lopes et al. 2024), the effects of these processes are yet to be fully characterised.
Over the years, increasing efforts have been placed on studying pre-processing in galaxies through multi-wavelength observations. Cortese et al. (2006) studied compact groups where they witness that galaxies within groups are quenched even beyond the virial radius of the clusters. This environmental mechanism is best addressed through statistical analyses of galaxies and galaxy groups, as it is the dominant mechanism beyond the virial radius. Dressler et al. (2013) exquisitely studied in-falling groups and compared their star-forming fraction to the filaments and fields. Dressler et al. (2013) and Haines et al. (2015) both highlighted that pre-processing in groups significantly reduces the star formation rate in galaxies at larger cluster-centric distances (> r200). In fact, Bianconi et al. (2018) has offered direct evidence of group galaxies undergoing pre-processing. They showed that the fraction of star-forming galaxies in groups remains unchanged with the cluster-centric distance. Additionally, they showed that the star-forming fraction in groups are similar to those in cluster cores, which indicates that pre-processing is indeed widespread. More recent studies on single galaxy clusters (Olave-Rojas et al. 2018; Sengupta et al. 2022; Estrada et al. 2023; Piraino-Cerda et al. 2024), groups in the outskirts (Einasto et al. 2020; Loubser et al. 2024), and a large sample of galaxy clusters by Lopes et al. (2024) have shown that environmental mechanisms are responsible for star formation quenching out to large radii (> r200). However, the ranges of radii and redshifts at which such environmental processes are most active remains unclear.
The massive galaxy cluster SMACS J0723.3-7327 (also known as PSZ2 G284.97-23.69, hereafter SMACS J0723) at z ∼ 0.39 is a particularly interesting system for studying cluster galaxy evolution, as it is at the peak redshift where clusters are building up their mass by accreting the surrounding galaxies and galaxy groups (Dressler et al. 2004; Girardi et al. 2015; Mercurio et al. 2021; Estrada et al. 2023). SMACS J0723 was initially detected in X-rays by the ROSAT All-Sky Survey (Voges et al. 1999). SMACS J0723 was then detected by Planck and included as one of the 189 candidate clusters in its early Sunyaev–Zeldovich (ESZ) cluster sample (Planck Collaboration VIII 2011). Ten of these candidate clusters, including SMACS J0723, were then followed up with XMM-Newton, which allowed the redshift of the cluster to be estimated by fitting the central energy of the Fe Kα line (6.4 keV rest-frame), obtaining zFe ∼ 0.39 (Planck Collaboration IX 2011). It was identified as one of the most massive galaxy clusters at z ∼ 0.4 in the second all-sky Planck catalogue of Sunyaev-Zeldovich (SZ) sources (PSZ2), with M500, SZ = 8.39 ± 0.34 × 10¹⁴ M⊙ (Planck Collaboration XXVII 2016). This X-ray luminous and massive galaxy cluster was discovered to exhibit a giant radio halo by Martinez Aviles et al. (2018) from the Australian Telescope Compact Array (ATCA) sample. They classified it as a radio halo based on the low-surface-brightness diffuse radio source at the centre of the cluster that coincides with the X-ray emission (Liu et al. 2023). They classified SMACS J0723 as a dynamically disturbed system based on the X-ray morphology and density profile. However, the authors pointed out that the cluster is under-luminous compared to other clusters at redshift ∼0.4, such as Abell S1063, MACS J0416.1-2403, and MACS J1206.2-0847 (Girardi et al. 2015; Mercurio et al. 2021; Estrada et al. 2023). Furthermore, this behaviour has been linked to old mergers as well as recent mergers (Donnert et al. 2013). All this makes it an intriguing cluster to conduct deep photometric and spectroscopic analysis. The existing spectroscopic redshifts (Caminha et al. 2022; Mahler et al. 2023; Noirot et al. 2023) for cluster galaxies are concentrated within the central 1–2 arcminute of SMACS J0723. Mahler et al. (2023) also claims that their strong lensing model, using the JWST imaging and spectroscopy, is more accurate when considering a second diffuse mass component accounting for the mass traced by the intra-cluster light introduced in the model due to the identification of a diffuse light excess to the west of the BCG. They suggested that this additional clump could be a tracer of a recent merger event. Moreover, this clump and the other clump in the northwestern core region (near the galaxy nicknamed the Beret; Mahler et al. 2023) could be interpreted as remnant of past dynamical activity in the cluster, which is now moving towards relaxation.
The above-mentioned surveys and studies have been focussed on the central region of the cluster. Moreover, only 61 galaxies in the central region (< 2 arcmin) of the cluster were observed with the integral field spectrograph Multi Unit Spectroscopic Explorer (MUSE) on the Very Large Telescope (VLT) covering a field of view of 1 × 1 arcmin2 (Caminha et al. 2022; Mahler et al. 2023; Noirot et al. 2023). The centre of this cluster has been extremely well studied with HST, JWST, and MUSE (Noirot et al. 2023; Mahler et al. 2023; Caminha et al. 2022); however, we know very little at present about the large-scale structure and its role within the cosmological context. We do not we have a complete spectroscopic coverage of galaxies within R200, let alone the infall regions. With this as motivation, we aim to obtain a holistic view of the massive galaxy cluster SMACS J0723. We use a systematic approach to study the cluster galaxy evolution in the centre and the in-fall regions for SMACS J0723. To identify the member galaxies, we have performed a multi-object spectroscopic study of SMACS J0723 using the Inamori Magellan Areal Camera and Spectrograph (IMACS; Dressler et al. 2011) instrument on the 6.5 m Magellan Baade Telescope at the Las Campanas Observatory (LCO), Chile. This work is supported with spectroscopic redshifts, multi-band photometry, and X-ray imaging for the virialised region of the cluster. We present the spectroscopic redshift of galaxies in and around the cluster, along with an identification of the cluster members, a statistical identification of the sub-structures, estimations of the star-forming galaxy fraction, and a visualisation of the radial distribution of galaxies that indicate transformation before the cluster infall. In Section 2, we describe the optical and near-infrared (NIR) photometric data. In Section 3, we describe the spectroscopic data. The data reduction and analysis are explained in Section 4. Specifications of the X-ray dataset are given in Section 5, while Section 6 highlights the results. In Section 7, we present the discussion and we provide the conclusion and plans for future works in Section 8. We used a ΛCDM cosmology with matter density, Ωm = 0.3, ΩΛ = 0.7, and Hubble constant, H0 = 70 km s−1 Mpc−1. At the cluster redshift of z ∼ 0.39, 1 arcminute corresponds to ∼317.41 kpc (Hogg 1999). We used a virial radius r200 = 6.11 arcmin (Sifón et al. 2025). All magnitudes are in the AB system.
2. Photometric data
The photometric dataset for SMACS J0723 at z ∼ 0.39 consists of deep, wide-field NIR imaging covering a 1.5 × 1.0 deg2 field, acquired with the VISTA infraRed CAMera (VIRCAM) instrument on the 4-m Visible and Infrared Survey Telescope for Astronomy (VISTA) at ESO’s Cerro Paranal Observatory. SMACS J0723 was one of 20 massive galaxy clusters observed with VIRCAM in the Y, J and K-bands as part of the Galaxy Clusters At VIRCAM (GCAV) Survey2, a VISTA ESO public survey (198.A-2008; P.I. M. Nonino). SMACS J0723 was observed with VIRCAM in service mode, consisting of eight hour-long observing blocks (OBs) in each filter, resulting in total exposure times of 23 040 s (6.4 h) in the Y and J filters and 20 160 s (5.6 h) in the K-band. To complement this dataset, we use the wide-field optical imaging catalogue from the DESI Legacy Imaging Surveys Data Release 10 (DR10) (Dey et al. 2019) taken from the Victor M. Blanco 4-metre Telescope at Cerro Tololo Inter-American Observatory.
2.1. GCAV dataset and NIR catalogue production
The GCAV dataset of the NIR imaging were reduced with a pipeline written in Julia (Bezanson et al. 2014, v0.6) and following the reduction procedure as in Nonino et al. (2009). This pipeline includes correcting the images for dark current, flat-field ,and static marks. The astrometric solution was derived using the GAIA DR2 sources3 and performed using Scamp (Bertin 2006, v2.0.4). The zero points were derived for each co-added tile using the procedure described in González-Fernández et al. (2018), to calibrate the photometry. Then the background subtraction was performed to finally tile and deep stack the images using Swarp (Bertin et al. 2002, v2.19.1).
The NIR catalogues were produced using Source Extractor (Bertin & Arnouts 1996). Source Extractor provides the fluxes and magnitudes for each of the apertures defined, along with the total flux and magnitude. We used the dual-mode extraction where the targets in the J-band were extracted based on their K-band counterparts to produce a consolidated catalogue of NIR parameters.
2.2. Multi-band catalogue and star-galaxy separation
The DESI Legacy Imaging Surveys DR104 offers photometry in the griz optical bands for most parts of the Southern hemisphere outside the Galactic plane (|b|> 20 deg). This catalogue is complemented with existing spectroscopic redshifts (Caminha et al. 2022; Mahler et al. 2023; Noirot et al. 2023) and DECam DR10 photometric redshifts. These spectroscopic redshifts allowed us to carry out the selection of the potential cluster members and create the cluster catalogue.
We cross-matched the NIR targets with the DECam catalogue within a matching radius of 1.0 arcsec. For comparison, the median positional offsets obtained from the cross-match of the NIR and DECam catalogues for r < 22 galaxies identified as potential cluster members from their NIR colours (Sect. 3.1) is just 0.06 arcsec. While the type parameter in the DESI Legacy Imaging Survey catalogues provide an excellent discriminator between point sources and extended sources, we used our NIR photometry to perform the star-galaxy separation, taking advantage of the fact that stars have bluer J − K colours than all but the most local galaxies. The combination of J − K colour with a measure of resolvedness of sources permits a more conservative separation of stars and galaxies, in which only objects that are both unresolved and have blue J − K colours are classified as stars. We adopted this validated star-galaxy separation method from previous surveys such as GAMA (Baldry et al. 2010), DEVILS (Davies et al. 2018), and the upcoming 4HS (Taylor et al. 2023). Baldry et al. (2010) and Taylor et al. (2023) used the NIR colour against the resolvedness of the objects, while Davies et al. (2018) used all the NIR bands against the surface brightness to separate the galaxies from the stars. Our approach uses the difference between the total and aperture magnitudes as the measure of resolvedness, in which the aperture magnitude is measured within a diameter of 1.0 arcsec to match the typical size of a point source. Figure 1 demonstrates the effectiveness of the J − K colour versus magnitude difference plot in separating stars (blue stars) and galaxies (orange points), based on the DECam star-galaxy separator. The stars are concentrated at the bottom-right of the plot ,while we see that the galaxies spread across the top region. Since the stars have a bluer J − K colour and cluster galaxies are much redder in Figure 1, we were able to confidently use this complete galaxy sample.
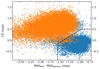 |
Fig. 1. Stars (blue stars) and galaxies (orange circles) are plotted using the DECam Catalogue’s star-galaxy separator. The y-axis shows the NIR J − K colour, and the x-axis displays the magnitude difference as indicated. Objects above the black dashed lines are classified as galaxies, while those below are considered stars. |
3. Spectroscopic observations
3.1. Target selection
To select potential cluster members of SMACS J0723 to be targeted for spectroscopy, we consider the empirical observation that galaxies of a particular redshift (or members of a galaxy cluster) all lie along a single narrow J − K/K colour-magnitude relation, whose location moves steadily redder with increasing redshift (at least over 0 < z < 0.6). This permits the J − K/K colour-magnitude diagram to be used as an observationally straightforward substitute for photometric redshifts. The LoCuSS cluster galaxy evolution survey showed that by using colour-cuts either side of this linear C-M relation to select probable cluster members from their JK photometry for follow-up spectroscopy, they could efficiently assemble highly-complete stellar-mass-limited samples of cluster galaxies that are bias-free with respect to star formation activity (Haines et al. 2009). They showed that the cluster members lie along a single linear relation irrespective of whether they are star-forming or quiescent galaxies. The successful application of this methodology within the LoCuSS survey of 30 massive galaxy clusters at 0.15 < z < 0.30 motivated us to adopt this approach to select probable cluster members of SMACS J0723 from their JK photometry.
To determine the location of this single linear sequence in the J − K/K colour-magnitude diagram, we took advantage of the existing spectroscopic coverage in the cluster core, which includes both the brightest cluster members but also extends down to faint magnitudes. Figure 2 shows the location of the 61 spectroscopic cluster members (red open circles; Caminha et al. 2022; Mahler et al. 2023; Noirot et al. 2023) in the J − K/K colour-magnitude diagram, demonstrating that they all lie along a single linear sequence over 18 < K < 22. Therefore, a line is fit to the 61 spectroscopically confirmed members and the scatter in J − K colour about the relation determined. We then consider all galaxies within 2.5σ of the relation (between the orange lines) to be potential cluster members. These targets form the input catalogue for the IMACS observing mask.
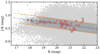 |
Fig. 2. NIR colour-magnitude relation for potential cluster members is plotted. Grey points are galaxies cross-matched between the DECam DR10 and VIRCAM catalogues, while red circles are those corresponding to literature redshifts used to create the best fit (blue) in the J − K versus K-band plot. The NIR J − K colour is used as a redshift proxy since cluster galaxies have similar colours. Targets within 2.5σ of the fit (dark grey region) are considered potential cluster members and form the IMACS target catalogue. |
3.2. Multi-object spectroscopic observing strategy
The multi-object spectroscopic (MOS) data for SMACS J0723 at z ∼ 0.39 was obtained using the IMACS wide-field spectrograph on the 6.5-m Magellan Baade telescope at LCO. We used the 8K × 8K CCD mosaic of the f/2 camera which has a FoV of 27.5 × 27.5 square arcmin. The field was observed as part of programme CN2023A-16 (PI: Amrutha Belwadi) under clear conditions, with a multi-slit mask on 10 March 2023 for a total exposure time of 3 hours, consisting of 12 science frames of 900 seconds each. The multi-slit mask was produced using the MaskGen software5 (MaskGen 2.28.93; Dressler et al. 2011), with a uniform slit width of 1-arcsec and a slit length of 6 arcsec, placing a total of 229 slits within an area corresponding to 2r200 from the cluster centre. Target galaxies were selected using the colour-magnitude relation as described in Section 3.1. The average seeing during the observing run was ∼1.1 arcsec with an airmass of ∼1.5. The f/2 camera, the WB6300-9500 filter and the 200 lines per mm grism were utilised, covering the wavelength range from ∼6300 Å to ∼9500 Å and giving a spectral resolution of 10 Å at the blaze wavelength. This wavelength range is suitable to confirm cluster membership, as it covers both Hα and Hβ lines at the cluster redshift. Spectroscopic flats were obtained with the Quartz high-intensity lamp with a 2 second exposure and the calibration arcs needed for wavelength calibration were obtained with the HeNeAr lamp with a 3 second exposure taken after every three science exposures.
4. Data reduction and analysis
The spectroscopic data for SMACS J0723 were reduced using a combination of IRAF 2.7 (Tody 1986) and the IMACS data reduction pipeline COSMOS2.216 (Kelson 2003; Dressler et al. 2011; Oemler et al. 2017). Approaching multi-slit spectra is slightly different from the single long-slit case and we follow the procedure indicated in the COSMOS2.21 Cookbook. The mask file generated using MaskGen for the observing run was used to align the slits on the calibration lamp exposure. Three bright and well-isolated lines were chosen within the wavelength range of the filter to align the mask and correct for the optical distortions that arise due to the instrument. Once the images were corrected for the distortions, they were bias-subtracted and flat-fielded using the spectral flats. The sky subtraction was then performed, followed by the extraction of the two-dimensional spectra. Using the scopy task in IRAF, we separated each of the spectra into FITS-formatted images. Figure 3 shows the IMACS mask coverage of SMACS J0723 with blue diamonds marking the locations of the 213 slits for which we could extract a spectrum.
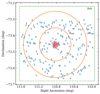 |
Fig. 3. Galaxies observed with the IMACS instrument in a 27.5 × 27.5 square arcminute field of view is shown with a green dotted-dashed box. Red circles are cluster galaxies with known spectroscopic redshifts (Caminha et al. 2022; Mahler et al. 2023; Noirot et al. 2023), while blue diamonds are those observed in this study. Orange circles indicate the r200 and 2r200 boundaries of the cluster. |
The observations of the spectrophotometric standard star were conducted with the same setup as that of the SMACS J0723 dataset and the spectra reduced with the standard procedure to derive the sensitivity function of the instrument. This sensitivity function is then used to calibrate each galaxy spectrum. The redshift for each galaxy was determined from its 1D spectrum using RVSAO (Kurtz et al. 1992; Kurtz & Mink 1998) within IRAF. The RVSAO package uses a cross-correlation function technique (Tonry & Davis 1979; Statler 1995) to estimate the redshift of the object. We also performed manual calculations of the redshift from several emission and absorption lines wherever available. In some cases, we have more than one galaxy spectrum in a single slit and we estimate their redshifts separately. Each spectrum gets a quality flag (QF) if the redshift can be obtained and the QF is assigned based on the number of absorption or emission lines used to determine the redshift. Therefore, QF = 1 uses one line to determine the redshift, while three or more lines give a QF = 3 or higher depending on the lines used to constrain the redshift. The redshifts with QF = 3 and above are the most reliable and those with a QF = 1 are the least reliable.
Galaxy spectra are a fundamental tool to understand the star formation histories of galaxies and determine their distance in the cosmological context. A galaxy spectrum is an integrated spectrum of the stellar population of the galaxy. It reveals the dominant stellar populations through spectral features such as emission and absorption lines. These spectral features in galaxies are useful to estimate their redshift among other properties. Depending on these features (marked by red dashed lines in Figure 4 and Figure 5), we can classify them into star-forming (SF; presence of emission lines) or quenched (Q; absence of emission lines and presence of absorption lines) galaxies. To determine the redshift of quenched galaxies, we mainly use the Balmer absorption lines (Hα at 6564.61 Å and Hβ at 4862.68 Å), NaD (5895.6 Å) and Mgb (5176.7 Å). In case of star-forming galaxies, we used the Balmer emission lines (Hα at 6564.61 Å and Hβ at 4862.68 Å) and the two [OIII] lines at 4959 Å and 5007 Å.
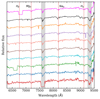 |
Fig. 4. Sample spectra from ten quiescent cluster galaxies sorted by increasing r-band magnitude (18–22) with the brightest galaxy on top. Red dashed lines mark key absorption features (Hα, NaD, Mgb, and Hβ) are located at the median redshift of the cluster at z ∼ 0.39. The grey shaded regions mark telluric lines. |
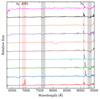 |
Fig. 5. Sample spectra from ten star-forming cluster galaxies sorted by increasing r-band magnitude (18–22) with the brightest galaxy on top. Red dashed lines mark key emission lines (Hα, Hβ, and [OIII]) are located at the median redshift of the cluster at z ∼ 0.39. The grey shaded regions mark telluric lines. |
In total we were able to obtain spectroscopic redshifts for 193 galaxies. None of the objects targeted turned out to be stars. The details of each galaxy observed are listed in Table 1. Columns 1 and 2 are the right ascension and declination of the galaxy in degrees. Column 3 gives the r-band magnitude. Column 4 is the spectroscopic redshift obtained from our IMACS data and column 5 gives its uncertainty. The type of galaxy, cluster membership and the spectroscopic quality flag are listed in columns 6, 7, and 8. The K-band magnitude and the J − K colour for each galaxy is given in columns 9 and 10. Finally, the DECam DR10 photometric redshifts and corresponding uncertainties are listed in columns 11 and 12. We have two cluster galaxies marked in this table with an asterisk (*) that have previously known redshifts and our measurements are consistent with the previous values.
5. X-ray imaging
The X-ray imaging for SMACS J0723 from XMM-Newton covers the full IMACS FoV, out to ∼2r200 (∼4 Mpc). Details of the XMM-Newton observations and data reduction are described in Martino et al. (2014). The contributions to the X-ray signal from the instrumental lines (Lumb et al. 2002) were then removed according to Finoguenov et al. (2007). The resulting image is background-subtracted and co-added. It then undergoes the wavelet transformations as described in Vikhlinin et al. (1998). The resulting image is then carefully cleaned for the detected point sources (Finoguenov et al. 2009), allowing us to identify the extended emission from any X-ray groups in the surroundings of the cluster. The spatial scales for the detection of extended emission 0.5–4 arcminutes sample the outskirts of galaxy groups.
All the detections resulting from the wavelet analysis that have a significance above the 4σ threshold are considered as emission from extended sources. We use deep NIR imaging, optical photometry, and multi-object spectroscopy to identify the extended X-ray sources in multiple wavelength regions. To provide a larger view on the cluster infall regions, we use the extended ROentgen Survey with an Imaging Telescope Array (eROSITA) Data Release 1 mosaic images7. The sensitivity of the released eROSITA observations are a factor of 10 lower than that of XMM-Newton, but it covers the full infall region of the cluster. We used the released images, along with the exposure and background maps to perform the wavelet analysis in two bands (0.2–2.3 keV and 0.6–2.3 keV), finding similar results in terms of detected sources. We have also considered in-field background estimates but found them not to be critically important. Instead, for the interpretation of the X-ray emission on the largest scales (a quarter of a degree), confusion with nearby cluster emission was found to be the most important. We used the spatial scales below 0.5 arcminutes to describe the point sources, and the scales 1–16 arcminutes to describe the extended emission. In comparison to XMM-Newton, eROSITA provides the characterization of the emission on larger spatial scales, which we used to identify major infalling clusters that could substantially affect the dynamics of the system.
6. Results
The main results from this work are the spectroscopic redshifts obtained for 193 galaxies in and around the massive galaxy cluster SMACS J0723. The galaxies are then assigned a cluster membership based on the caustic profile of the cluster in the projected phase space.
6.1. Velocity dispersion
Figure 6 presents the redshift distribution of SMACS J0723 galaxies obtained from our IMACS survey as well as from previous studies, centred on the cluster redshift (z ∼ 0.39). We estimated the median value of the merged spectroscopic sample (this work and literature) to be at 0.3910 ± 0.0007 (blue solid line), consistent with the known cluster redshift and apply a 3σ clipping to remove the outliers. We obtain a clear central peak in the redshift distribution (blue histogram) at z ∼ 0.39, with all cluster members clearly enclosed within the redshift range 0.37–0.41. We report a cluster velocity dispersion of 1430.69 ± 149.98 km s−1 within the virial radius (Danese et al. 1980). While the median redshift of our cluster sample is consistent with that from the literature, the redshift distribution from the literature sample is much wider and flatter. This is because it samples the core of the cluster, where galaxy velocities are the highest due to being fully accelerated by the cluster gravitational potential. Ideally, any cluster with a velocity distribution following a single Gaussian distribution would indicate a relaxed state, suggesting that it is in dynamic equilibrium. We consider an ideal case and fit a single Gaussian to the velocity distribution of the literature sample, indicated by the red histogram, although the distribution suggests a double peak indicating a possible merger. Even though our selection is not biased towards quenched or star-forming galaxies (Figures 4 and 5), by combining our work with the literature (grey histogram), we see that it is still not a single Gaussian distribution. Notably, we see sub-structure in the redshift distribution from our sample, including a sharp peak in the central redshift bin (z ∼ 0.39) that is not seen at all in the literature redshift distribution, due to galaxies located in the cluster’s outskirts (r > r200).
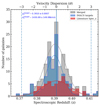 |
Fig. 6. Redshift-velocity dispersion diagram showing three histograms: red for literature redshifts (Caminha et al. 2022; Mahler et al. 2023; Noirot et al. 2023), blue for IMACS-targeted galaxies (this work), and grey for the combined data. We fit a Gaussian distribution to the merged sample. The peak of the distribution is at a median redshift of 0.3910 ± 0.0007 (blue solid line) with 3 − σ upper and lower limits shown as vertical blue dot-dashed lines. |
6.2. Assigning cluster membership
We identified galaxies belonging to SMACS J0723 from the redshift versus projected cluster-centric radius plot (Figure 7) as those lying within the ‘trumpet-shaped’ caustic profile expected for galaxies falling and subsequently orbiting within a massive virialised structure (Diaferio & Geller 1997). For most clusters, there is a strong contrast in phase-space density from inside to outside these caustics making their visual identification relatively simple and unambiguous.
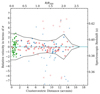 |
Fig. 7. Projected phase-space diagram presenting the caustic curves of redshift versus projected cluster-centric distance. Red open circles and blue stars denote quenched and star-forming galaxies based on their IMACS spectra. Green filled circles mark galaxies with spectroscopic redshifts from the literature (Caminha et al. 2022; Mahler et al. 2023; Noirot et al. 2023). Galaxies within the black caustic lines are classified as cluster members (shown by having brightly-coloured symbols), while non-members have paler colours. The blue horizontal line indicates the median redshift of the cluster. |
To define the caustics, we first estimate the relative velocities of the galaxies with respect to the cluster redshift. These relative velocities are computed using the following equation from (Danese et al. 1980):
![Mathematical equation: $$ \begin{aligned} v_{\rm relative} = \Biggl [\frac{ c(z-{z_{cl}}) }{ (1+{z_{cl}}) } \Biggr ]\, \mathrm{km/s} .\end{aligned} $$](/articles/aa/full_html/2025/07/aa53971-25/aa53971-25-eq1.gif) (1)
(1)
The black caustic lines are defined as the 3σ limit about the median redshift (blue horizontal line) within each of the cluster-centric bins, where the bins are separated by a distance of 2 arcminutes. The caustics are widest for the cluster galaxies at the centre and is seen to narrow down as we move towards larger radii. With the help of this caustic profile, we can easily separate the galaxies within the virialised region and the in-falling galaxies from the non-member galaxies or interlopers. We assign all the galaxies within the region represented by the caustics (black lines) as cluster members. This approach efficiently removes the foreground and background galaxies and provides a clear sample of cluster members irrespective of the cluster-centric distance. From this selection approach, we confirm 91 new member galaxies. This means ∼48% of the extracted galaxy spectra correspond to galaxies that belong to the cluster.
We see background and foreground contamination beyond r200 (∼2 Mpc). We also find a rise in the velocity dispersion at ∼2r200 (∼4 Mpc). The large scatter at 2r200 (∼4 Mpc) could be due to the combination of a smaller sample at this particular distance bin and that there are galaxies which are significantly far away from the cluster mean velocity, as indicated in the plot itself. A more complete coverage of the targets will improve the cluster caustics. Finally, combining the cluster members from this and existing works, we get 150 cluster galaxies.
6.3. Sub-structure analysis
We searched for sub-structure in the velocity distribution of the 150 cluster galaxies (Figure 8) using the weighted gapper method of Wainer & Schacht (1978). This technique is a tool to identify gaps in the space of ordered recession velocities of cluster galaxies, weighted by their location within the ordered velocity distribution, which has frequently been used to find gaps that are significant enough to indicate sub-structures or galaxy groups merging with the main cluster (e.g. Beers et al. 1991; Boschin et al. 2009, 2012). A weighted gap yi is defined as:
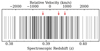 |
Fig. 8. Velocity distribution of galaxies within the cluster’s caustics, each of them shown by a single line. Red arrows, determined by using the Gapping technique, reveal three identified gaps in the sub-structure. |
![Mathematical equation: $$ \begin{aligned} y_i = [w_i g_i]^{1/2} ,\end{aligned} $$](/articles/aa/full_html/2025/07/aa53971-25/aa53971-25-eq2.gif) (2)
(2)
where gi represents the measured gaps between the ordered velocities and wi is a set of approximately Gaussian weights wi = i(n − i) for a sample of n ordered velocities, vi. To determine whether any individual weighted gap is significantly large enough to indicate a real sub-structure, each weighted gap is normalised by the mid-mean of weighted gaps, yT25, as:
![Mathematical equation: $$ \begin{aligned} z_i^* = \Biggl [ \frac{ y_i }{ y_{T_{25}} } \Biggr ]. \end{aligned} $$](/articles/aa/full_html/2025/07/aa53971-25/aa53971-25-eq3.gif) (3)
(3)
A gap in the velocity distribution is considered unusually large if its normalised weighted gap, zi*, is greater than 2.25. Wainer & Schacht (1978) found that weighted gaps this large arise in no more than 3% of random draws from a Gaussian distribution, independent of sample size. They also note that the use of the mid-mean to normalise the weighted gaps enables this statistical test to be relatively robust in the case of velocity distributions that exhibit fatter tails than the Gaussian. We found three such significant gaps in the velocity distribution of cluster galaxies, indicated by the red downward arrows in Figure 8. The two gaps (zi* = 2.4812, 2.6315) that are very close to each other in velocity space are associated with the two central clumps (< R200), while the third gap (2.8793) has a lower velocity compared to the other two gaps. The three significant gaps in velocity divide the cluster into four groups of galaxies with 57(G1), 47(G2), 12(G3) and 34(G4) in increasing velocity. We note that we did not observe any sub-structure when comparing the spatial distributions of the galaxies in these four groups (G1–G4).
6.4. Photometric analysis
Figure 9 shows the J − K/K colour-magnitude diagram of our 93 spectroscopically-confirmed cluster members. The star-forming galaxies (blue stars) and the quiescent galaxies (open red circles) that belong to the cluster can be seen to lie along the same linear CM-relation. This demonstrates that our NIR selection of cluster galaxies is independent of whether they are actively forming stars or passively evolving; hence, it is unbiased with respect to the star formation history, demonstrating that the methodology used by LoCuSS to select likely cluster galaxies at lower redshifts (Haines et al. 2009) can be successfully applied to clusters at z ∼ 0.4.
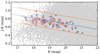 |
Fig. 9. NIR colour-magnitude relation with assigned 93 member galaxies. Light-grey points are all galaxies from the optical and NIR catalogues. The blue solid line is the best fit for spectroscopic cluster members as in Figure 2, with orange lines showing the 2.5 sigma limits. The red open circles have quenched galaxy spectra (absorption spectra) and the blue open stars have star-forming galaxy spectra (emission spectra). This plot demonstrates the unbiased selection of cluster members using the NIR CM relation. |
Figure 10 shows the g − r versus r-band optical colour-magnitude diagram of the spectroscopically confirmed members of SMACS J0723, highlighting our uniform sampling of cluster galaxies over the magnitude range 18.3 < r < 22.0. It shows the bimodality in galaxy colour, demonstrating the value of being able to target star-forming and quiescent galaxies alike, by providing a view on the relative mass distribution of star-forming and quiescent galaxies in this z ∼ 0.4 cluster. There is a significant population of star-forming galaxies (blue stars) displaying a range of blue colours (0.5 < g − r < 1.4) across a wide range of r-band magnitude (19.5 < r < 22.0). The passively evolving red sequence galaxies (red open circles) fall along a linear sequence (g − r ∼ 1.7; black solid line). Hence, the colour-magnitude diagram shows the diversity in the stellar population within the cluster. We notice a few quiescent galaxies (red circles) having bluer colours indicating that the galaxies could be recently quenched.
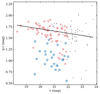 |
Fig. 10. g − r versus r colour-magnitude diagram for member galaxies: red open circles for quenched galaxies, blue open stars for star-forming ones, and grey points for previously confirmed members. The black line represents the best fit for the quenched galaxies that form the red sequence as they all lie along a linear relation (black solid line). This linear relation was fitted in a two-stage process. First we fit a Gaussian function to the g − r colour distribution of the quiescent galaxies (red open circles), deriving its mean and σ. We then apply the Theil-Sen linear regression method (Sen 1968) to all spectroscopic members with g − r colours within 2.5σ of the mean g − r colour of the red sequence (i.e. with g − r > 1.34). We see a bimodal distribution of cluster galaxies, where the quenched galaxies have redder g − r colour compared to the star-forming galaxies. |
We estimated the star-forming fraction of galaxies within the cluster virial radius to be 0.26 ± 0.03 (where the measured uncertainty assumes binomial statistics), which is slightly larger than the expected value for clusters at this redshift (Haines et al. 2013). To better understand what could cause this high level of star formation activity within the cluster, we attempted to place this cluster in its cosmological context by mapping the distribution of galaxies in the surrounding large-scale structure, split into star-forming and quiescent where possible. Ideally, we would have spectroscopic coverage over the entire infall regions of the cluster out to its turnaround radius (∼5r200; Bertschinger 1985; Rines & Diaferio 2006; Pizzardo et al. 2023), but given the expensiveness of obtaining such spectroscopy, we must rely on our NIR photometric selection to statistically identify the potential cluster members out to 5r200. Given that we will not have a spectroscopic classification of all these galaxies into star-forming and quiescent, a suitable photometric classification is required.
Previous studies of the optical colour-magnitude diagram of cluster galaxies have found a significant contamination of the red sequence coming from dusty star-forming galaxies, whose red colours are due to dust reddening rather than old stellar populations (Haines et al. 2008). It has been shown, however, that this degeneracy between age and dust in colour can be overcome by considering well-chosen colour-colour pairs where dust reddening acts in a direction orthogonal to the effect of increasing stellar age (Wolf et al. 2005; Arnouts et al. 2013; Patel et al. 2012). With this in mind, Figure 11 plots the grz colour-colour distribution of star-forming (blue stars) and quiescent (red circles) cluster galaxies from the IMACS sample, enabling us to define the photometric separation of the two populations as the two black dashed lines. The quenched galaxies show redder colours and form a clump around r − z ∼ 0.9, g − r ∼ 1.75, while the star-forming galaxies are mainly spread along a sequence that extends diagonally upwards to the right of the clump of quiescent galaxies (i.e. the star-forming galaxies have redder r − z colours at fixed g − r colour than quiescent ones).
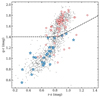 |
Fig. 11. Optical g − r versus r − z colour-colour distribution of cluster galaxies. Grey points are potential cluster members selected via the J − K versus K CM relation, filtered further by photometric redshift (0.29 ≤ zphot ≤ 0.49). This galaxy colour separation shows its evolution from star-forming to being quenched and behaves as a proxy to photometrically separate them. Red circles denote quenched galaxies and blue stars are star-forming ones and have IMACS spectroscopy. Black dashed lines separate these two types, with quenched galaxies concentrated in a clump above and star-forming galaxies spread below. |
6.5. Dynamical state and cluster outskirts
To further understand the evolution of galaxies within the cluster, we estimated the star-forming fraction as a function of cluster-centric radius out to five times the virial radius of the cluster. We extracted all the cluster members out to 5r200, relying on the available photometric data. We used an r-band magnitude limit of 21.5 and a K-band magnitude brighter than 21.0. With the separation of star-forming galaxies from the quenched galaxies as shown in Figure 11, we estimated the star-forming galaxy fraction within a cluster-centric distance binning of 0.5r200, extending out to 5r200. To be consistent when comparing cluster galaxies with field galaxies, we created a sample of field galaxies at 0.35 ≤ z ≤ 0.45 from the CLASH-VLT Spectroscopic Survey8 (Rosati et al. 2014). The CLASH-VLT Survey studied a total of 13 massive galaxy clusters in CLASH (Postman et al. 2012) and targeted both member and non-member galaxies, selected based on their RC-band magnitudes, with optical colour cuts to reduce contamination of background galaxies (Balestra et al. 2016). The targets were not biased towards star-forming or quenched galaxies. Out of the 13 galaxy clusters, 6 clusters have public spectroscopic catalogues9. Hence, we considered a list of non-member galaxies from five cluster catalogues (after excluding MACS J0416.1-2403, since it has a redshift 0.396, almost identical to SMACS J0723 and, thus, all the galaxies in that catalogue at z ∼ 0.39 belong to the cluster, rather than being field galaxies.)
Figure 12 shows the fraction of star-forming cluster galaxies in SMACS J0723 (blue stars) as a function of cluster-centric distance out to 5r200, demonstrating the typical increase in SF-galaxy fraction with increasing cluster-centric distance. However, this fraction in the cluster remains well below that in the coeval field population (fSF ≈ 0.74; black dashed line), even at 5r200 (∼10 Mpc). This shortfall of star-forming galaxies even well beyond the virial radius of the cluster, indicates that environmental processes are responsible for the quenching of some galaxies well before they reach the cluster. One possible explanation is that galaxies are first being pre-processed within groups in the infall regions. Therefore, analysing the X-ray emission of the cluster and its immediate surroundings could help us understand this shortfall in star-forming galaxies at large radii, as well as the dynamics and evolution of the cluster as a whole.
 |
Fig. 12. Star-forming galaxy fraction versus cluster-centric distance. Blue stars represent the star-forming galaxy fraction in 0.5r200 radial bins. The error bars indicate the uncertainties in the fraction derived from binomial statistics. The star-forming fraction shows a steady increase with cluster-centric distance. However, this fraction remains lower than that in the coeval field (grey dashed line), indicating that environmental processes are quenching galaxies before they join the cluster dynamics or in-fall region. |
The galaxy density distribution (grey contours) of SMACS J0723 is shown in Figure 13, on top of which, the member galaxies observed using IMACS (this work) and observed by Caminha et al. (2022), Mahler et al. (2023) and Noirot et al. (2023) are plotted. In the previous sub-sections, we demonstrate our spectroscopic redshift contribution to the demographic of the galaxy cluster SMACS J0723 within the virialised region (< 2r200). Apart from SMACS J0723, the only other significant source of extended X-ray emission in our wavelet-reconstructed XMM images (magenta contours) is located ∼10′ to the NW of the cluster (RA ∼110.25°, Dec ∼ − 73.34°). This source is right on the edge of the XMM field-of-view, so it is likely that we only have a partial view of its emission, affecting the central location of X-ray emission. However, from the RedMaPPer Photometric Catalogue, we have established that this X-ray emission is associated with a foreground group at z ∼ 0.19. While we could not identify any in-falling groups in this XMM X-ray imaging, the galaxy distribution (grey contours) does appear to be elongated in the SE–NW direction.
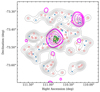 |
Fig. 13. Spatial distribution of cluster galaxies is shown with red circles for quiescent galaxies from our spectroscopic sample and blue stars for the star-forming ones, while green points mark spectroscopic cluster members from the literature. Light-grey contours indicate the galaxy number density of the spectroscopic members, while magenta contours show the XMM X-ray emission within 2r200. The top-right X-ray emission is at the edge of XMM coverage and needs further analysis. No in-falling groups were detected (except the core), as the X-ray peaks do not coincide with the galaxy overdensities. |
Complementing this dataset with the eROSITA all-sky X-ray imaging, in Figure 14, we plot the galaxy density distribution in grey contours and the eROSITA X-ray emission in magenta contours, now extending out to 5r200 (∼10 Mpc). The spectroscopic cluster members are plotted on top with star-forming galaxies in blue stars and quenched galaxies in red circles. The black crosses show the brightest galaxies (K < 18.0) that are potentially cluster members. We do not see much overlap of the X-ray contours with the brightest galaxies. However, it cannot be concluded that there are no galaxy groups associated with the X-ray emission.
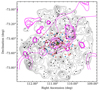 |
Fig. 14. Galaxy density distribution is traced with light-grey contours and X-ray emission in the 0.2–2.3 keV band from eRASS1 with magenta. Quenched galaxies are marked with red open circles, star-forming galaxies with blue open stars, and galaxies with literature redshifts are shown as solid green circles. The brightest galaxies (K < 18.0) are highlighted with black crosses. No bright galaxies coincide with X-ray peaks except in the cluster core. |
7. Discussion
This work presents the first wide-field spectroscopic survey of SMACS J0723 at z ∼ 0.39 with the objective of studying galaxy evolution and transformation both within this massive galaxy cluster and in its immediate surroundings. For comparison, all previous spectroscopic observations of SMACS J0723 were spatially confined to the cluster core (Noirot et al. 2023; Mahler et al. 2023; Caminha et al. 2022), while their objectives were limited to precisely determining the cluster redshift, confirming its nature as a massive cluster based on its high velocity dispersion, and measuring redshifts of the gravitational arcs needed to produce highly-constrained mass distributions from strong lensing and to characterise the magnification maps.
Through our multi-slit spectroscopic observations carried out with the IMACS instrument, we were able to measure redshifts for 193 galaxies, including 93 confirmed cluster members. This redshift information extends out to 2r200 (∼4 Mpc), facilitating the assessment of the cluster dynamical state, and aims to improve the strong lensing models to perform a comprehensive study of this cluster. The velocity dispersion of galaxies within the virial radius of the cluster was measured as 1431 ± 150 km s−1, confirming SMACS J0723 as a very massive galaxy cluster comparable to other well-studied massive clusters at these redshifts including: Abell S1063 at z = 0.3457 with a velocity dispersion (σv) of  km s−1 (Mercurio et al. 2021); MACS J1206.2-0847 at z = 0.44 with
  km s−1 (Girardi et al. 2015); and MACS J0416.1-2403 at z = 0.397 with
  km s−1 (Balestra et al. 2016).
Even at these late epochs, massive galaxy clusters are still rapidly increasing their mass and galaxy populations through the frequent accretion of galaxy groups (McGee et al. 2009), typically doubling their masses and richnesses since z ∼ 0.5 (Boylan-Kolchin et al. 2009). The more massive of these groups should be detectable through their X-ray emission. Our spectroscopic observations revealed a filamentary structure passing from the south-east to the north-west (SE–NW) through the cluster, which is likely an extension to large scales of the elongated X-ray emission and mass distribution derived from strong-lensing modelling (Mahler et al. 2023). The large-scale galaxy distribution also reveals a number of promising clumps of red galaxies in the cluster infall regions (Fig. 13) that are suggestive of infalling groups. However, none of the extended X-ray sources found in the XMM-Newton or eROSITA X-ray data (Fig. 14) were associated to these systems. The dynamical complexity of the SMACS J0723 system is also revealed in its velocity distribution, with multiple peaks and apparent gaps (Figs. 6, 8), helping us develop a coherent picture of the ongoing assembly and future growth of SMACS J0723. Such dynamical complexity appears widespread among massive clusters at z ∼ 0.4, reflecting their status of growing rapidly by accreting galaxy groups. For example, Abell S1063, MACS J0416.1-2403, and MACS J1206.2-0847, all show significant elongation in their central mass distribution and/or X-ray emission, as well as having multiple galaxy clumps in their surroundings (Estrada et al. 2023; Mercurio et al. 2021; Girardi et al. 2015).
For a spectroscopic survey of cluster galaxies to be suitable for studying their global properties, along with their evolution and transformation within the cluster environment, it is vital that targets are selected in a manner that is unbiased with respect to their star formation histories and over a range of environments (i.e. not just the cluster core). This motivated our use of the J − K/K colour-magnitude diagram to select targets. The empirical observation that both star-forming and quiescent cluster galaxies lie along the same linear relation (Fig. 9) validates this choice of methodology for acquiring unbiased samples of cluster galaxies for SMACS J0723. This unbiased selection aligned with the wide field-of-view of IMACS permits us to examine the demographics of the cluster galaxy population of SMACS J0723 as a function of environment, based on a representative sample of cluster galaxies out to 2r200. The optical distribution of galaxies in the g − r/r colour magnitude diagram (Fig. 10) revealed both a clear cluster red sequence and a significant population of blue star-forming galaxies over a wide magnitude range.
We obtained a best-fitting linear relation for the red sequence of g − r = −0.0490 × (r − 21.0)+1.6614 for SMACS J0723 and a standard deviation of 0.1242 in g − r. In comparison, the red sequence fit to the cluster MACS J0416.1-2403 at z = 0.397 (Estrada et al. 2023), which has a similar redshift of SMACS J0723, is defined as g − r = −0.0662 × (r − 21.0)+1.6631, with a standard deviation of 0.0813. The similarity in the red-sequence fits for the two galaxy clusters implies that they have evolved in a similar manner and exhibit similar galaxy properties such as colour, star formation rate, stellar masses, and star formation histories, as they belong to similar epochs. We suggest that the tighter red sequence for MACS J0416.1-2403 is likely due to its larger sample size (801 spectroscopic members), enabling Estrada et al. (2023) to more efficiently define the red sequence population and remove outliers via clipping.
Figure 12 showed that the fraction of star-forming cluster galaxies in the infall regions of SMACS J0723 remained stubbornly below that seen in the coeval field population. This trend holds true even at cluster-centric distances (2–5r200) greater than the maximal distance that backsplash galaxies can bounce out of the cluster after first infall (Mamon et al. 2004). This apparent shortfall of star-forming galaxies in the infall regions, well beyond the virial radius, parallels similar trends seen in studies of cluster galaxy populations at lower redshifts (Haines et al. 2015; Lopes et al. 2024). Lopes et al. (2024) studied the fractions of star-forming galaxies around z < 0.1 galaxy clusters using spectroscopic data from the SDSS. They split the galaxies in the infall regions into individual cluster galaxies and those within the infalling galaxy groups. By splitting the galaxies in this way, they show that the fraction of star-forming cluster galaxies that are not associated with groups rises steadily with increasing cluster-centric distance over 1–5r200 approaching the field value. On the other hand, the fraction of star-forming galaxies that are members of groups in the infall regions, remains flat over 2–5r200, gradually falling further below that seen in the individual cluster galaxies at the same cluster-centric radius – and much lower than that seen in the coeval field. These trends are consistent with the widespread pre-processing of galaxies in these infalling groups, quenching star formation in a significant fraction of galaxies in the infall regions of clusters prior to their accretion into the cluster itself. While our analysis is only based on photometric redshifts beyond 2r200, it does suggest that these trends are already in place around massive clusters at z ∼ 0.4. This is also supported by Just et al. (2019), who found enhanced red fractions in the infall regions of 21 EDisCS clusters at 0.4 < z < 0.8 relative to coeval field populations and greater clustering among the red galaxies in the infall regions than the blue ones, which they interpreted as evidence of pre-processing.
In an analysis combining GALEX ultraviolet imaging and Keck optical spectroscopy of the clusters Cl 0024+17 at z = 0.39 and MS 0451-03 at z = 0.54, Moran et al. (2006, 2007a) found a population of passive (with EW[OII]  ) spiral galaxies, characterised by intermediate UV-optical colours (FUV − V ∼ 2–3) and D4000 breaks (D4000 ∼ 1.4–1.6) as well as weak Hδ absorption (
 ). This is consistent with quenching over 1–2 Gyr time-scales, rather than a rapid truncation of star formation activity. Many of these passive spirals are located in infalling groups, and in conjunction with the finding of an increased scatter in the Tully-Fisher relation of these cluster spirals relative to the field relation (Moran et al. 2007a,b) suggested a scenario where these spirals are being slowly quenched and transformed into S0s via galaxy-galaxy interactions within these infalling groups. Moran et al. (2007a) also found a population of young S0s (with d4000 < 1.55 and OII emission), providing further evidence of this evolutionary transformation in intermediate-redshift clusters. Interestingly, in a CO(3–2) survey of 27 galaxies in the infall regions of galaxy cluster Cl 1411.1-1148 at z = 0.52, selected to lie along the main star-forming sequence, Spérone-Longin et al. (2021) found ten (37%) galaxies with unusually low molecular gas fractions. These ten galaxies also showed short gas-depletion timescales.
The above results indicate that there is a strong need for spectroscopic studies covering the infall regions of z ∼ 0.4 clusters to understand the evolution of galaxies and the effect of environmental processes in galaxy quenching with respect to distance from the cluster centre and stellar mass. Such a vast survey of this cluster in particular will be performed by the ESO 4MOST (S15) CHileAN Cluster galaxy Evolution Survey (CHANCES) (Haines et al. 2023) and will address the above-mentioned points. CHANCES will facilitate the study of the evolution and formation of the large-scale structures in the Universe, by analysing 150 massive galaxy clusters (z < 0.45) across the southern hemisphere.
8. Conclusions
We have presented the first wide-field spectroscopic survey of the massive galaxy cluster SMACS J0723, covering the virial region and out to 2r200 (∼4 Mpc). The multi-slit spectroscopic observations were carried out using the IMACS f/2 instrument on the 6.5-m Magellan-Baade telescope. This work provides the first results of an ongoing program of IMACS multi-slit spectroscopic observations of massive galaxy clusters at 0.3 < z < 0.6, aimed at a detailed mapping of the large-scale structure around each cluster, identifying in-falling galaxy groups, and studying pre-processing at these intermediate redshifts. The entire dataset for the cluster SMACS J0723 consists of the optical griz photometry and photometric redshifts from DECam DR10, NIR photometry from VIRCAM (J, K) and WISE (W1, W2), as well as XMM and eROSITA X-ray imaging. The key findings of this work are given below.
-
We measured spectroscopic redshifts for 193 galaxies (Table 1) in and around the massive galaxy cluster SMACS J0723, of which 93 are cluster members. Incorporating redshifts from previous works, a total of 150 galaxies are now spectroscopically confirmed as members of SMACS J0723.
-
From the merged redshift catalogue of SMACS J0723 cluster members, we obtained a central redshift of 0.3910 ± 0.0007 and velocity dispersion of 1431 ± 150 km s−1.
-
The IMACS data allow us to map the spatial distribution of cluster galaxies out to 2r200 for the first time, revealing a filamentary structure passing SE–NW through the cluster. This filament is likely related to the highly elongated distribution of mass and X-ray emission along the E–W axis seen in the central regions of SMACS J0723 (Mahler et al. 2023). We also see a number of group-like systems in the infall regions centred on clumps of quiescent galaxies (Fig. 12), even if we were unable to associate any of these clumps with extended X-ray emission in either the XMM-Newton or eROSITA maps.
-
The dynamical complexity of the SMACS J0723 system is also revealed in its velocity distribution, with multiple peaks and velocity gaps, helping us develop a coherent picture of the ongoing assembly and future growth of SMACS J0723.
-
The fraction of star-forming cluster galaxies was measured as a function of cluster-centric radius out to 5r200, and found to remain consistently lower in the infall regions (2–5r200) than that seen among the coeval field population. This result parallels the trends seen for lower redshift clusters by Haines et al. (2018) and Lopes et al. (2024), who explained them as being due to a significant fraction of galaxies in the infall regions being pre-processed within groups.
This work presents the first confirmation of the large-scale structure around SMACS J0723 and examines its impact on the evolution of galaxies as they fall into this massive cluster at z = 0.39. The high signal-to-noise (S/N) spectra will also allow us to study the star formation histories, ages, and metallicities of the stellar populations in these galaxies. Further IMACS pointings will permit us to expand the spatial coverage beyond 2r200 and increase the completeness in denser regions. In the near future, CHANCES (Haines et al. 2023) is expected to provide a uniform spectroscopic coverage of this cluster out to 5r200, with the objective of addressing when, where, and how environmental mechanisms affect the evolution of cluster galaxies.
Data availability
Table 1 is available at the CDS via anonymous ftp to cdsarc.cds.unistra.fr (130.79.128.5) or via https://cdsarc.cds.unistra.fr/viz-bin/cat/J/A+A/699/A105
Acknowledgments
B.M.A. acknowledges the Universidad de Atacama PhD Scholarship and the Fondecyt Regular 2021 Grant (project number 1211909) of C.P.H., PhD Supervisor, for the expenses to successfully conduct this research. B.M.A. acknowledges the ESO 4MOST CHileAN Cluster galaxy Evolution Survey (CHANCES) Team for their valuable feedback. C.P.H. acknowledges support from ANID through Fondecyt Regular project number 1211909 and ANID – MILENIO – NCN2024_112. R.D. gratefully acknowledges support by the ANID BASAL Project FB210003. U.R. and C.P.H. acknowledge support from ANID through its Fondo de Astronomía Gemini 2022 project 32220023. B.M.A., C.P.H. and R.D. also acknowledges the Support Astronomer, Instrument Specialist and Telescope Operator during this observing run. This research has made extensive use of TOPCAT (Taylor 2005, 2011), SAOImage DS9 (Smithsonian Astrophysical Observatory 2000; Joye & Mandel 2003), Python3 (Van Rossum & Drake 2009) and its packages such as NUMPY 6 (Harris et al. 2020), MATPLOTLIB 7 (Hunter 2007), seaborn (Waskom 2021) and ASTROPY 8 (Astropy Collaboration 2013, 2018).
References
- Arnouts, S., Le Floc’h, E., Chevallard, J., et al. 2013, A&A, 558, A67 [NASA ADS] [CrossRef] [EDP Sciences] [Google Scholar]
- Astropy Collaboration (Robitaille, T. P., et al.) 2013, A&A, 558, A33 [NASA ADS] [CrossRef] [EDP Sciences] [Google Scholar]
- Astropy Collaboration (Price-Whelan, A. M., et al.) 2018, AJ, 156, 123 [Google Scholar]
- Baldry, I. K., Robotham, A. S. G., Hill, D. T., et al. 2010, MNRAS, 404, 86 [NASA ADS] [Google Scholar]
- Balestra, I., Mercurio, A., Sartoris, B., et al. 2016, ApJS, 224, 33 [Google Scholar]
- Balogh, M. L., Morris, S. L., Yee, H. K. C., Carlberg, R. G., & Ellingson, E. 1999, ApJ, 527, 54 [Google Scholar]
- Balogh, M., Eke, V., Miller, C., et al. 2004, MNRAS, 348, 1355 [Google Scholar]
- Beers, T. C., Gebhardt, K., Forman, W., Huchra, J. P., & Jones, C. 1991, AJ, 102, 1581 [NASA ADS] [CrossRef] [Google Scholar]
- Bertin, E. 2006, ASP Conf. Ser., 351, 112 [NASA ADS] [Google Scholar]
- Bertin, E., & Arnouts, S. 1996, A&AS, 117, 393 [NASA ADS] [CrossRef] [EDP Sciences] [Google Scholar]
- Bertin, E., Mellier, Y., Radovich, M., et al. 2002, ASP Conf. Ser., 281, 228 [Google Scholar]
- Bertschinger, E. 1985, ApJS, 58, 39 [Google Scholar]
- Bezanson, J., Edelman, A., Karpinski, S., & Shah, V. B. 2014, ArXiv e-prints [arXiv:1411.1607] [Google Scholar]
- Bianconi, M., Smith, G. P., Haines, C. P., et al. 2018, MNRAS, 473, L79 [CrossRef] [Google Scholar]
- Boschin, W., Barrena, R., & Girardi, M. 2009, A&A, 495, 15 [NASA ADS] [CrossRef] [EDP Sciences] [Google Scholar]
- Boschin, W., Girardi, M., Barrena, R., & Nonino, M. 2012, A&A, 540, A43 [NASA ADS] [CrossRef] [EDP Sciences] [Google Scholar]
- Boselli, A., & Gavazzi, G. 2006, PASP, 118, 517 [Google Scholar]
- Boylan-Kolchin, M., Springel, V., White, S. D. M., Jenkins, A., & Lemson, G. 2009, MNRAS, 398, 1150 [Google Scholar]
- Bravo-Alfaro, H., Scott, T. C., Brinks, E., et al. 2011, in Tracing the Ancestry of Galaxies, eds. C. Carignan, F. Combes, & K. C. Freeman, 277, 296 [Google Scholar]
- Caminha, G. B., Suyu, S. H., Mercurio, A., et al. 2022, A&A, 666, L9 [NASA ADS] [CrossRef] [EDP Sciences] [Google Scholar]
- Cortese, L., Gavazzi, G., Boselli, A., et al. 2006, A&A, 453, 847 [NASA ADS] [CrossRef] [EDP Sciences] [Google Scholar]
- Cortese, L., Catinella, B., & Smith, R. 2021, PASA, 38, e035 [NASA ADS] [CrossRef] [Google Scholar]
- Danese, L., de Zotti, G., & di Tullio, G. 1980, A&A, 82, 322 [NASA ADS] [Google Scholar]
- Davies, L. J. M., Robotham, A. S. G., Driver, S. P., et al. 2018, MNRAS, 480, 768 [NASA ADS] [CrossRef] [Google Scholar]
- Dekel, A., & Silk, J. 1986, ApJ, 303, 39 [Google Scholar]
- Deshev, B., Haines, C., Hwang, H. S., et al. 2020, A&A, 638, A126 [NASA ADS] [CrossRef] [EDP Sciences] [Google Scholar]
- Dey, A., Schlegel, D. J., Lang, D., et al. 2019, AJ, 157, 168 [Google Scholar]
- Diaferio, A., & Geller, M. J. 1997, ApJ, 481, 633 [NASA ADS] [CrossRef] [Google Scholar]
- Donnert, J., Dolag, K., Brunetti, G., & Cassano, R. 2013, MNRAS, 429, 3564 [Google Scholar]
- Dressler, A., Smail, I., Poggianti, B. M., et al. 1999, ApJS, 122, 51 [NASA ADS] [CrossRef] [Google Scholar]
- Dressler, A., Oemler, A., Jr., Poggianti, B. M., et al. 2004, ApJ, 617, 867 [NASA ADS] [CrossRef] [Google Scholar]
- Dressler, A., Bigelow, B., Hare, T., et al. 2011, PASP, 123, 288 [NASA ADS] [CrossRef] [Google Scholar]
- Dressler, A., Oemler, A., Jr., Poggianti, B. M., et al. 2013, ApJ, 770, 62 [NASA ADS] [CrossRef] [Google Scholar]
- Einasto, M., Deshev, B., Tenjes, P., et al. 2020, A&A, 641, A172 [NASA ADS] [CrossRef] [EDP Sciences] [Google Scholar]
- Estrada, N., Mercurio, A., Vulcani, B., et al. 2023, A&A, 671, A146 [NASA ADS] [CrossRef] [EDP Sciences] [Google Scholar]
- Finoguenov, A., Guzzo, L., Hasinger, G., et al. 2007, ApJS, 172, 182 [Google Scholar]
- Finoguenov, A., Connelly, J. L., Parker, L. C., et al. 2009, ApJ, 704, 564 [NASA ADS] [CrossRef] [Google Scholar]
- Fujita, Y. 2004, PASJ, 56, 29 [NASA ADS] [Google Scholar]
- Girardi, M., Mercurio, A., Balestra, I., et al. 2015, A&A, 579, A4 [NASA ADS] [CrossRef] [EDP Sciences] [Google Scholar]
- Gómez, P. L., Nichol, R. C., Miller, C. J., et al. 2003, ApJ, 584, 210 [Google Scholar]
- González-Fernández, C., Hodgkin, S. T., Irwin, M. J., et al. 2018, MNRAS, 474, 5459 [Google Scholar]
- Gunn, J. E., Gott, J., & Richard, I. 1972, ApJ, 176, 1 [Google Scholar]
- Haines, C. P., Gargiulo, A., & Merluzzi, P. 2008, MNRAS, 385, 1201 [NASA ADS] [CrossRef] [Google Scholar]
- Haines, C. P., Smith, G. P., Egami, E., et al. 2009, ApJ, 704, 126 [NASA ADS] [CrossRef] [Google Scholar]
- Haines, C. P., Pereira, M. J., Smith, G. P., et al. 2013, ApJ, 775, 126 [NASA ADS] [CrossRef] [Google Scholar]
- Haines, C. P., Pereira, M. J., Smith, G. P., et al. 2015, ApJ, 806, 101 [NASA ADS] [CrossRef] [Google Scholar]
- Haines, C. P., Finoguenov, A., Smith, G. P., et al. 2018, MNRAS, 477, 4931 [Google Scholar]
- Haines, C., Jaffé, Y., Tejos, N., et al. 2023, Messenger, 190, 31 [Google Scholar]
- Harris, C. R., Millman, K. J., van der Walt, S. J., et al. 2020, Nature, 585, 357 [NASA ADS] [CrossRef] [Google Scholar]
- Hogg, D. W. 1999, ArXiv e-prints [arXiv:astro-ph/9905116] [Google Scholar]
- Hubble, E., & Humason, M. L. 1931, ApJ, 74, 43 [Google Scholar]
- Hunter, J. D. 2007, Comput. Sci. Eng., 9, 90 [NASA ADS] [CrossRef] [Google Scholar]
- Joye, W. A., & Mandel, E. 2003, ASP Conf. Ser., 295, 489 [Google Scholar]
- Just, D. W., Kirby, M., Zaritsky, D., et al. 2019, ApJ, 885, 6 [Google Scholar]
- Kelson, D. D. 2003, PASP, 115, 688 [NASA ADS] [CrossRef] [Google Scholar]
- Kurtz, M. J., & Mink, D. J. 1998, PASP, 110, 934 [NASA ADS] [CrossRef] [Google Scholar]
- Kurtz, M. J., Mink, D. J., Wyatt, W. F., et al. 1992, ASP Conf. Ser., 25, 432 [NASA ADS] [Google Scholar]
- Lewis, I., Balogh, M., De Propris, R., et al. 2002, MNRAS, 334, 673 [NASA ADS] [CrossRef] [Google Scholar]
- Lin, D. N. C., & Faber, S. M. 1983, ApJ, 266, L21 [NASA ADS] [CrossRef] [Google Scholar]
- Liu, A., Bulbul, E., Ramos-Ceja, M. E., et al. 2023, A&A, 670, A96 [NASA ADS] [CrossRef] [EDP Sciences] [Google Scholar]
- Lopes, P. A. A., Ribeiro, A. L. B., & Brambila, D. 2024, MNRAS, 527, L19 [Google Scholar]
- Loubser, S. I., Mosia, K., Serra, P., et al. 2024, MNRAS, 527, 7158 [Google Scholar]
- Lumb, D. H., Warwick, R. S., Page, M., & De Luca, A. 2002, A&A, 389, 93 [CrossRef] [EDP Sciences] [Google Scholar]
- Mahler, G., Jauzac, M., Richard, J., et al. 2023, ApJ, 945, 49 [CrossRef] [Google Scholar]
- Mamon, G. A., Sanchis, T., Salvador-Solé, E., & Solanes, J. M. 2004, A&A, 414, 445 [NASA ADS] [CrossRef] [EDP Sciences] [Google Scholar]
- Martinez Aviles, G., Johnston-Hollitt, M., Ferrari, C., et al. 2018, A&A, 611, A94 [NASA ADS] [CrossRef] [EDP Sciences] [Google Scholar]
- Martino, R., Mazzotta, P., Bourdin, H., et al. 2014, MNRAS, 443, 2342 [NASA ADS] [CrossRef] [Google Scholar]
- McGee, S. L., Balogh, M. L., Bower, R. G., Font, A. S., & McCarthy, I. G. 2009, MNRAS, 400, 937 [Google Scholar]
- Mercurio, A., Rosati, P., Biviano, A., et al. 2021, A&A, 656, A147 [NASA ADS] [CrossRef] [EDP Sciences] [Google Scholar]
- Moran, S. M., Ellis, R. S., Treu, T., et al. 2006, ApJ, 641, L97 [NASA ADS] [CrossRef] [Google Scholar]
- Moran, S. M., Ellis, R. S., Treu, T., et al. 2007a, ApJ, 671, 1503 [Google Scholar]
- Moran, S. M., Miller, N., Treu, T., Ellis, R. S., & Smith, G. P. 2007b, ApJ, 659, 1138 [Google Scholar]
- Noirot, G., Desprez, G., Asada, Y., et al. 2023, MNRAS, 525, 1867 [NASA ADS] [CrossRef] [Google Scholar]
- Nonino, M., Dickinson, M., Rosati, P., et al. 2009, ApJS, 183, 244 [NASA ADS] [CrossRef] [Google Scholar]
- Oemler, A., Clardy, K., Kelson, D., Walth, G., & Villanueva, E. 2017, Astrophysics Source Code Library [record ascl:1705.001] [Google Scholar]
- Olave-Rojas, D., Cerulo, P., Demarco, R., et al. 2018, MNRAS, 479, 2328 [Google Scholar]
- Patel, S. G., Holden, B. P., Kelson, D. D., et al. 2012, ApJ, 748, L27 [NASA ADS] [CrossRef] [Google Scholar]
- Piraino-Cerda, F., Jaffé, Y. L., Lourenço, A. C., et al. 2024, MNRAS, 528, 919 [NASA ADS] [CrossRef] [Google Scholar]
- Pizzardo, M., Geller, M. J., Kenyon, S. J., Damjanov, I., & Diaferio, A. 2023, A&A, 680, A48 [NASA ADS] [CrossRef] [EDP Sciences] [Google Scholar]
- Planck Collaboration IX. 2011, A&A, 536, A9 [NASA ADS] [CrossRef] [EDP Sciences] [Google Scholar]
- Planck Collaboration VIII. 2011, A&A, 536, A8 [NASA ADS] [CrossRef] [EDP Sciences] [Google Scholar]
- Planck Collaboration XXVII. 2016, A&A, 594, A27 [NASA ADS] [CrossRef] [EDP Sciences] [Google Scholar]
- Postman, M., Coe, D., Benítez, N., et al. 2012, ApJS, 199, 25 [Google Scholar]
- Rines, K., & Diaferio, A. 2006, AJ, 132, 1275 [Google Scholar]
- Rosati, P., Balestra, I., Grillo, C., et al. 2014, Messenger, 158, 48 [Google Scholar]
- Sen, P. 1968, J. Am. Stat. Assoc., 63, 1379 [CrossRef] [Google Scholar]
- Sengupta, A., Keel, W. C., Morrison, G., et al. 2022, ApJS, 258, 32 [NASA ADS] [CrossRef] [Google Scholar]
- Sifón, C., Finoguenov, A., Haines, C. P., et al. 2025, A&A, 697, A92 [NASA ADS] [CrossRef] [EDP Sciences] [Google Scholar]
- Smithsonian Astrophysical Observatory 2000, Astrophysics Source Code Library [record ascl:0003.002] [Google Scholar]
- Spérone-Longin, D., Jablonka, P., Combes, F., et al. 2021, A&A, 647, A156 [Google Scholar]
- Spitzer, L., Jr., & Baade, W. 1951, ApJ, 113, 413 [Google Scholar]
- Statler, T. 1995, AJ, 109, 1371 [Google Scholar]
- Taylor, M. B. 2005, ASP Conf. Ser., 347, 29 [Google Scholar]
- Taylor, M. 2011, Astrophysics Source Code Library [record ascl:1101.010] [Google Scholar]
- Taylor, E. N., Cluver, M., Bell, E., et al. 2023, Messenger, 190, 46 [Google Scholar]
- Tody, D. 1986, SPIE Conf. Ser., 627, 733 [Google Scholar]
- Tonry, J., & Davis, M. 1979, AJ, 84, 1511 [Google Scholar]
- Van Rossum, G., & Drake, F. L. 2009, Python 3 Reference Manual (Scotts Valley, CA: CreateSpace) [Google Scholar]
- Vikhlinin, A., McNamara, B. R., Forman, W., et al. 1998, ApJ, 498, L21 [NASA ADS] [CrossRef] [Google Scholar]
- Voges, W., Aschenbach, B., Boller, T., et al. 1999, A&A, 349, 389 [NASA ADS] [Google Scholar]
- Wainer, H., & Schacht, S. 1978, Psychometrika, 43, 203 [Google Scholar]
- Waskom, M. L. 2021, J. Open Source Softw., 6, 3021 [CrossRef] [Google Scholar]
- Wolf, C., Gray, M. E., & Meisenheimer, K. 2005, A&A, 443, 435 [NASA ADS] [CrossRef] [EDP Sciences] [Google Scholar]
- Yang, X., Mo, H. J., van den Bosch, F. C., et al. 2007, ApJ, 671, 153 [Google Scholar]
- Zabludoff, A. I., & Mulchaey, J. S. 1998, ApJ, 496, 39 [Google Scholar]
- Zabludoff, A. I., Zaritsky, D., Lin, H., et al. 1996, ApJ, 466, 104 [NASA ADS] [CrossRef] [Google Scholar]
All Figures
|
Fig. 1. Stars (blue stars) and galaxies (orange circles) are plotted using the DECam Catalogue’s star-galaxy separator. The y-axis shows the NIR J − K colour, and the x-axis displays the magnitude difference as indicated. Objects above the black dashed lines are classified as galaxies, while those below are considered stars. |
| In the text | |
|
Fig. 2. NIR colour-magnitude relation for potential cluster members is plotted. Grey points are galaxies cross-matched between the DECam DR10 and VIRCAM catalogues, while red circles are those corresponding to literature redshifts used to create the best fit (blue) in the J − K versus K-band plot. The NIR J − K colour is used as a redshift proxy since cluster galaxies have similar colours. Targets within 2.5σ of the fit (dark grey region) are considered potential cluster members and form the IMACS target catalogue. |
| In the text | |
|
Fig. 3. Galaxies observed with the IMACS instrument in a 27.5 × 27.5 square arcminute field of view is shown with a green dotted-dashed box. Red circles are cluster galaxies with known spectroscopic redshifts (Caminha et al. 2022; Mahler et al. 2023; Noirot et al. 2023), while blue diamonds are those observed in this study. Orange circles indicate the r200 and 2r200 boundaries of the cluster. |
| In the text | |
|
Fig. 4. Sample spectra from ten quiescent cluster galaxies sorted by increasing r-band magnitude (18–22) with the brightest galaxy on top. Red dashed lines mark key absorption features (Hα, NaD, Mgb, and Hβ) are located at the median redshift of the cluster at z ∼ 0.39. The grey shaded regions mark telluric lines. |
| In the text | |
|
Fig. 5. Sample spectra from ten star-forming cluster galaxies sorted by increasing r-band magnitude (18–22) with the brightest galaxy on top. Red dashed lines mark key emission lines (Hα, Hβ, and [OIII]) are located at the median redshift of the cluster at z ∼ 0.39. The grey shaded regions mark telluric lines. |
| In the text | |
|
Fig. 6. Redshift-velocity dispersion diagram showing three histograms: red for literature redshifts (Caminha et al. 2022; Mahler et al. 2023; Noirot et al. 2023), blue for IMACS-targeted galaxies (this work), and grey for the combined data. We fit a Gaussian distribution to the merged sample. The peak of the distribution is at a median redshift of 0.3910 ± 0.0007 (blue solid line) with 3 − σ upper and lower limits shown as vertical blue dot-dashed lines. |
| In the text | |
|
Fig. 7. Projected phase-space diagram presenting the caustic curves of redshift versus projected cluster-centric distance. Red open circles and blue stars denote quenched and star-forming galaxies based on their IMACS spectra. Green filled circles mark galaxies with spectroscopic redshifts from the literature (Caminha et al. 2022; Mahler et al. 2023; Noirot et al. 2023). Galaxies within the black caustic lines are classified as cluster members (shown by having brightly-coloured symbols), while non-members have paler colours. The blue horizontal line indicates the median redshift of the cluster. |
| In the text | |
|
Fig. 8. Velocity distribution of galaxies within the cluster’s caustics, each of them shown by a single line. Red arrows, determined by using the Gapping technique, reveal three identified gaps in the sub-structure. |
| In the text | |
|
Fig. 9. NIR colour-magnitude relation with assigned 93 member galaxies. Light-grey points are all galaxies from the optical and NIR catalogues. The blue solid line is the best fit for spectroscopic cluster members as in Figure 2, with orange lines showing the 2.5 sigma limits. The red open circles have quenched galaxy spectra (absorption spectra) and the blue open stars have star-forming galaxy spectra (emission spectra). This plot demonstrates the unbiased selection of cluster members using the NIR CM relation. |
| In the text | |
|
Fig. 10. g − r versus r colour-magnitude diagram for member galaxies: red open circles for quenched galaxies, blue open stars for star-forming ones, and grey points for previously confirmed members. The black line represents the best fit for the quenched galaxies that form the red sequence as they all lie along a linear relation (black solid line). This linear relation was fitted in a two-stage process. First we fit a Gaussian function to the g − r colour distribution of the quiescent galaxies (red open circles), deriving its mean and σ. We then apply the Theil-Sen linear regression method (Sen 1968) to all spectroscopic members with g − r colours within 2.5σ of the mean g − r colour of the red sequence (i.e. with g − r > 1.34). We see a bimodal distribution of cluster galaxies, where the quenched galaxies have redder g − r colour compared to the star-forming galaxies. |
| In the text | |
|
Fig. 11. Optical g − r versus r − z colour-colour distribution of cluster galaxies. Grey points are potential cluster members selected via the J − K versus K CM relation, filtered further by photometric redshift (0.29 ≤ zphot ≤ 0.49). This galaxy colour separation shows its evolution from star-forming to being quenched and behaves as a proxy to photometrically separate them. Red circles denote quenched galaxies and blue stars are star-forming ones and have IMACS spectroscopy. Black dashed lines separate these two types, with quenched galaxies concentrated in a clump above and star-forming galaxies spread below. |
| In the text | |
|
Fig. 12. Star-forming galaxy fraction versus cluster-centric distance. Blue stars represent the star-forming galaxy fraction in 0.5r200 radial bins. The error bars indicate the uncertainties in the fraction derived from binomial statistics. The star-forming fraction shows a steady increase with cluster-centric distance. However, this fraction remains lower than that in the coeval field (grey dashed line), indicating that environmental processes are quenching galaxies before they join the cluster dynamics or in-fall region. |
| In the text | |
|
Fig. 13. Spatial distribution of cluster galaxies is shown with red circles for quiescent galaxies from our spectroscopic sample and blue stars for the star-forming ones, while green points mark spectroscopic cluster members from the literature. Light-grey contours indicate the galaxy number density of the spectroscopic members, while magenta contours show the XMM X-ray emission within 2r200. The top-right X-ray emission is at the edge of XMM coverage and needs further analysis. No in-falling groups were detected (except the core), as the X-ray peaks do not coincide with the galaxy overdensities. |
| In the text | |
|
Fig. 14. Galaxy density distribution is traced with light-grey contours and X-ray emission in the 0.2–2.3 keV band from eRASS1 with magenta. Quenched galaxies are marked with red open circles, star-forming galaxies with blue open stars, and galaxies with literature redshifts are shown as solid green circles. The brightest galaxies (K < 18.0) are highlighted with black crosses. No bright galaxies coincide with X-ray peaks except in the cluster core. |
| In the text | |
Current usage metrics show cumulative count of Article Views (full-text article views including HTML views, PDF and ePub downloads, according to the available data) and Abstracts Views on Vision4Press platform.
Data correspond to usage on the plateform after 2015. The current usage metrics is available 48-96 hours after online publication and is updated daily on week days.
Initial download of the metrics may take a while.