Open Access
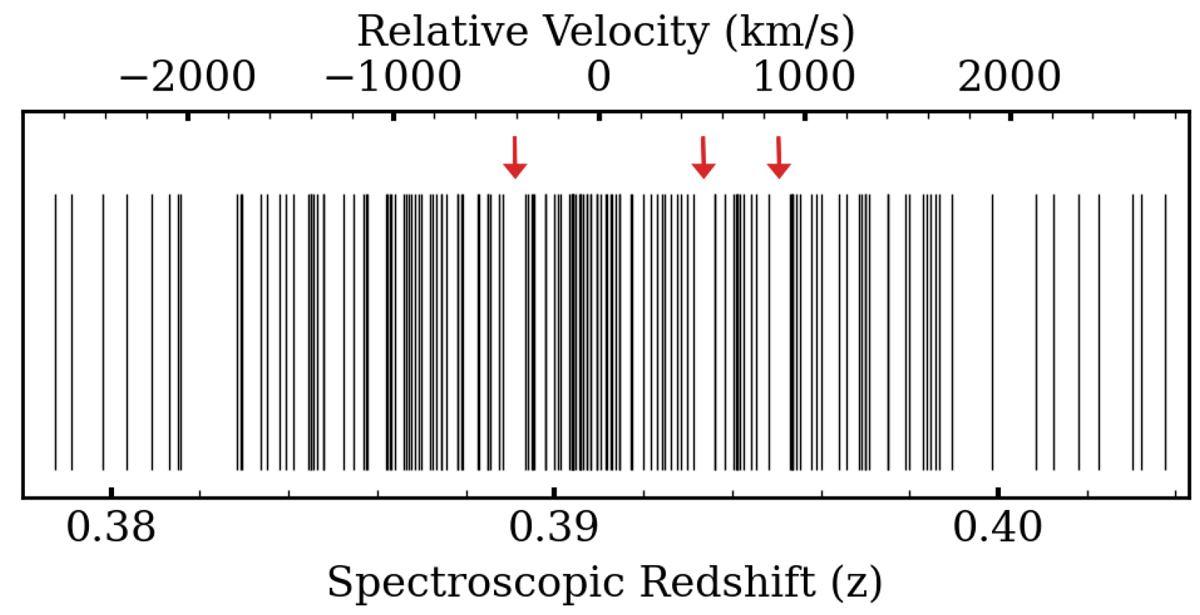
Fig. 8.
Download original image
Velocity distribution of galaxies within the cluster’s caustics, each of them shown by a single line. Red arrows, determined by using the Gapping technique, reveal three identified gaps in the sub-structure.
Current usage metrics show cumulative count of Article Views (full-text article views including HTML views, PDF and ePub downloads, according to the available data) and Abstracts Views on Vision4Press platform.
Data correspond to usage on the plateform after 2015. The current usage metrics is available 48-96 hours after online publication and is updated daily on week days.
Initial download of the metrics may take a while.