Open Access
Fig. 1.
Download original image
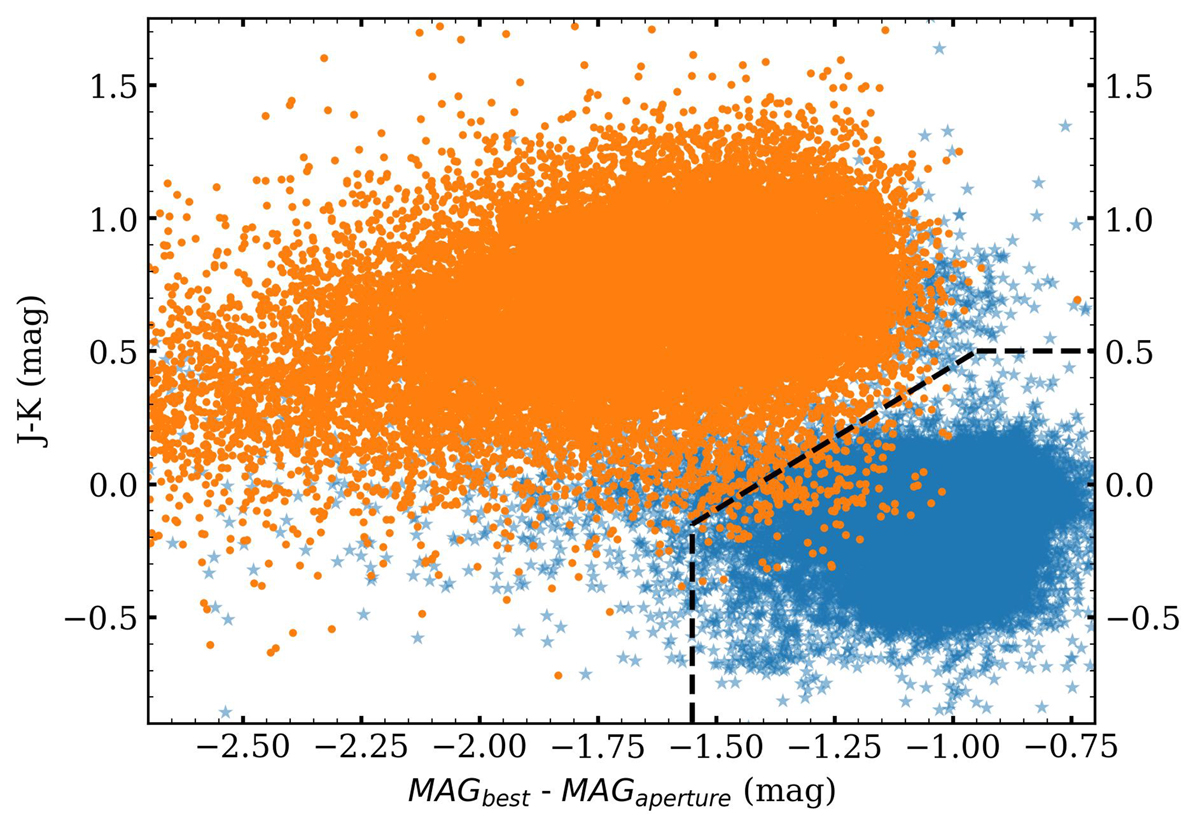
Stars (blue stars) and galaxies (orange circles) are plotted using the DECam Catalogue’s star-galaxy separator. The y-axis shows the NIR J − K colour, and the x-axis displays the magnitude difference as indicated. Objects above the black dashed lines are classified as galaxies, while those below are considered stars.
Current usage metrics show cumulative count of Article Views (full-text article views including HTML views, PDF and ePub downloads, according to the available data) and Abstracts Views on Vision4Press platform.
Data correspond to usage on the plateform after 2015. The current usage metrics is available 48-96 hours after online publication and is updated daily on week days.
Initial download of the metrics may take a while.