Fig. 13.
Download original image
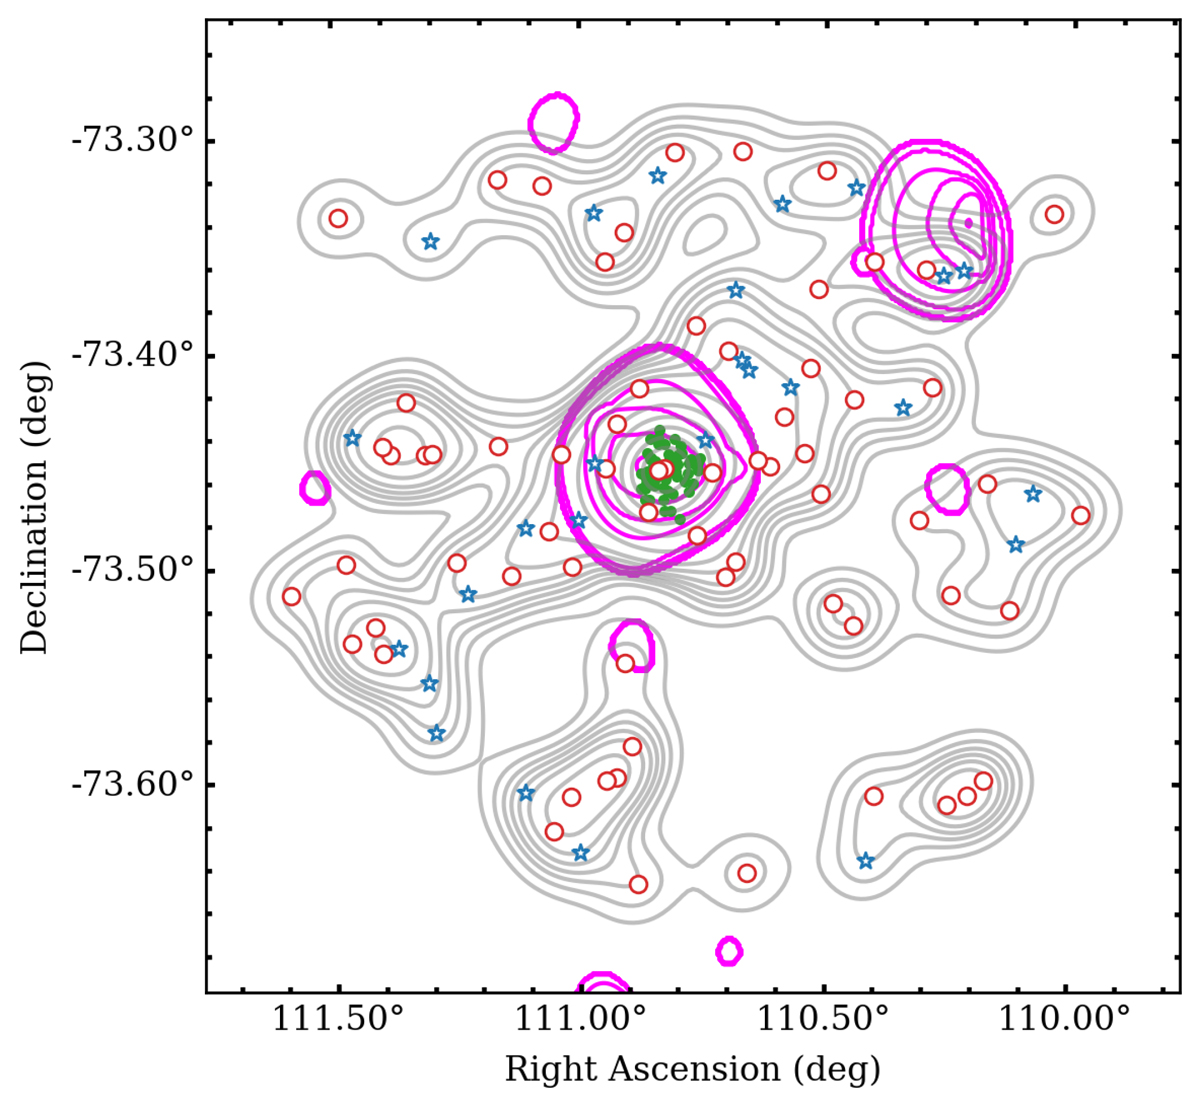
Spatial distribution of cluster galaxies is shown with red circles for quiescent galaxies from our spectroscopic sample and blue stars for the star-forming ones, while green points mark spectroscopic cluster members from the literature. Light-grey contours indicate the galaxy number density of the spectroscopic members, while magenta contours show the XMM X-ray emission within 2r200. The top-right X-ray emission is at the edge of XMM coverage and needs further analysis. No in-falling groups were detected (except the core), as the X-ray peaks do not coincide with the galaxy overdensities.
Current usage metrics show cumulative count of Article Views (full-text article views including HTML views, PDF and ePub downloads, according to the available data) and Abstracts Views on Vision4Press platform.
Data correspond to usage on the plateform after 2015. The current usage metrics is available 48-96 hours after online publication and is updated daily on week days.
Initial download of the metrics may take a while.