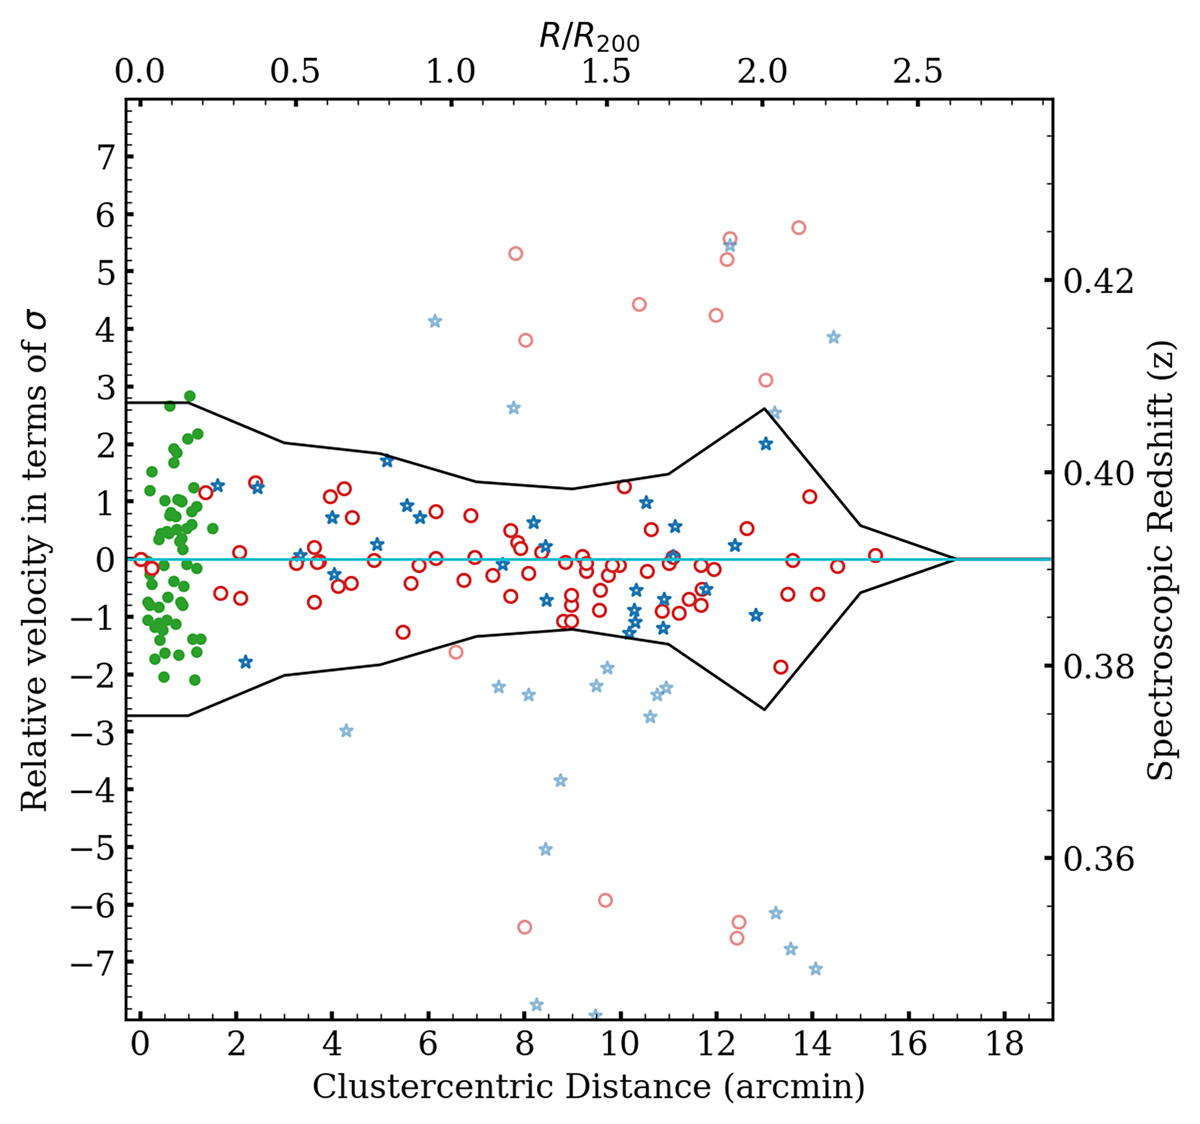
Fig. 7.
Download original image
Projected phase-space diagram presenting the caustic curves of redshift versus projected cluster-centric distance. Red open circles and blue stars denote quenched and star-forming galaxies based on their IMACS spectra. Green filled circles mark galaxies with spectroscopic redshifts from the literature (Caminha et al. 2022; Mahler et al. 2023; Noirot et al. 2023). Galaxies within the black caustic lines are classified as cluster members (shown by having brightly-coloured symbols), while non-members have paler colours. The blue horizontal line indicates the median redshift of the cluster.
Current usage metrics show cumulative count of Article Views (full-text article views including HTML views, PDF and ePub downloads, according to the available data) and Abstracts Views on Vision4Press platform.
Data correspond to usage on the plateform after 2015. The current usage metrics is available 48-96 hours after online publication and is updated daily on week days.
Initial download of the metrics may take a while.