| Issue |
A&A
Volume 698, May 2025
|
|
|---|---|---|
| Article Number | L17 | |
| Number of page(s) | 9 | |
| Section | Letters to the Editor | |
| DOI | https://doi.org/10.1051/0004-6361/202453410 | |
| Published online | 11 June 2025 | |
Letter to the Editor
The MeerKAT massive distant clusters survey: A radio halo in a massive galaxy cluster at z = 1.23
1
Astrophysics Research Centre, University of KwaZulu-Natal, Durban, 3696
South Africa
2
School of Mathematics, Statistics & Computer Science, University of KwaZulu-Natal, Westville Campus, Durban, 4041
South Africa
3
Wits Centre for Astrophysics, School of Physics, University of the Witwatersrand, Private Bag 3, 2050
Johannesburg, South Africa
4
INAF-Istituto di Radioastronomia, Via Gobetti 101, 40129
Bologna, Italy
5
Centre for Radio Astronomy Techniques and Technologies, Department of Physics and Electronics, Rhodes University, P.O. Box 94, Makhanda, 6140
South Africa
6
South African Radio Astronomy Observatory, 2 Fir Street, Black River Park, Observatory, Cape Town, 7925
South Africa
7
European Southern Observatory, Karl-Schwarzschild-Str. 2, 85748
Garching, Germany
8
Department of Astronomy, Haverford College, Haverford, PA, 19041
USA
9
Instituto de Física, Pontificia Universidad Católica de Valparaíso, Casilla 4059, Valparaíso, Chile
10
Instituto de Astrofísica and Centro de AstroIngeniería, Facultad de Física, Pontificia Universidad Católica de Chile, Av. Vicuña Mackenna 4860, 7820436
Macul, Santiago, Chile
11
NASA Goddard Space Flight Center, 8800 Greenbelt Rd, Greenbelt, MD, 20771
USA
⋆ Corresponding author: sikhosanas@ukzn.ac.za
Received:
12
December
2024
Accepted:
5
May
2025
In the current theoretical paradigm, high-redshift radio haloes are expected to be scarce due to inverse Compton energy losses and redshift dimming, which cause them to be intrinsically faint. This low occurrence fraction is predicted by cosmic ray electron turbulent re-acceleration models. To date, only a handful of radio haloes have been detected at redshift z > 0.8. We report the MeerKAT detection of a radio halo hosted by the galaxy cluster ACT-CL J0329.2–2330 that has a mass of M500c = 9.7+1.7−1.6 × 10¹⁴ M⊙ and is at z = 1.23, making it the highest redshift halo detected thus far. Using L-band and UHF-band observations, we derive a radio halo spectral index of α1.3 GHz0.8GHz = 1.3 ± 0.4 and a radio power of P1.4 GHz = (4.4 ± 1.5)×1024 W Hz−1 that is similar to the typical radio power of haloes hosted by low-redshift galaxy clusters. This result further confirms that there is rapid magnetic field amplification in galaxy clusters at high redshifts.
Key words: galaxies: clusters: intracluster medium / radio continuum: galaxies / X-rays: galaxies: clusters
© The Authors 2025
 Open Access article, published by EDP Sciences, under the terms of the Creative Commons Attribution License (https://creativecommons.org/licenses/by/4.0), which permits unrestricted use, distribution, and reproduction in any medium, provided the original work is properly cited.
This article is published in open access under the Subscribe to Open model. Subscribe to A&A to support open access publication.
1. Introduction
Galaxy clusters, which are at the top of the hierarchical structure formation, grow by accreting smaller systems during cluster mergers (Press & Schechter 1974). These merger events release enormous amounts of energy (∼1064 ergs), which is partially dispersed through shocks and turbulence in the intracluster medium (ICM). The turbulent activity induces magnetic field amplification and the (re-)acceleration of cosmic ray electrons (CRes) to relativistic energies (γ ∼ 103 – 104). Such environments are conducive to the formation of cluster-wide synchrotron radiation that is not attributed to individual galaxies. This megaparsec-scale non-thermal diffuse emission is generally categorised as radio haloes and relics. The origin of haloes and relics has long been debated by proponents of Leptonic and Hadronic models, with observations favouring Leptonic models (see Brunetti & Jones 2014; van Weeren et al. 2019, for reviews).
Radio relics are highly polarised (up to ∼70%; Stuardi et al. 2022; Di Gennaro et al. 2023), elongated radio sources located at the periphery of galaxy clusters and exhibit filamentary morphologies (de Gasperin et al. 2022). The origin of relics is linked to the shock waves that propagate through the ICM during cluster mergers. The electrons scattered in the shock regions are accelerated to relativistic energies via diffusive shock acceleration (Fermi 1949; Drury 1983; Hoeft & Brüggen 2007). X-ray studies reveal that the Mach numbers of cluster shocks are too low (ℳ < 3) to reproduce the observed relic structures and luminosities purely from accelerating electrons in the thermal pool (Markevitch et al. 2005; Di Gennaro et al. 2019). Thus, the current scenario is that relics are formed by the diffusive shock acceleration of a pre-accelerated CRe population (Pinzke et al. 2013; Bonafede et al. 2014; Botteon et al. 2020a). Indeed, a few recent studies have connected relics to head-tail (HT) radio galaxies, which are candidate sources of seed electrons (e.g. van Weeren et al. 2017; Rajpurohit et al. 2021).
Radio haloes are located in the central region of galaxy clusters and have a regular morphology, which tends to trace the X-ray-emitting ICM (Govoni et al. 2001). From observations, the origin of haloes aligns with the Leptonic model, where pre-existing seed relativistic electrons are re-accelerated by merger-induced turbulence (Brunetti et al. 2001; Cassano & Brunetti 2005; Feretti et al. 2012; Donnert & Brunetti 2014). Observations have linked radio haloes to host clusters with high masses (M500 > 4 × 10¹⁴ M⊙) and merger signatures (Markevitch et al. 2005; Cassano et al. 2010; Cuciti et al. 2015; Knowles et al. 2019). The presence of haloes with ultra-steep radio spectra1 (α > 1.5) further supports the Leptonic model. It has been theoretically shown that the re-acceleration of secondary electrons arising from proton-proton collisions may also contribute to synchrotron radiation (Brunetti & Lazarian 2011; Pinzke et al. 2017). However, this is not a significant contribution as proposed by Hadronic models (Dennison 1980; Dolag & Enßlin 2000). The sensitivity of low-frequency instruments, such as the Low-Frequency Array (LOFAR; van Haarlem et al. 2013), has resulted in the discovery of new classes of diffuse emission. The recent discovery of mega haloes (Cuciti et al. 2022) has further challenged our understanding of CRe transportation in galaxy clusters.
At high redshifts, the surface brightness of radio haloes and relics is affected by the inverse Compton (IC) energy losses of the CRe (CRe IC scattering lifetimes scale as (1 + z)4) and redshift dimming effects (Brunetti & Jones 2014). It is therefore expected that the radio halo occurrence rate decreases at higher redshifts. Lindner et al. (2014) were the first to detect a radio halo at a relatively high redshift of z = 0.870. The host cluster is the massive ACT-CL J0102–4915 (‘El Gordo’; Menanteau et al. 2012, M500c = (1.17 ± 0.17)×1015 M⊙). Di Mascolo et al. (2021) reported a tentative detection of diffuse emission in SPT J2106–5844, which is at redshift z = 1.13. However, they could not claim a definite detection due to the limited resolution of their observations from the Australian Square Kilometre Array Pathfinder and the lack of sensitivity of the data from the Australia Telescope Compact Array.
Due to the scarcity of high-redshift haloes and relics, statistical studies have been constrained to nearby galaxy cluster samples (z ∼ 0.1 − 0.4; Cassano et al. 2013; Cuciti et al. 2021). Recently, Di Gennaro et al. (2021a) observed a Planck-selected sample of high redshift (0.6 < z < 0.9) clusters (Planck Collaboration XXVII 2016). In their study, they reported a halo occurrence fraction of 50% and that the haloes exhibited radio luminosities similar to those hosted by nearby clusters (z ∼ 0.2). They hence concluded that observing such luminosities at higher redshifts implies that the magnetic field strengths in high-redshift clusters are similar to those in galaxy clusters at lower redshifts. Therefore, magnetic fields are amplified faster during the first phases of cluster formation.
In this Letter, we report the discovery of the highest-redshift radio halo detected to date, detected in deep MeerKAT L- and UHF-band observations, hosted by ACT-CL J0329.2–2330 (hereafter ACT-CL J0329). ACT-CL J0329 is reported in the Sunyaev–Zeldovich (SZ) cluster catalogue compiled as part of the Atacama Cosmology Telescope (ACT) Data Release 5 (Hilton et al. 2021) and also appears in the SPTpol Extended Cluster Survey catalogue (Bleem et al. 2020). It is at a photometric redshift of z = 1.23 and has a mass of M M⊙ (Hilton et al. 2021). The ACT SZ cluster properties are summarised in Table 1. This radio halo detection gives us insight into non-thermal astrophysical phenomena that occurred when the universe was less than half its current age (∼8.5 billion years ago). This letter is organised as follows: We outline the MeerKAT observations and data reduction in Sect. 2. In Sect. 3 we present the MeerKAT results, and in Sect. 4 we present our conclusions. We adopt a Λ cold dark matter flat cosmology with H0 = 70 km s−1 Mpc−1, Ωm = 0.3, and ΩΛ = 0.7. At the redshift of ACT-CL J0329 (z = 1.23), the luminosity distance is 8535.6 Mpc, and 1″ corresponds to 8.32 kpc.
Properties of ACT-CL J0329.2–2330.
2. MeerKAT observations and data reduction
MeerKAT is a 64-antenna array operated by the South African Radio Astronomy Observatory (SARAO; Jonas 2009; Camilo et al. 2018). MeerKAT’s longest baseline is 8 km, resulting in a 6″ resolution in the L band (900 − 1670 MHz). Approximately three-quarters of the antennas are located within a 1 km radius, with a minimum baseline of 29 m resulting in a UHF-band maximum angular scale of 52′, making MeerKAT an ideal instrument for observing faint extended emission.
ACT-CL J0329 was observed as part of the MeerKAT Massive Distant Cluster Survey (MMDCS) project proposal. This survey aims to obtain L/UHF-band observations of the 30 most massive clusters at z > 1 in the ACT DR5 catalogue (Hilton et al. 2021) with the purpose of studying diffuse radio emission, star formation, and active galactic nucleus activity. The MeerKAT observations were carried out in the L band with a total on-target time of 3.5 h, using a dump rate of 8 sec and 4096 channels. PKS J0408−6545 and J0409−1757 were observed as amplitude and phase calibrators. The detection of a radio halo in ACT-CL J0329 prompted the submission of a follow-up proposal in the UHF band (580−1015 MHz; PI: S.P. Sikhosana). For the UHF observations, the target was observed for 5 h using the 4k channel mode, and the dump rate was 4 sec. A summary of the observations is given in Table 2. We detail the methods used to calibrate and image the data below.
MeerKAT L- and UHF-band observations and FR image properties.
For both L- and UHF-band observations, we used the Containerized Automated Radio Astronomy Calibration (CARACal2) pipeline (Józsa et al. 2020) to calibrate and image the raw visibilities. CARACal uses the Stimela3 (Makhathini 2018) framework to execute tasks from multiple astronomy software tools. The pipeline follows the standard data reduction steps, including flagging, primary calibration, self-calibration, and imaging. We began by flagging all the frequency bands known to be affected by radio frequency interference using the Common Astronomy Software Application (CASA; CASA Team 2022) FLAGDATA task; these flags account for the high-flagged percentages reported in Table 2. We used TRICOLOUR (Hugo et al. 2022) to excise the remaining low-level radio frequency interference. We used CASA tasks to produce delay, bandpass, and gain calibration solutions for the primary calibration step. We implemented the SETJY task to correct for the absolute flux density scales. Self-calibration was carried out using CUBICAL (Kenyon et al. 2018). The imaging was done using WSCLEAN (Offringa et al. 2014), with multi-scale and wideband deconvolution algorithms enabled and the BRIGGS ROBUST (Briggs 1995) set to 0. The details of the full-resolution (FR) images are presented in Table 2, and the primary beam-corrected images are shown in Figs. B.3 and B.4.
In Fig. 1, faint diffuse emission is visible in the central region of the cluster in FR images; however, there are bright compact sources embedded. We implemented further image processing steps to remove compact sources. We began by modelling the compact sources in the field by producing a high-resolution (HR) image using WSCLEAN’S INNER-TAPER set to 10 kλ, which corresponds to 173 kpc at the cluster redshift. The chosen taper sufficiently captures the compact sources while resolving the diffuse emission component. We subtracted the compact sources in the visibility plane; this was done by the CASA task UVSUB. We then produced an FR compact-source-subtracted image and used it to examine the success of the compact source removal (see Figs. B.1 and B.2). Lastly, we produced a low-resolution (LR) image by applying an outer taper of 12 kλ. The flux density measurements of the diffuse radio sources were extracted from the LR images using polygon regions for each source, which are guided by the 3σ contour levels. The uncertainty associated with the flux density of the diffuse radio source, measured at frequency ν is given by
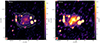 |
Fig. 1. Left: L-band FR image of the radio halo. The local rms of the image is 1σ = 6.6 μJy/beam; the beam size is indicated by the red ellipse. The overlaid contours are from the LR image, which has a local rms of 1σ = 7.1 μJy/beam. The beam size is 14.4″ × 11.3″, 141° pa and is the same for the UHF LR image. The contour levels are σ × [3, 6, 10]. Right: UHF-band FR image of the radio halo. The local rms of the image is 1σ = 13.2 μJy/beam; the beam size is indicated by the red ellipse. The overlaid contours are from the LR image, which has a local rms of 1σ = 17.6 μJy/beam. The contour levels are σ×[3,6,10]. |
where δSν is the flux calibration uncertainty, which we assume to be 5% for L-band (Knowles et al. 2022) and 14% for UHF-band (obtained from cross-matching with the NRAO VLA Sky Survey sources within the primary beam, using α = 0.7 to scale the flux densities), Nbeams is the number of beams within the region that the flux density was measured, and σrms is the local rms noise of the image. σsub is the uncertainty due to compact-source-subtraction, it is given by
where the sum is taken over the number of compact sources (i) subtracted within the polygon region of the diffuse radio source and Nbeam, si is the number of beams covering the ith compact source (see Sect. 3.1 of van Weeren et al. 2021).
We used UV- and resolution-matched UHF- and L-band images to create the spectral index map of the radio halo. The spectral index map was produced using Broadband Radio Astronomy Tools (BRATS; Harwood et al. 2013, 2015). We set the signal-to-noise cutoff to 3σ and the calibration uncertainty to 10%; the rest of the parameters were left to default settings.
3. Results and discussion
The MeerKAT L- and UHF-band LR images reveal extended emission at the centre of ACT-CL J0329. This emission has a largest linear size of 1.1 Mpc at 1.28 GHz and has regular morphology that traces the X-ray emission, as shown in Fig. 2. Here, the X-ray image is obtained from archival Chandra ACIS-I observations (observation IDs 18282 and 18882) with an exposure time of 47 ksec, using the Chandra Interactive Analysis of Observations (CIAO) merge_obs task to merge and exposure correct the images within the default 0.7–7 keV ‘broad’ energy band. Given this strong correspondence between the ICM and diffuse radio emission, we categorise the source as a radio halo. There is a nearby elongated source to the east that connects to the halo emission; in the FR image, this source appears to be a HT radio galaxy. The flux density of the galaxy is 0.64 ± 0.01 mJy and 1.07 ± 0.12 mJy in the L and UHF band, respectively, and its integrated spectral index is 1.1 ± 0.2. We used the FR L- and UHF-band images to produce the spectral index map of the HT galaxy (see Fig. A.3). The map indicates a steepening at the tail end towards the radio halo. After subtracting the compact emission of the HT galaxy, there is residual emission in the LR images, which we measure to have flux densities of 0.29 ± 0.1 mJy and 0.78 ± 0.3 mJy in the L and UHF band, respectively. However, the emission of the elongated source is too faint in the LR images to produce a spectral index map; hence, we cannot unambiguously conclude whether it is a radio relic. The presence of the HT galaxy suggests that it may be the source of fossil electrons deposited in the ICM, resulting in the relic emission, as proposed by the Leptonic model (Lusetti et al. 2024).
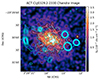 |
Fig. 2. Exposure-corrected Chandra image of ACT-CL J0329, created from observation IDs 18282 and 18882. The cluster was observed for 47 ksec using ACIS-I in VFAINT mode, and the image covers the 0.7–7.0 keV energy band. The image was binned 4 × 4 pixels to a 1.968″ resolution and smoothed by 1 pixel for display purposes. The overlaid cyan contours are from the MeerKAT UHF-band FR image; the contour levels are 3σ× [1,2,3,4,5,6,7,8], where 1σ = 13.2 μJy/beam. |
Using the 3σ contours of the LR images (see Fig. 1) as boundaries, we find that the radio halo has a linear scale of ∼1.1 × 0.9 Mpc2 at 1.28 GHz and ∼900 × 950 kpc2 at 815.9 MHz. We extracted the flux densities in the same region; and the radio halo has a flux density of 3.44 ± 0.2 mJy and 6.11 ± 0.9 mJy in the L and UHF band, respectively. Using flux density measurements, we derive an integrated radio halo spectral index of  = 1.3 ± 0.4. However, the large uncertainty associated with the integrated spectral index limits our discussion. Bootstrapping the L-band flux density, we infer a halo radio power of P1.4 GHz = (4.4 ± 1.5)×1024 W Hz−1. The uncertainties associated with the integrated spectral index and the radio power are obtained with 1000 Monte Carlo realisations. We compared this luminosity with the samples observed in Di Gennaro et al. (2021a), Knowles et al. (2021) and the radio halo in the El Gordo cluster (Lindner et al. 2014). Plotting the P1.4 GHz − −M500 scaling relation, we find that the halo radio power falls within the scatter of both the high-redshift and nearby radio haloes. This is indicated in Fig. 3, where the best-fit line is from scaling the relation studies of nearby radio haloes (z ∼ 0.2) carried out by Cassano et al. (2013). The radio luminosity of the halo falls within the correlation, indicating that the halo is as luminous as nearby (z ∼ 0.2) haloes. If the radio halo power is due to synchrotron emission from the turbulent re-acceleration of electrons, using model assumptions similar to Di Gennaro et al. 2021a, this suggests that the magnetic field strength is similar to that found in low-redshift clusters (i.e., ∼2 μG). Comparing clusters at z = 1.23 and z = 0.2, we find that the ratio between the densities is 4.7, while the ratio between the impact velocities is 2.2; therefore, the ratio between the turbulent energy flux is ∼104. This ratio balances the difference in the factor B2/(B2 + BCMB2) when considering magnetic field strengths of ∼2 μG. This result further confirms that there is rapid magnetic field amplification in galaxy clusters at high redshifts, as discussed in Di Gennaro et al. (2021a).
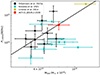 |
Fig. 3. P1.4 GHz−M500 correlation plot of radio haloes. To account for the discrepancies between the ACT and Planck mass derivations, we use the uncorrected M500c values for the ACT clusters (Hilton et al. 2021). The solid line shows the best-fit relation, with parameters extracted from the low-redshift sample (z ∼ 0.2) presented in Cassano et al. (2013), this fit was performed using linear regression in the log-log space by adopting the BCES-bisector method. The Di Gennaro et al. (2021a) sample consists of radio haloes at z > 0.6, and the Knowles et al. (2021) sample covers 0.22 < z < 0.65. We also include El Gordo, which is at z = 0.87 (Lindner et al. 2014). |
Spectral index studies of high-redshift radio haloes are vital for understanding the CRe re-acceleration mechanisms in the early universe. Figure A.1 shows that the spectral index distribution varies from 0.25 to 2.25. The average spectral index value is 1.34, which is comparable to the variation reported in high-redshift radio haloes (Di Gennaro et al. 2021b). A few studies have reported varying spectral index distributions in radio haloes (Botteon et al. 2020b; Rajpurohit et al. 2023). According to Brunetti et al. (2001) and Brunetti & Lazarian (2007), fluctuations in the spectral index over the radio halo regions arise due to the non-uniformity of the magnetic field distribution and different acceleration efficiencies. The physical interpretation could be that the turbulent energy is not homogeneously dissipated in the halo volume. However, the steepest region of the halo (south-east) is likely affected by the residual emission of a compact source embedded in the halo.
Similar to SPT-CL J2106-5844 (Di Mascolo et al. 2021), we posit that this system is an on-going merger. First, Yuan et al. (2022) report a large centroid shift, low concentration, and high morphology index, which, following their earlier definitions in Yuan & Han (2020), are indicative of a disturbed state. Second, further support comes from our examination of the Chandra X-ray images shown in Fig. 2. We note the elongated morphology and dual-peaked core, which is further highlighted by examining the projection shown in Fig. B.6. Neither of these X-ray peaks corresponds to the location of the brightest cluster galaxy seen in Fig. B.5, indicating that the emission is likely due to ICM rather than contamination by X-ray sources such as active galactic nuclei.
4. Conclusion
In this letter, we have presented MeerKAT L- and UHF-band observations of ACT-CL J0329.2–2330, a galaxy cluster at z = 1.23. The LR images reveal a radio halo in the cluster; this is the highest-redshift halo reported to date. The halo has an integrated spectral index of α = 1.3 ± 0.4 and a radio power of 4.4 ± 1.5 × 1024 W Hz−1. This indicates that the halo is as luminous as the haloes found in nearby massive galaxy clusters. We also present the spectral index map of the radio halo, displaying that the average values across the halo (1.34) are in agreement with the integrated spectral index.
Data availability
The reduced MeerKAT images are available at the CDS via anonymous ftp to cdsarc.cds.unistra.fr (130.79.128.5) or via https://cdsarc.cds.unistra.fr/viz-bin/cat/J/A+A/698/L17
The turbulent energy flux scales with the cluster virial radius and the mean cosmic density (see the Methods section of Di Gennaro et al. 2021a).
Acknowledgments
The MeerKAT telescope is operated by the South African Radio Astronomy Observatory, which is a facility of the National Research Foundation, an agency of the Department of Science and Innovation. We acknowledge the assistance of the South African Radio Astronomy Observatory (SARAO) science commissioning and operations team (led by Sharmila Goedhart). SPS acknowledges the financial assistance of the SARAO towards this research. KM and MH acknowledge support from the National Research Foundation of South Africa. CS acknowledges support from the Agencia Nacional de Investigación y Desarrollo (ANID) through Basal project FB210003.
References
- Arnaud, M., Pratt, G. W., Piffaretti, R., et al. 2010, A&A, 517, A92 [CrossRef] [EDP Sciences] [Google Scholar]
- Bleem, L. E., Bocquet, S., Stalder, B., et al. 2020, ApJS, 247, 25 [Google Scholar]
- Bonafede, A., Intema, H. T., Brüggen, M., et al. 2014, ApJ, 785, 1 [Google Scholar]
- Botteon, A., Brunetti, G., Ryu, D., & Roh, S. 2020a, A&A, 634, A64 [NASA ADS] [CrossRef] [EDP Sciences] [Google Scholar]
- Botteon, A., Brunetti, G., van Weeren, R. J., et al. 2020b, ApJ, 897, 93 [Google Scholar]
- Briggs, D. S. 1995, Ph.D. Thesis, New Mexico Institute of Mining and Technology, USA [Google Scholar]
- Brunetti, G., & Jones, T. W. 2014, Int. J. Mod. Phys. D, 23, 1430007 [Google Scholar]
- Brunetti, G., & Lazarian, A. 2007, MNRAS, 378, 245 [Google Scholar]
- Brunetti, G., & Lazarian, A. 2011, MNRAS, 410, 127 [Google Scholar]
- Brunetti, G., Setti, G., Feretti, L., & Giovannini, G. 2001, MNRAS, 320, 365 [Google Scholar]
- Camilo, F., Scholz, P., Serylak, M., et al. 2018, ApJ, 856, 180 [Google Scholar]
- CASA Team (Bean, B., et al.) 2022, PASP, 134, 114501 [NASA ADS] [CrossRef] [Google Scholar]
- Cassano, R., & Brunetti, G. 2005, MNRAS, 357, 1313 [Google Scholar]
- Cassano, R., Ettori, S., Giacintucci, S., et al. 2010, ApJ, 721, L82 [Google Scholar]
- Cassano, R., Ettori, S., Brunetti, G., et al. 2013, ApJ, 777, 141 [Google Scholar]
- Cuciti, V., Cassano, R., Brunetti, G., et al. 2015, A&A, 580, A97 [CrossRef] [EDP Sciences] [Google Scholar]
- Cuciti, V., Cassano, R., Brunetti, G., et al. 2021, A&A, 647, A51 [EDP Sciences] [Google Scholar]
- Cuciti, V., de Gasperin, F., Brüggen, M., et al. 2022, Nature, 609, 911 [NASA ADS] [CrossRef] [Google Scholar]
- de Gasperin, F., Rudnick, L., Finoguenov, A., et al. 2022, A&A, 659, A146 [NASA ADS] [CrossRef] [EDP Sciences] [Google Scholar]
- Dennison, B. 1980, BAAS, 12, 471 [Google Scholar]
- Dey, A., Schlegel, D. J., Lang, D., et al. 2019, AJ, 157, 168 [Google Scholar]
- Di Gennaro, G., van Weeren, R. J., Andrade-Santos, F., et al. 2019, ApJ, 873, 64 [NASA ADS] [CrossRef] [Google Scholar]
- Di Gennaro, G., van Weeren, R. J., Brunetti, G., et al. 2021a, Nat. Astron., 5, 268 [Google Scholar]
- Di Gennaro, G., van Weeren, R. J., Cassano, R., et al. 2021b, A&A, 654, A166 [NASA ADS] [CrossRef] [EDP Sciences] [Google Scholar]
- Di Gennaro, G., Brüggen, M., van Weeren, R. J., et al. 2023, A&A, 675, A51 [NASA ADS] [CrossRef] [EDP Sciences] [Google Scholar]
- Di Mascolo, L., Mroczkowski, T., Perrott, Y., et al. 2021, A&A, 650, A153 [NASA ADS] [CrossRef] [EDP Sciences] [Google Scholar]
- Dolag, K., & Enßlin, T. A. 2000, A&A, 362, 151 [NASA ADS] [Google Scholar]
- Donnert, J., & Brunetti, G. 2014, MNRAS, 443, 3564 [NASA ADS] [CrossRef] [Google Scholar]
- Drury, L. O. 1983, Rep. Prog. Phys., 46, 973 [Google Scholar]
- Feretti, L., Giovannini, G., Govoni, F., & Murgia, M. 2012, A&ARv, 20, 54 [Google Scholar]
- Fermi, E. 1949, Phys. Rev., 75, 1169 [NASA ADS] [CrossRef] [Google Scholar]
- Gaia Collaboration (Vallenari, A., et al.) 2023, A&A, 674, A1 [NASA ADS] [CrossRef] [EDP Sciences] [Google Scholar]
- Govoni, F., Enßlin, T. A., Feretti, L., & Giovannini, G. 2001, A&A, 369, 441 [NASA ADS] [CrossRef] [EDP Sciences] [Google Scholar]
- Harwood, J. J., Hardcastle, M. J., Croston, J. H., & Goodger, J. L. 2013, MNRAS, 435, 3353 [NASA ADS] [CrossRef] [Google Scholar]
- Harwood, J. J., Hardcastle, M. J., & Croston, J. H. 2015, MNRAS, 454, 3403 [NASA ADS] [CrossRef] [Google Scholar]
- Hilton, M., Sifón, C., Naess, S., et al. 2021, ApJS, 253, 3 [Google Scholar]
- Hoeft, M., & Brüggen, M. 2007, MNRAS, 375, 77 [Google Scholar]
- Hugo, B. V., Perkins, S., Merry, B., Mauch, T., & Smirnov, O. M. 2022, ASP Conf. Ser., 532, 541 [NASA ADS] [Google Scholar]
- Jonas, J. L. 2009, IEEE Proc., 97, 1522 [Google Scholar]
- Józsa, G. I. G., White, S. V., Thorat, K., et al. 2020, Astrophysics Source Code Library [record ascl: 2006.014] [Google Scholar]
- Kenyon, J. S., Smirnov, O. M., Grobler, T. L., & Perkins, S. J. 2018, MNRAS, 478, 2399 [NASA ADS] [CrossRef] [Google Scholar]
- Knowles, K., Baker, A. J., Bond, J. R., et al. 2019, MNRAS, 486, 1332 [Google Scholar]
- Knowles, K., Pillay, D. S., Amodeo, S., et al. 2021, MNRAS, 504, 1749 [NASA ADS] [CrossRef] [Google Scholar]
- Knowles, K., Cotton, W. D., Rudnick, L., et al. 2022, A&A, 657, A56 [NASA ADS] [CrossRef] [EDP Sciences] [Google Scholar]
- Lindner, R. R., Baker, A. J., Hughes, J. P., et al. 2014, ApJ, 786, 49 [NASA ADS] [CrossRef] [Google Scholar]
- Lusetti, G., de Gasperin, F., Cuciti, V., et al. 2024, MNRAS, 528, 141 [NASA ADS] [CrossRef] [Google Scholar]
- Makhathini, S. 2018, Ph.D. Thesis, Rhodes University, Drosty Rd, Grahamstown, 6139, Eastern Cape, South Africa, Available via http://hdl.handle.net/10962/57348 [Google Scholar]
- Markevitch, M., Govoni, F., Brunetti, G., & Jerius, D. 2005, ApJ, 627, 733 [Google Scholar]
- Menanteau, F., Hughes, J. P., Sifón, C., et al. 2012, ApJ, 748, 7 [NASA ADS] [CrossRef] [Google Scholar]
- Offringa, A. R., McKinley, B., Hurley-Walker, N., et al. 2014, MNRAS, 444, 606 [Google Scholar]
- Pearce, C. J. J., van Weeren, R. J., Andrade-Santos, F., et al. 2017, ApJ, 845, 81 [Google Scholar]
- Pinzke, A., Oh, S. P., & Pfrommer, C. 2013, MNRAS, 435, 1061 [Google Scholar]
- Pinzke, A., Oh, S. P., & Pfrommer, C. 2017, MNRAS, 465, 4800 [Google Scholar]
- Planck Collaboration XXVII. 2016, A&A, 594, A27 [NASA ADS] [CrossRef] [EDP Sciences] [Google Scholar]
- Press, W. H., & Schechter, P. 1974, ApJ, 187, 425 [Google Scholar]
- Rajpurohit, K., Wittor, D., van Weeren, R. J., et al. 2021, A&A, 646, A56 [EDP Sciences] [Google Scholar]
- Rajpurohit, K., Osinga, E., Brienza, M., et al. 2023, A&A, 669, A1 [NASA ADS] [CrossRef] [EDP Sciences] [Google Scholar]
- Stuardi, C., Bonafede, A., Rajpurohit, K., et al. 2022, A&A, 666, A8 [Google Scholar]
- Vacca, V., Feretti, L., Giovannini, G., et al. 2014, A&A, 561, A52 [NASA ADS] [CrossRef] [EDP Sciences] [Google Scholar]
- van Haarlem, M. P., Wise, M. W., Gunst, A. W., et al. 2013, A&A, 556, A2 [NASA ADS] [CrossRef] [EDP Sciences] [Google Scholar]
- van Weeren, R. J., Ogrean, G. A., Jones, C., et al. 2017, ApJ, 835, 197 [Google Scholar]
- van Weeren, R. J., de Gasperin, F., Akamatsu, H., et al. 2019, Space Sci. Rev., 215, 16 [Google Scholar]
- van Weeren, R. J., Shimwell, T. W., Botteon, A., et al. 2021, A&A, 651, A115 [NASA ADS] [CrossRef] [EDP Sciences] [Google Scholar]
- Yuan, Z. S., & Han, J. L. 2020, MNRAS, 497, 5485 [Google Scholar]
- Yuan, Z. S., Han, J. L., & Wen, Z. L. 2022, MNRAS, 513, 3013 [NASA ADS] [CrossRef] [Google Scholar]
Appendix A: Variations in the spectral index map
Figure A.1 displays the spectral index map of the radio halo. The map was obtained using UHF- and L-band LR images. The map indicates a range of spectral index values across the halo, with the average value being 1.34.
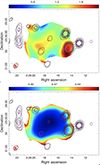 |
Fig. A.1. Top: Spectral index map of the radio halo and the corresponding error map. The overlaid black and magenta contours are from the MeerKAT UHF band and L band’s HR images, respectively. For both images, the contour levels are σ×[3,9,18,27]. 1σ is 12.4 μJy/beam for the UHF-band image and 4.9 μJy/beam for the L-band image. Bottom: Corresponding error map. |
The variations in spectral index maps can sometimes be due to measurement errors. According to Vacca et al. (2014) and Pearce et al. (2017), if the variations are due to measurement errors, the median error value should be comparable to the standard deviation. The spectral index distributed for the maps is indicated in Fig. A.2. The median error of the distribution is 0.05, and the standard deviation is 0.52, thus implying that the fluctuations in the spectral index map are intrinsic.
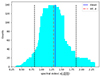 |
Fig. A.2. Histogram of the spectral index distribution for the halo in ACT-CL J0329. The blue solid line indicates the average spectral index value α = 1.34. The dashed black lines show the standard deviation around the mean, σ = 0.52. The dot-dashed red line is the integrated spectral index. |
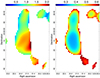 |
Fig. A.3. Spectral index map of the HT radio galaxy produced from the FR UHF- and L-band images. |
Appendix B: Ancillary images of ACT-CL J0329.2-2330
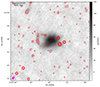 |
Fig. B.1. L-band FR compact-source-subtracted image with contour overlays of the HR image. The contour levels are σ×[3,12,24,30], where 1σ is 4.9 μJy/beam. The beam of the HR image is 6.5″×5.5″, 166° pa. |
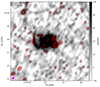 |
Fig. B.2. UHF-band FR compact-source-subtracted image with contour overlays of the HR image. The contour levels are σ×[3,12,24,30], where 1σ is 12.4 μJy/beam. The beam of the HR image is 10.7″×8.1″, 146° pa. |
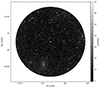 |
Fig. B.3. MeerKAT L-band full field of view image of ACT-CL J0329. The rms noise of the image is 6.6 μJy/beam. |
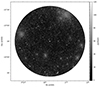 |
Fig. B.4. MeerKAT UHF-band full field of view image of ACT-CL J0329. The rms noise of the image is 13.2 μJy/beam. |
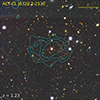 |
Fig. B.5. Optical grz image of ACT-CL J0329 from DECaLS (Dey et al. 2019). The overlaid contours are from the MeerKAT UHF-band LR images, the contour levels are σ×[3,6,10]; where 1σ = 17.6 μJy/beam. The white source at the centre is a foreground star located at a distance of ≈1500 pc as recorded in Gaia DR3 (Gaia Collaboration 2023). |
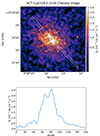 |
Fig. B.6. Chandra X-ray image and the projection used to highlight the disturbed morphology of the cluster. Upper: Exposure-corrected Chandra image of ACT-CL J0329, created from observation IDs 18282 and 18882, as in Fig. 2. The blue contours trace the X-ray surface brightness, while the dashed white box shows the regions used to extract a profile. Lower: Surface brightness profile using data extracted from the smoothed X-ray image within the dashed white box in the upper panel. While no error bars are provided, the two peaks as well as the steep drops in surface brightness are clear above the noise. |
All Tables
All Figures
|
Fig. 1. Left: L-band FR image of the radio halo. The local rms of the image is 1σ = 6.6 μJy/beam; the beam size is indicated by the red ellipse. The overlaid contours are from the LR image, which has a local rms of 1σ = 7.1 μJy/beam. The beam size is 14.4″ × 11.3″, 141° pa and is the same for the UHF LR image. The contour levels are σ × [3, 6, 10]. Right: UHF-band FR image of the radio halo. The local rms of the image is 1σ = 13.2 μJy/beam; the beam size is indicated by the red ellipse. The overlaid contours are from the LR image, which has a local rms of 1σ = 17.6 μJy/beam. The contour levels are σ×[3,6,10]. |
| In the text | |
|
Fig. 2. Exposure-corrected Chandra image of ACT-CL J0329, created from observation IDs 18282 and 18882. The cluster was observed for 47 ksec using ACIS-I in VFAINT mode, and the image covers the 0.7–7.0 keV energy band. The image was binned 4 × 4 pixels to a 1.968″ resolution and smoothed by 1 pixel for display purposes. The overlaid cyan contours are from the MeerKAT UHF-band FR image; the contour levels are 3σ× [1,2,3,4,5,6,7,8], where 1σ = 13.2 μJy/beam. |
| In the text | |
|
Fig. 3. P1.4 GHz−M500 correlation plot of radio haloes. To account for the discrepancies between the ACT and Planck mass derivations, we use the uncorrected M500c values for the ACT clusters (Hilton et al. 2021). The solid line shows the best-fit relation, with parameters extracted from the low-redshift sample (z ∼ 0.2) presented in Cassano et al. (2013), this fit was performed using linear regression in the log-log space by adopting the BCES-bisector method. The Di Gennaro et al. (2021a) sample consists of radio haloes at z > 0.6, and the Knowles et al. (2021) sample covers 0.22 < z < 0.65. We also include El Gordo, which is at z = 0.87 (Lindner et al. 2014). |
| In the text | |
|
Fig. A.1. Top: Spectral index map of the radio halo and the corresponding error map. The overlaid black and magenta contours are from the MeerKAT UHF band and L band’s HR images, respectively. For both images, the contour levels are σ×[3,9,18,27]. 1σ is 12.4 μJy/beam for the UHF-band image and 4.9 μJy/beam for the L-band image. Bottom: Corresponding error map. |
| In the text | |
|
Fig. A.2. Histogram of the spectral index distribution for the halo in ACT-CL J0329. The blue solid line indicates the average spectral index value α = 1.34. The dashed black lines show the standard deviation around the mean, σ = 0.52. The dot-dashed red line is the integrated spectral index. |
| In the text | |
|
Fig. A.3. Spectral index map of the HT radio galaxy produced from the FR UHF- and L-band images. |
| In the text | |
|
Fig. B.1. L-band FR compact-source-subtracted image with contour overlays of the HR image. The contour levels are σ×[3,12,24,30], where 1σ is 4.9 μJy/beam. The beam of the HR image is 6.5″×5.5″, 166° pa. |
| In the text | |
|
Fig. B.2. UHF-band FR compact-source-subtracted image with contour overlays of the HR image. The contour levels are σ×[3,12,24,30], where 1σ is 12.4 μJy/beam. The beam of the HR image is 10.7″×8.1″, 146° pa. |
| In the text | |
|
Fig. B.3. MeerKAT L-band full field of view image of ACT-CL J0329. The rms noise of the image is 6.6 μJy/beam. |
| In the text | |
|
Fig. B.4. MeerKAT UHF-band full field of view image of ACT-CL J0329. The rms noise of the image is 13.2 μJy/beam. |
| In the text | |
|
Fig. B.5. Optical grz image of ACT-CL J0329 from DECaLS (Dey et al. 2019). The overlaid contours are from the MeerKAT UHF-band LR images, the contour levels are σ×[3,6,10]; where 1σ = 17.6 μJy/beam. The white source at the centre is a foreground star located at a distance of ≈1500 pc as recorded in Gaia DR3 (Gaia Collaboration 2023). |
| In the text | |
|
Fig. B.6. Chandra X-ray image and the projection used to highlight the disturbed morphology of the cluster. Upper: Exposure-corrected Chandra image of ACT-CL J0329, created from observation IDs 18282 and 18882, as in Fig. 2. The blue contours trace the X-ray surface brightness, while the dashed white box shows the regions used to extract a profile. Lower: Surface brightness profile using data extracted from the smoothed X-ray image within the dashed white box in the upper panel. While no error bars are provided, the two peaks as well as the steep drops in surface brightness are clear above the noise. |
| In the text | |
Current usage metrics show cumulative count of Article Views (full-text article views including HTML views, PDF and ePub downloads, according to the available data) and Abstracts Views on Vision4Press platform.
Data correspond to usage on the plateform after 2015. The current usage metrics is available 48-96 hours after online publication and is updated daily on week days.
Initial download of the metrics may take a while.