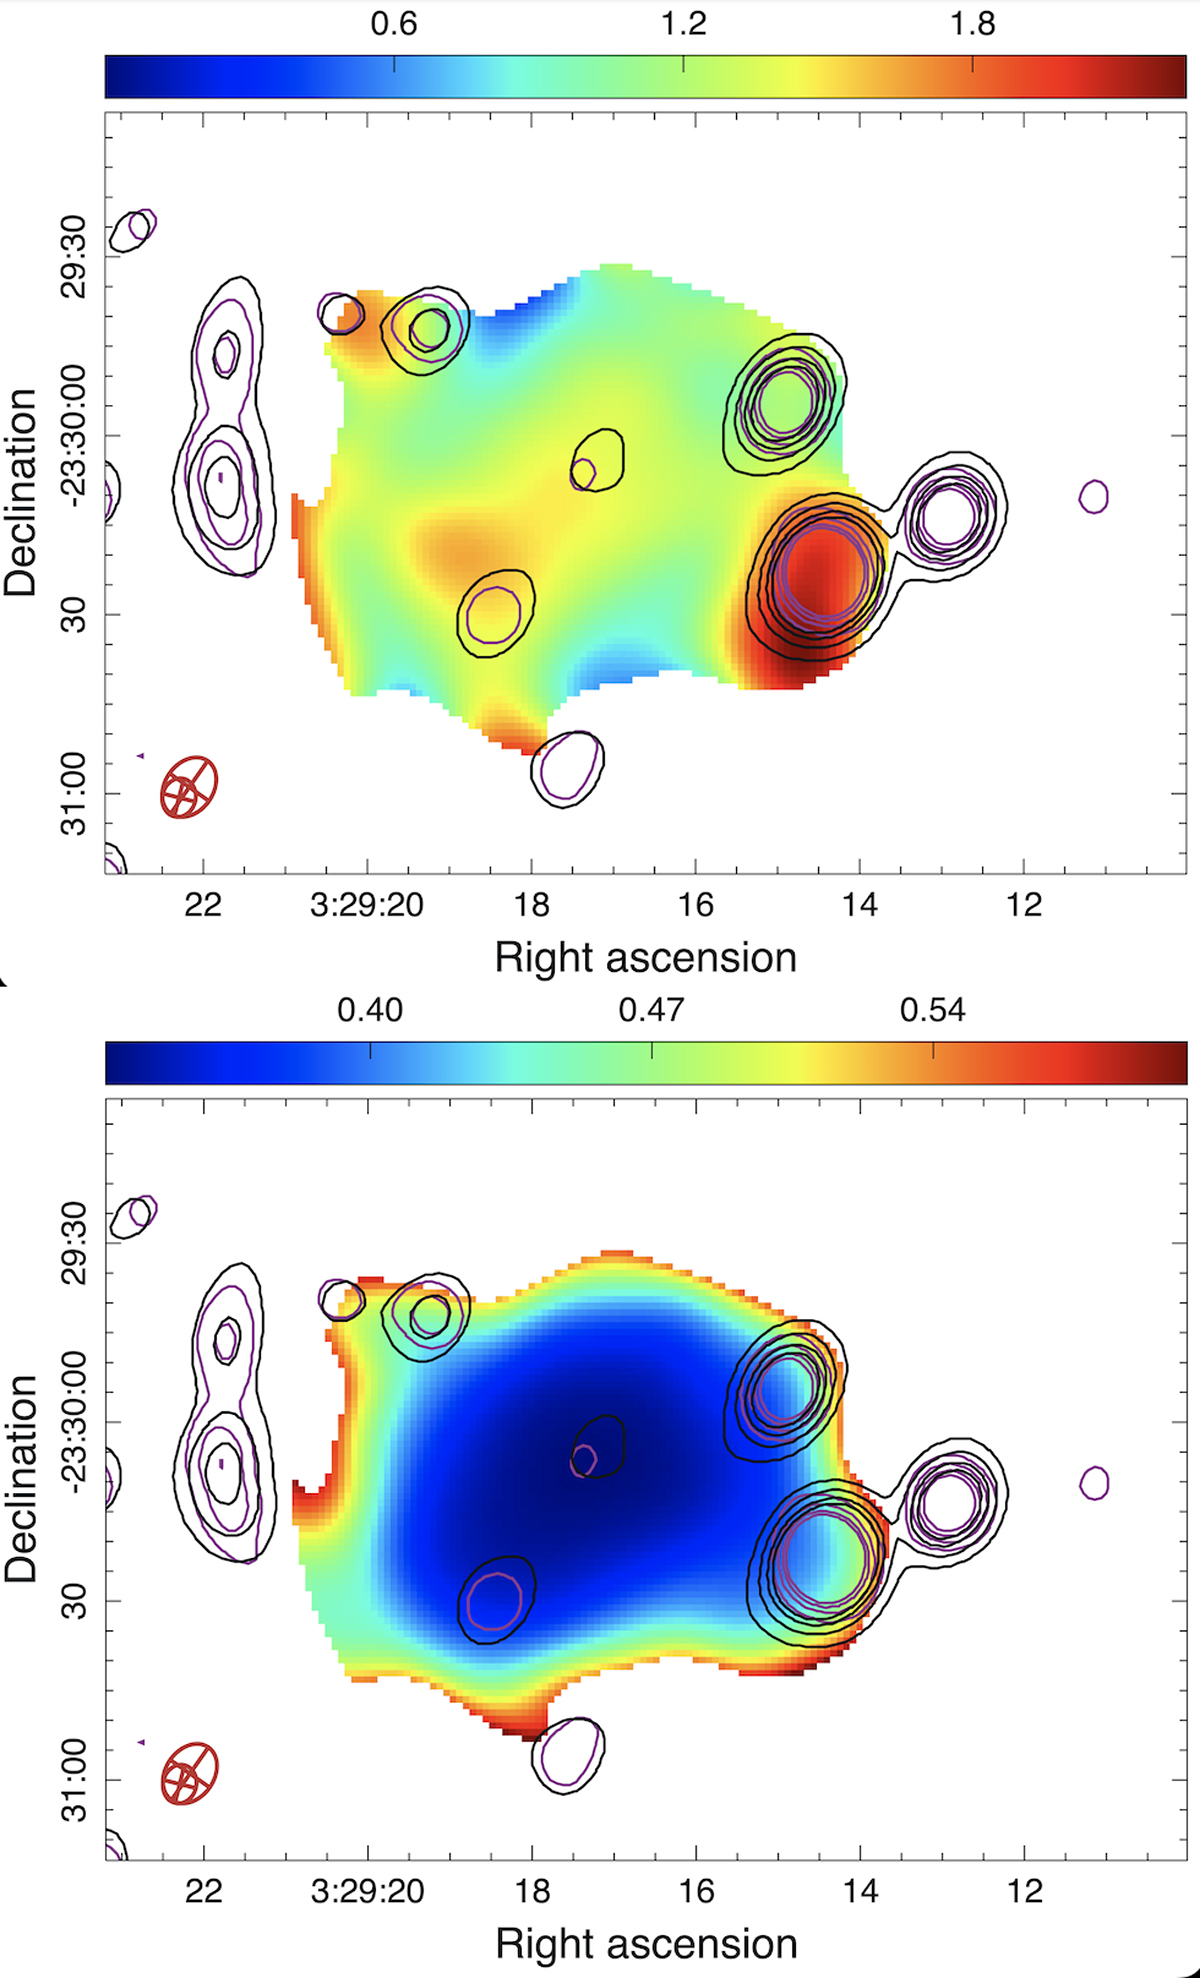
Fig. A.1.
Download original image
Top: Spectral index map of the radio halo and the corresponding error map. The overlaid black and magenta contours are from the MeerKAT UHF band and L band’s HR images, respectively. For both images, the contour levels are σ×[3,9,18,27]. 1σ is 12.4 μJy/beam for the UHF-band image and 4.9 μJy/beam for the L-band image. Bottom: Corresponding error map.
Current usage metrics show cumulative count of Article Views (full-text article views including HTML views, PDF and ePub downloads, according to the available data) and Abstracts Views on Vision4Press platform.
Data correspond to usage on the plateform after 2015. The current usage metrics is available 48-96 hours after online publication and is updated daily on week days.
Initial download of the metrics may take a while.