Fig. 3.
Download original image
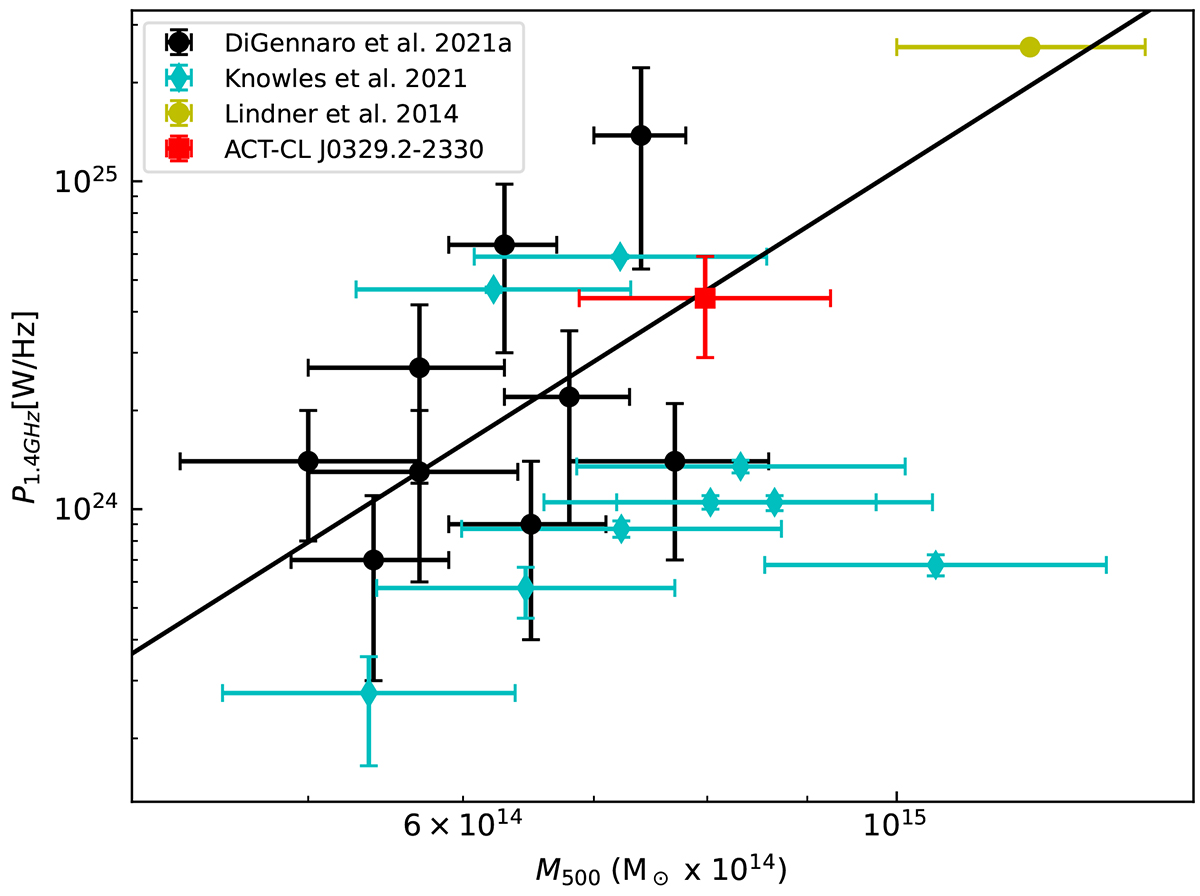
P1.4 GHz−M500 correlation plot of radio haloes. To account for the discrepancies between the ACT and Planck mass derivations, we use the uncorrected M500c values for the ACT clusters (Hilton et al. 2021). The solid line shows the best-fit relation, with parameters extracted from the low-redshift sample (z ∼ 0.2) presented in Cassano et al. (2013), this fit was performed using linear regression in the log-log space by adopting the BCES-bisector method. The Di Gennaro et al. (2021a) sample consists of radio haloes at z > 0.6, and the Knowles et al. (2021) sample covers 0.22 < z < 0.65. We also include El Gordo, which is at z = 0.87 (Lindner et al. 2014).
Current usage metrics show cumulative count of Article Views (full-text article views including HTML views, PDF and ePub downloads, according to the available data) and Abstracts Views on Vision4Press platform.
Data correspond to usage on the plateform after 2015. The current usage metrics is available 48-96 hours after online publication and is updated daily on week days.
Initial download of the metrics may take a while.