Fig. B.6.
Download original image
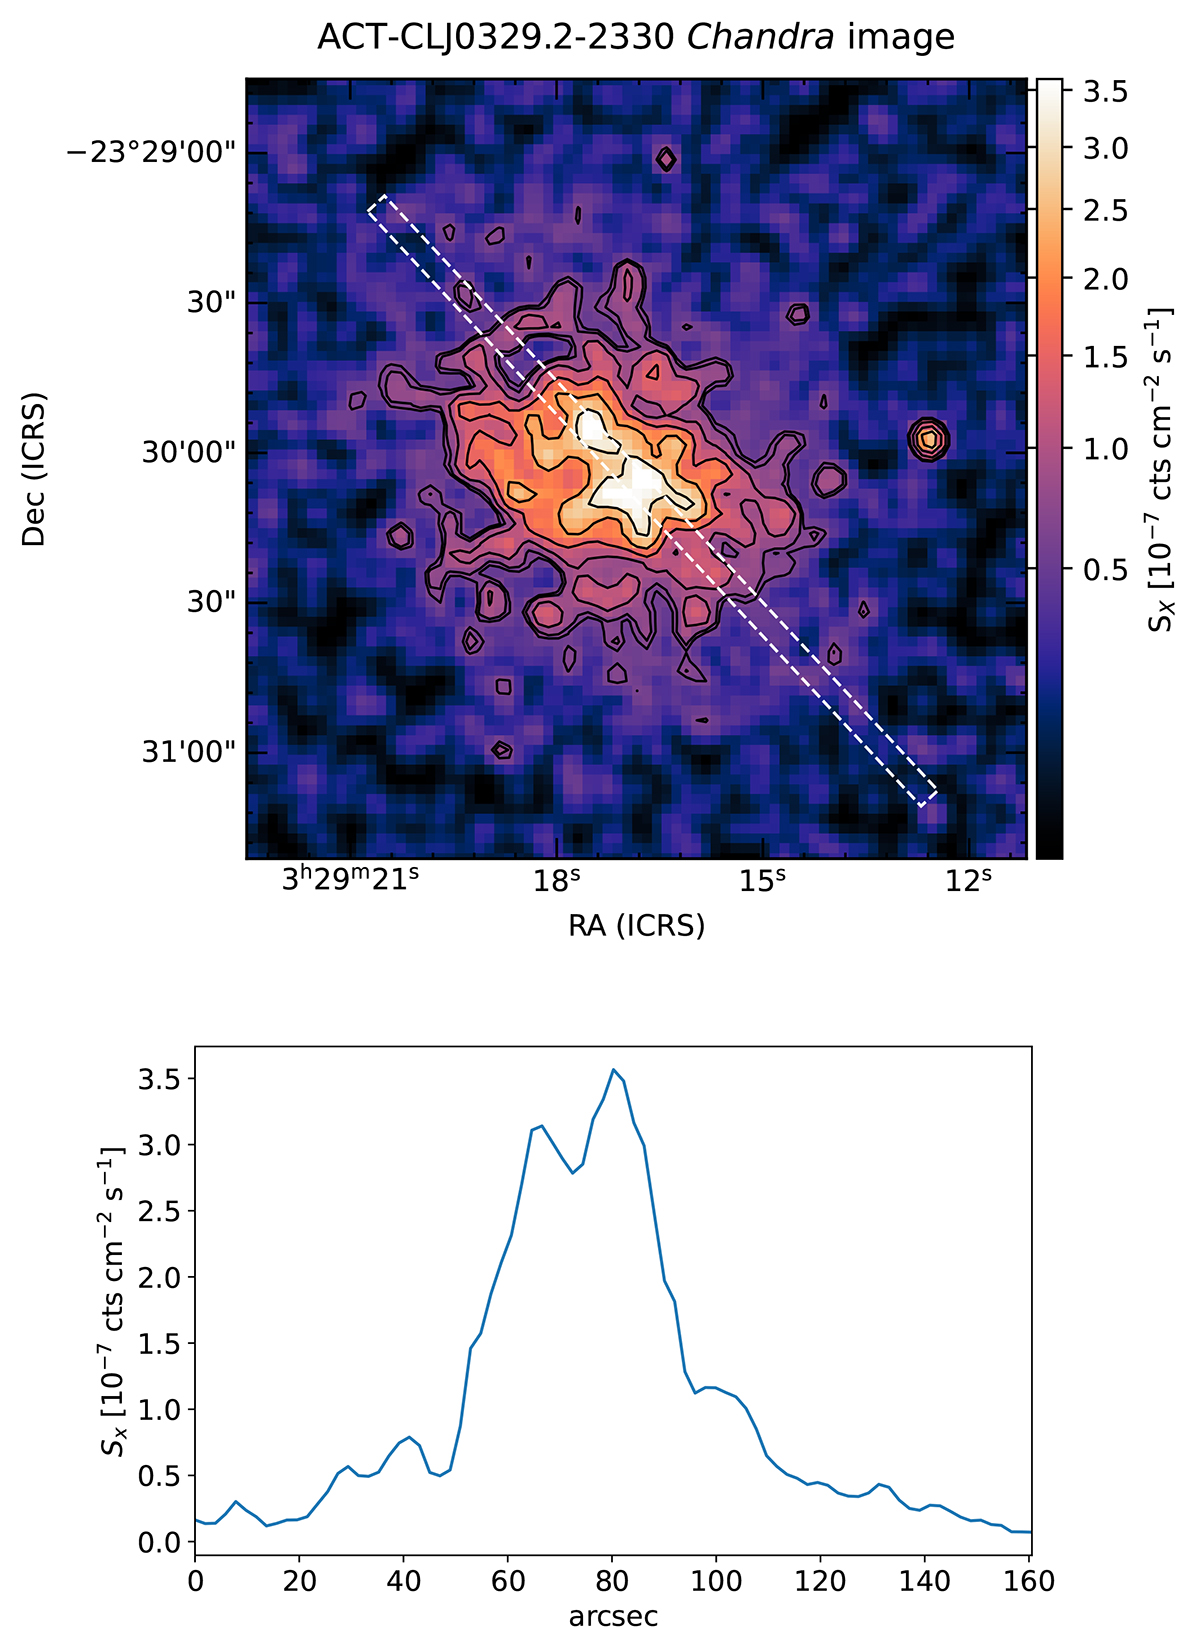
Chandra X-ray image and the projection used to highlight the disturbed morphology of the cluster. Upper: Exposure-corrected Chandra image of ACT-CL J0329, created from observation IDs 18282 and 18882, as in Fig. 2. The blue contours trace the X-ray surface brightness, while the dashed white box shows the regions used to extract a profile. Lower: Surface brightness profile using data extracted from the smoothed X-ray image within the dashed white box in the upper panel. While no error bars are provided, the two peaks as well as the steep drops in surface brightness are clear above the noise.
Current usage metrics show cumulative count of Article Views (full-text article views including HTML views, PDF and ePub downloads, according to the available data) and Abstracts Views on Vision4Press platform.
Data correspond to usage on the plateform after 2015. The current usage metrics is available 48-96 hours after online publication and is updated daily on week days.
Initial download of the metrics may take a while.