| Issue |
A&A
Volume 696, April 2025
|
|
|---|---|---|
| Article Number | A139 | |
| Number of page(s) | 10 | |
| Section | Astrophysical processes | |
| DOI | https://doi.org/10.1051/0004-6361/202453142 | |
| Published online | 09 April 2025 | |
Emission and absorption lines in the photospheric radius expansion bursts of 4U 1820–30
1
Key Laboratory of Stars and Interstellar Medium, Xiangtan University, Xiangtan, 411105 Hunan, P.R. China
2
Key Laboratory of Particle Astrophysics, Institute of High Energy Physics, Chinese Academy of Sciences, 19B Yuquan Road, Beijing, 100049
China
3
International Space Science Institute (ISSI), Hallerstrasse 6, 3012 Bern, Switzerland
4
Physikalisches Institut, University of Bern, Sidlerstrasse 5, 3012 Bern, Switzerland
⋆ Corresponding authors; This email address is being protected from spambots. You need JavaScript enabled to view it.
; This email address is being protected from spambots. You need JavaScript enabled to view it.
Received:
25
November
2024
Accepted:
10
March
2025
Abstract
We analyze the emission and absorption lines during photospheric radius expansion (PRE) X-ray bursts from the ultracompact binary 4U 1820–30, observed with the Neutron Star Interior Composition Explorer (NICER). Using Monte Carlo simulations to estimate the significance, we identified a 1 kiloelectron volt (keV) emission line from 14 bursts, a 3 keV absorption line from 12 bursts, and a 1.6 keV absorption line from one burst. By coadding the burst spectra at the maximum radius phase, we detected a 1.034 keV emission line with significance of 14.2σ, along with absorption lines at 1.64 and 3 keV, with significances of 10.8σ and 11.7σ, respectively. The observed energy shifts are consistent with the prediction from the burst-driven wind model, indicating that all three spectral features are produced by the PRE wind. An analysis of the ratios between the emission and absorption line energies suggests that the 1 keV feature is a superposition of several narrower Fe L-shell lines. To evaluate the scientific capabilities of the Hot Universe Baryon Surveyor (HUBS), we simulated mock observations of multiple narrow lines near 1 keV. These results demonstrate that HUBS is well suited for detailed studies of the 1 keV emission line during bursts, offering significant potential to advance our understanding of these phenomena.
Key words: accretion / accretion disks / line: identification / stars: neutron / X-rays: binaries / X-rays: bursts / X-rays: individuals: 4U 1820–30
© The Authors 2025
 Open Access article, published by EDP Sciences, under the terms of the Creative Commons Attribution License (https://creativecommons.org/licenses/by/4.0), which permits unrestricted use, distribution, and reproduction in any medium, provided the original work is properly cited.
This article is published in open access under the Subscribe to Open model. This email address is being protected from spambots. You need JavaScript enabled to view it. to support open access publication.
1. Introduction
The 4U 1820–30 system is a persistent, ultracompact, X-ray binary (UCXB) with an orbital period of 11.4 minutes (Stella et al. 1987). Due to its short orbital period, the donor star is likely a white dwarf with a mass of ∼0.06 − 0.07 M⊙ (Paczynski & Sienkiewicz 1981; Nelson et al. 1986; Rappaport et al. 1987). In this system, a neutron star (NS) accretes helium-rich material from its companion, potentially triggering unstable thermonuclear burning, resulting in type I X-ray bursts (or simply X-ray burst; Lewin et al. 1993; Strohmayer & Bildsten 2006; Falanga et al. 2008; Galloway et al. 2008; Galloway & Keek 2021). These bursts typically release a total energy of ∼1039 erg over 10–100 s. Occasionally, bursts can exceed the Eddington limit, causing the NS surface layers to lift, resulting in photospheric radius expansion (PRE; Lewin et al. 1993). In rare cases, the photosphere radius can expand by a factor of > 100, described as a “superexpansion” burst (in’t Zand & Weinberg 2010; Yu et al. 2024).
A strong PRE burst can drive the matter outflow from the NS surface, such as generating a super-Eddington wind (Paczynski & Proszynski 1986; Yu & Weinberg 2018; Guichandut et al. 2021). There is some evidence suggesting that the wind is polluted with heavy nuclear burning ashes (in’t Zand & Weinberg 2010; Yu & Weinberg 2018; Guichandut et al. 2021), as type I X-ray bursts are known sites for the production of heavy element via the rp-process (Schatz et al. 2003). Convection at the onset of the burst can mix heavy elements from the deeper burning layers, which are then ejected by the wind and exposed at the photosphere (Weinberg et al. 2006; Yu & Weinberg 2018). In superexpansion bursts, the column density of ejected ashes is expected to be particularly high due to the energetic nature of these events. As a result, the heavy element ashes could be observed as spectral lines or absorption edges (in’t Zand & Weinberg 2010). For example, in two superexpansion bursts from 4U 0614+091 and 4U 1722–30 detected by RXTE, in’t Zand & Weinberg (2010) reported spectral edges in the range of 6–11 kiloelectron volts (keV). These edge energies can be associated with a redshifted hydrogen or helium-like Ni edge, suggesting the presence of heavy-element ashes in the wind. Li et al. (2018) identified an absorption edge in a PRE burst from GRS 1747–312 during RXTE observations. The edge energy, remaining at ≈8 keV during the cooling tail, was attributed to photoionization absorption edges of hydrogen-like nickel, redshifted to match the observed energy. Based on this finding, they estimated the NS mass, radius, and surface gravitational redshift factor.
In 2017, Keek et al. (2018) reported a strong PRE burst in 4U 1820–30 from NICER observations. In addition to a blackbody component, an extra optically thick Comptonization model has to be added to fit the time-resolved burst spectra. Four of these bursts exhibited significant spectral features, including an emission line at 1 keV and absorption features at 1.7 keV and 3 keV (Strohmayer et al. 2019). They identified a relative spectral shift of approximately 1.046 in bursts with a photospheric radius of around 75 km, attributed to the combined effects of gravitational redshift and Doppler blueshift in a burst-driven wind. However, from the calculations in Guichandut et al. (2021), only a static envelope can be produced for such a small photospheric radius and the wind-induced blueshift is negligible. More recently, Yu et al. (2024) analyzed 15 type I X-ray bursts from 4U 1820–30 using NICER (see also Jaisawal et al. 2024). The time-resolved burst spectra revealed that all these bursts were PRE with photospheric radii ranging from 55 to 103 km. Additionally, they provided direct evidence that the accretion disk was distorted by the burst radiation by fitting the burst spectra with a reflection model.
In this work, extending the analysis by Strohmayer et al. (2019) and Yu et al. (2024), we focus on the spectral lines of 15 X-ray bursts from 4U 1820–30 observed by NICER. This work is organized as follows. In Sect. 2, we describe how we performed the spectral line fitting during the X-ray bursts. We discuss and summarize the results in Sects. 3 and 4, respectively.
2. Observations and data reduction
NICER observed 4U 1820–30 from 2017 to present for a total exposure time of 812 ks, in which 15 type I X-ray bursts were detected with a short duration and a high peak count rate. We processed all archived NICER data by applying the standard filtering criteria using HEASOFT V6.33.2 and the NICER Data Analysis Software (NICERDAS) V2.0.7. The 0.1 s binned light curves were extracted using nicerl3-lc from the calibrated unfiltered (UFA) files and cleaned events files, see Fig. 1. We extracted the spectra, ancillary response files (ARFs), response matrix files (RMFs), and the 3c50 background spectra (Remillard et al. 2022) using nicerl3-spect. We performed the spectra analysis using Xspec v12.14.1 (Arnaud 1996). The errors of all parameters are quoted at the 1σ confidence level.
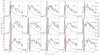 |
Fig. 1. 0.1 s binned light curves of 15 X-ray bursts from 4U 1820–30 observed by NICER in 0.5–10 keV are marked as red lines. The right axis shows the 3–10 keV light curves as black lines. The persistent emissions are regarded as background and subtracted. The gray shaded region mark the intervals used to extract PRE phase spectra. |
All time-resolved burst spectra can be fitted well by using the enhanced persistent emission model (fa model), adding a reflection component from the surrounding accretion disk (disk reflection model), or using the double-blackbody model, as reported by Yu et al. (2024). All bursts showed the characteristics of PRE. However, the fa model failed to provide a physically motivated and self-consistent explanation for the observations. This study focuses on the spectral features of X-ray bursts from 4U 1820–30, as detected by NICER. Due to its phenomenological simplicity, the double-blackbody model was adopted to describe the continuum spectra for subsequent analysis. For more details on continuum fitting, we refer to Yu et al. (2024).
2.1. Single burst spectra
Strohmayer et al. (2019) found that the spectral lines appeared only during the PRE phase. No spectral lines were present in the pre-burst persistent spectra and the initial and cooling phases of the bursts (Yu et al. 2024). Therefore, we extracted spectra during the PRE phase for each burst based on the time-resolved spectroscopy. The spectra were extracted with the exposure time varying from 0.3 to 2 s. The gray area in Fig. 1 marks the intervals used to extract PRE phase spectra. The burst spectra were grouped using grappha with a minimum count of 20 and regarded the persistent spectra as background and unchanged during bursts. The PRE spectra of most burst were dominated by the persistent emission above 5 keV, see the burst light curve in 5–10 keV after subtracting the persistent count rate in Fig. 1. To focus on searching for spectral features, we fitted each spectrum in 0.5–5 keV with the double-blackbody model, namely, TBabs × (bbodyrad + bbodyrad). The absorption column density was fixed as the best fitting value from the persistent spectra, NH = 1.93 × 1021 cm−2.
The double-blackbody model provides a reasonable qualitative fit to the continuum spectra, but there are substantial spectral features evident in the residual. For each X-ray burst, we selected a spectrum with significant emission and absorption lines to analyze the spectral lines of the burst. In Fig. 2, as an example, we show the PRE phase spectrum extracted from burst # 9, which has χ2 = 315.82 for 230 degrees of freedom (dofs) fitted by the double-blackbody model. The residuals showed apparent line features near 1.0 and 1.6 keV, and a possible 3 keV absorption line guided by Strohmayer et al. (2019). Adding one Gaussian (gauss) and two absorption components (gabs) to describe these features; namely, the overall model is Tbabs × (bbodyrad+gaussion+bbodyrad) × gabs × gabs, which can obviously improve the fitting result. The χ2 is 256.51 for 224 d.o.f.s. The best-fit centroid energies and line width are E1 = 1.028 ± 0.024 keV and width ∼0.05 keV, E2 = 1.625 ± 0.021 keV and width ∼0.02 keV, and E3 = 2.894 ± 0.055 keV and width ∼0.04, respectively.
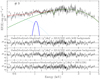 |
Fig. 2. PRE phase spectra and residuals for burst # 9. Top panel: PRE phase spectra from the burst # 9. The best-fit model, Tbabs × (bbodyrad+gaussion+bbodyrad) × gabs × gabs, is represented by the solid red line. The 1 keV emission line are clearly shown in the spectra and a pair of absorption lines are indicated near 1.6 and 3 keV. The two middle panels are the residuals of the spectra fitted with 3c50 and SCORPEON backgrounds, respectively. The bottom panel shows the residuals of the best-fit model to the spectra. |
To confirm the robustness of spectral features against background modeling uncertainties, we reprocessed the data using nicerl3-spec with the SCORPEON background model1. Using burst # 9 as an example, we compared the spectral lines from different background models. The best-fit parameters of the 1 keV emission and 3 keV absorption lines were consistent within 1σ confidence level compared with the 3c50 background model (see Fig. 2).
2.2. Spectra line significance assessment
The significance of spectral lines was not reliably determined using goodness-of-fit or F-test methods, particularly for the emission and absorption lines (Protassov et al. 2002; Wang et al. 2022). The F-test tends to overestimate the significance of these features (Protassov et al. 2002; Lanzuisi et al. 2024). Therefore, we employed the Monte Carlo (MC) method to evaluate the significance of potential spectral lines (Porquet et al. 2004; Tombesi et al. 2010; Gofford et al. 2013). This approach has proven robust and has become the standard practice in the past decade (Li et al. 2022; Xu & Wang 2022; Parra et al. 2024; Zhang et al. 2024)
To illustrate the MC method, we used burst # 9 as an example and analyzed three spectral features independently. The null hypothesis model was defined as the best-fit model for the burst spectrum without any spectral lines, described by TBabs × (bbodyrad + bbodyrad). The observed spectrum was fitted using the null hypothesis model, and we obtained a baseline C-stat value Cnull using C-statistics. Subsequently, we added a spectral line to the model, yielding an improved fit and a new C-stat value Cline. The likelihood ratio, represented by the difference ΔC = Cnull − Cline was then calculated to evaluate the statistical significance of the spectral feature (Cash 1979; Zhang et al. 2024),
 (1)
(1)
where Lnull and Lline represent the likelihoods for the null hypothesis model and the model with an additional line component, respectively. The ΔCtrue for three spectral features are calculated as, ΔCtrue, E1 = 33.93, ΔCtrue, E2 = 27.01, and ΔCtrue, E3 = 6.20, respectively. To assess these features, we generate 105 distributions of best-fitted parameters within the uncertainties using simpars command in Xspace. Each set of model parameters was loaded from the generated distribution, and a spectrum was simulated using the fakeit command in Xspec, preserving all observational parameters (exposure, response files, background) of the initial spectrum. The simulated spectra were first fitted with the double-blackbody model to obtain the baseline Cnull values. Then, an emission or absorption line component was added to the model and the spectra were re-fitted to obtain Cline. The resulting ΔCsim values were recorded for each simulated spectrum, forming a distribution for statistical analysis. This method provides a robust estimate of the significance of the spectral features.
For the 105 simulations, the distributions of ΔCsim were fitted to a χ2-distribution, and the p-values were inferred based on these fits. Figure 3 illustrates the distributions and fitting results for the three spectral features of burst # 9. The results show that the simulated distribution is consistent with the χ2-distribution with two dofs. The two dofs of χ2 are derived from the two free parameters of gaussian or absorption given the fixed line width. The derived significances are, σE1 = 5.5σ, σE2 = 4.8σ, and σE3 = 2.0σ.
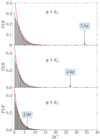 |
Fig. 3. Distributions of the ΔC of 105 simulations for the lines of burst # 9. The distributions fitted by χ2-distribution with two dofs (red dashed-dotted lines). From top to bottom panel, the arrow marks the significance for the 1 keV emission line, 1.6 and 3.0 keV absorption lines, respectively. |
The MC method was subsequently applied to all spectra to assess the significance of detected lines. Only spectral lines with a significance greater than 2σ (95%) were considered detections and included in the further analyses (see Table 1). For burst # 2, no spectral lines were detected, consistent with the findings of Strohmayer et al. (2019). In total, we identified the 1 keV emission line in 14 bursts, the 3 keV absorption line in 12 bursts, and the 1.6 keV absorption line in one burst (# 9). The spectra and the best-fitted model are shown in Fig. 4. Table 1 summarizes the results of best-fit parameters of the emission and absorption lines. The strongest identified feature is the 1 keV emission line from burst # 8 with a significance of 10.8σ. All spectral features exhibit narrow line widths of approximately 0.02–0.08 keV; thus, the line width was fixed during fitting.
Gaussian line parameters.
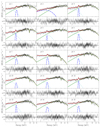 |
Fig. 4. Unabsorbed spectra extracted during the PRE phase for all bursts in 0.3–5 keV. The solid red lines indicate the best-fitting model, including the continuum and spectral lines if necessary. The residuals of the best fit model to the data are plotted in bottom panels. |
2.3. Coadded spectra
Guichandut et al. (2021) presented the hydrodynamic simulation of super Eddington winds. Their interpretation states that the observed energy will close to the line energy at the rest frame where the photospheric layer expands to a large radius (more than 200 km). In our case, as reported by Yu et al. (2024), we found that the maximum radii of 14 bursts exceeded 100 km. However, the photospheric expends so fast during the PRE phase that we cannot obtain a significant line around the maximum radius in one burst. To address this, we stacked all burst spectra for a 0.1 s interval at the maximum radius, excluding burst # 2, to enhance the signal-to-noise ratio (S/N). A double-blackbody model was applied to fit the coadded spectra. Figure 5 shows the stacked spectrum from the strong photospheric expansion phase, with the red curve representing the best-fitting model. We found that the hotter blackbody component with a temperature kTbb1 = 0.58 ± 0.01 keV and a radius of Rbb1 = 117 ± 26 km, while the cooler blackbody component has a temperature of kTbb2 = 0.17 ± 0.01 keV and a blackbody radius of Rbb2 = 1146 ± 335 km.
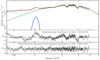 |
Fig. 5. Coadded spectroscopy of all bursts (except burst # 2) at the maximum photospheric radius. The solid red line is the best-fitting model including the continuum and the emission line, E1, the absorption lines, E2 and E3, and the absorption lines at 2.2 keV (due to the reflectivity of gold M shell of the detector itself). The middle panel shows the residuals of the fitting of the model without lines. The residuals of the best fit model to the data are plotted in the bottom panel. |
As shown in Fig. 5, an excess near 1 keV indicates a clear emission line, while strong evidence of an absorption line near 3 keV is also observed. Additionally, a deviation near 1.6 keV suggests the need for a broad absorption line component. Significant residuals near 2.2 keV correspond to an absorption edge (2.0–2.4 keV) due to the gold M-shell reflectivity of the detector. The overall model includes four line components, achieving a fit with χ2 = 288 for 258 dofs. For the emission line, the best-fit parameters are a centroid energy of E1 = 1.035 ± 0.011 keV, a width of 0.05 ± 0.01 keV, and a normalization of 0.32 ± 0.04 photons cm−2 s−1. For the broad absorption line, the parameters are E2 = 1.64 ± 0.01 keV, a width of 0.17 ± 0.03 keV, and a normalization of 0.06 ± 0.01 photons cm−2 s−1. The second absorption line at E3 = 2.93 ± 0.01 keV has a width of 0.07 ± 0.02 keV and a normalization of 0.065 ± 0.011 photons cm−2 s−1. In Fig. 6, we show the distributions and fitting result of the three spectral lines of the coadded spectrum. We found the significances of the emission line, σE1 = 14.2σ, and the absorption lines, σE2 = 10.8σ and σE3 = 11.7σ, respectively.
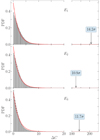 |
Fig. 6. Distributions of the ΔC for 105 simulations for the coadded spectra lines. From top to bottom: Distributions of the simulations for 1 keV emission line (E1), 1.6 keV absorption line (E2), and 3 keV absorption line (E3). The distributions fitted by χ2-distribution with two dofs (red solid lines). The arrow marks the measured ΔC from the true data. |
From the time-resolved spectroscopy reported in Yu et al. (2024), a moderate expansion phase follows the strong expansion phase, with radii that are closely matched. We extracted spectra from the moderate expansion phase for a 0.2 s interval, we coadded these spectra and fitted the same continuum model as for the PRE phases. Additionally, spectra near the touchdown moment were also coadded and analyzed. Residuals from the fits for the moderate expansion phase (in black, middle panel) and the touchdown phase (in blue, bottom panel) are shown in Fig. 7. No line features were detected in the touchdown spectra, but a narrow emission line at E1 ∼ 1.024 keV was identified in the moderate expansion phase (Rbb = 47 ± 15 km), with a significance of 5.0σ and an improvement in χ2 of 30.
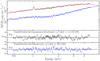 |
Fig. 7. Coadded spectroscopy of all burst at the moderate expansion phase (black) and the touchdown moment (blue). The touchdown spectra show no evidence of line features and the moderate expansion phase shows a narrow 1 keV emission line. |
3. Discussion
In this work, we have analyzed the spectra of NICER observations between 2017 to present from 4U 1820–30, in which presented strong evidence to support the existence of narrow spectral lines during the PRE phases. By using the Monte Carlo simulations from Protassov et al. (2002) to estimate the significance, we identified the 1 keV line from 14 bursts and the 3 keV line from 12 burst (see Table 1). We coadded the spectra of the maximum radius phase and identified three spectral lines in the coadded spectra, namely: the emission line at 1.034 keV and the absorption lines at 1.56 and 2.929 keV, respectively. The most prominent of spectral features is the emission line and the significance of coadded spectrum around 9.4σ. We can infer the possible origin and physically motivated based on the fit results.
3.1. Plausible origin from the accretion disk
Spectral lines have recently been observed in several NS LMXBs, particularly during X-ray bursts. In a series of X-ray bursts, a broad Fe-Kα emission line was detected with RXTE and attributed to reflection from the accretion disk (Keek et al. 2014; in’t Zand & Weinberg 2010; Degenaar et al. 2018; Salvo et al. 2022). A strong 1 keV emission lines was observed in SAX J1808.4–3658 (in’t Zand et al. 2013; Bult et al. 2019), IGR J17062–6143 (Degenaar et al. 2013; Keek et al. 2017; Bult et al. 2021), and 4U 1850–087 (Lu et al. 2024). These authors also interpreted the lines as having been caused by the reflection of Fe-Kα from accretion disk.
4U 1820–30 also exhibited clear evidence of spectral line originating from the accretion disk. A prominent absorption line from 4U 1820–30 was observed by NICER after a superburst, with the line exhibiting a shifting from 4.16 to 3.60 keV during the recovery phase of persistent emission. This absorption feature was likely produced by the hydrogen-like Ar Kα transition, originating from the inner accretion disk (Peng et al. 2025).
The interpretation of the reflection’s origin presents several challenges. First, no emission or absorption lines were observed during burst # 2 (as shown in Fig. 4), despite the high reflection intensity reported during this burst (Yu et al. 2024). Notably, the fraction of bolometric flux from disk reflection in this burst is consistent with those bursts where spectral lines were observed. Additionally, all spectral lines were detected exclusively during the strong PRE phase, which is significantly shorter than the duration of reflection. A second issue involves the significant and systematic spectral shifts in line energies associated with different PRE strengths. Strohmayer et al. (2019) found that the lines in stronger PRE bursts were systematically blueshifted by a factor of 1.046, compared to those observed in weaker bursts. Similarly, from the coadded spectra, we observed the 1 keV line in the maximum radius phase (E1 = 1.039 keV at Rbb ∼ 120 km) exhibiting weaker redshifts than in the moderate expansion phase (E1 = 1.024 keV at Rbb ∼ 50 km). Therefore, we conclude that the lines originating from the accretion disk might not fully account for the spectral features observed in our data.
3.2. Originating from the PRE winds
Substantial efforts have been made by numerous research groups over the past decades to search for a spectral feature in NS surface. Cottam et al. (2002) reported the spectral lines from EXO 0748–676 during its X-ray bursts; however, the detection was quite controversial (see e.g., Galloway & Keek 2021; Ascenzi et al. 2024). Bult et al. (2021) also detected a highly significant absorption line at 3.4 keV in a burst tail from IGR J17062–6143 observed with NICER. They claimed this line was the burning ashes on the stellar surface, such as Ca and Ti.
In UCXB 4U 1820-30, we detected a highly significant absorption line at 3 keV from 12 bursts and a narrow absorption feature at 1.6 keV in one burst. These features are plausibly associated with heavy elements in the burning ashes produced during the bursts. Possible interpretations of the 3 and 1.6 keV absorption lines include the He-like lines of S XV (2.8839, 3.0325, and 3.1013 keV; Van Hoof 2018), as well as transitions of Fe (XXIII, XXIV, and XXV), Mg XI, or Cr XXIV of ∼1.6 keV, respectively (Strohmayer et al. 2019). In contrast to the transient PRE-phase lines, Marino et al. (2023) found persistent features likely originate in the accretion disk, as evidenced by their stability and energy range.
The emission lines detected in 4U 1820–30 could also originate from burning ashes in the photosphere. Two potential explanations include the Lyα transition of Ne X at 1.022 keV (Angelini et al. 1995; Keek et al. 2017; Bult et al. 2021) and Fe L-shell transitions, which are produced by irradiation of relatively cool gas (Butler & Badnell 2008; Degenaar et al. 2013; Šmıd et al. 2024). Since 4U 1820–30 accretes helium-rich material (Stella et al. 1987; Rappaport et al. 1987; Costantini et al. 2012), the detection of abundant Ne is plausible, since neon is a byproduct of helium burning (Angelini et al. 1995). Additionally, observations of Fe L-shell lines would be consistent with XMM-Newton findings from Costantini et al. (2012), which reported Fe L absorption features in this system.
To summarize, it is reasonable to suggest that all detected lines originate within the photosphere. Strong PRE bursts likely drive super-Eddington winds, as hydrodynamic simulations indicate that heavy elements can be ejected into the wind, imprinting spectral lines and edges on the burst spectra (Yu & Weinberg 2018). During the expansion phase, the photospheric radius can exceed 100 km, matching the wind solution of Guichandut et al. (2021). In our observations, the maximum radius during the PRE bursts exceeds this solution (see Fig. 8). In these burst-driven winds, line energies are influenced by gravitational redshift and Doppler blueshift (Strohmayer et al. 2019). Stronger PRE bursts, reaching larger radii, generate faster outflows and higher blueshifts, with observed blueshifts systematically around 1.046.
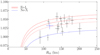 |
Fig. 8. 1 keV emission lines of 13 bursts with the blackbody radius. The Lyα transition of Ne X in the rest frame at 1.022 keV is plotted with blue dot line. The Fe L shell transitions at 1.045, 1.055 and 1.066 keV are plotted with red dot line, see e.g., Guichandut et al. (2021). |
However, Guichandut et al. (2021) found that in steady-state radiation-driven winds within a steady-state model of radiation-driven winds, the wind velocity stabilizes at vmax ∼ 0.01c. This results in shifts at the photosphere that are predominantly governed by gravitational redshift, with combined effects leading to shifts of less than ΔE/E ≈ 0.02. Observed energies slightly deviate from the rest frame under such conditions. For example, we detected emission lines at 1.03 keV, corresponding to 1.05 keV in the rest frame. If these emission lines have a consistent origin across different bursts, they are more likely to be Fe L-shell transitions with minimal gravitational redshift (see Fig. 8). Most NICER bursts align with the predicted combined shifts for Fe L-shell transitions.
3.3. The ratio of E3/E1
A 1 keV emission line was also observed in the persistent emission of IGR J17062–6143. The high-resolution spectroscopy results led to the interpretation that that this feature was a superposition of several more narrow lines (Degenaar et al. 2017; Van Hoof 2018). Bult et al. (2021) speculated that the line measured in burst is also a superposition of several more narrow lines.
Assuming that the spectral lines E1 and E3 were both produced by the PRE wind at the same location, the absorption and emission lines in a single spectrum would experience identical gravitational redshift and Doppler blueshift. Consequently, the observed line ratio E3/E1 would match the ratio measured in the rest frame. Using the measured values of E1 and E3 (see Table 1), we generated Gaussian distributions for each line based on their centroid energy and width. Monte Carlo simulations were then employed to calculate the line ratio and its uncertainty. Figure 9 shows the resulting line ratio (E3/E1) distributions, which are well-fitted by two Gaussian functions with μ1 = 2.819 and σ1 = 0.057 for the main peak, and μ2 = 2.972 and σ2 = 0.096 for the second peak. If E3 represents a single line, this suggests that the emission line (E1) is a superposition of several narrower lines rather than a single broad feature. Based on the mean values of the two peaks, we infer an energy ratio of approximately 1.05 for two narrow lines around 1 keV.
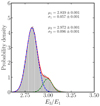 |
Fig. 9. Ratios of the centroid energy between E3 and E1 at the same time. The distributions are well fitted by two Gaussian function. The main peak at 2.819, and secondary at 2.972. |
3.4. The future prospective
At present, the direct and precious identification of spectral features is challenging due to the moderate energy resolution of NICER detectors. Previous attempts to detect spectral features during X-ray bursts using XMM-Newton and Chandra, such as in EXO 0748–676 and Rapid Burster (in’t Zand et al. 2017; Cottam et al. 2008), involved stacking numerous burst spectra. However, no spectral lines were detected in those attempts. This lack of detection might be due to energy shifts of spectral lines during bursts or broadening effects caused by the rapid rotation of NSs. Several upcoming missions with high energy resolution and large collection areas, such as the Hot Universe Baryon Surveyor (HUBS) and the Advanced Telescope for High Energy Astrophysics (NewAthena; Antonelli et al. 2024; Cruise et al. 2025), aim to overcome these limitations with high energy resolution and large collection areas. In particular, HUBS features an X-ray spectrometer capable of achieving eV-level precision in the 0.1–2.0 keV band (Cui et al. 2020; Zhang et al. 2022; Zhao et al. 2025). It also offers a large field of view and an effective area exceeding > 500 cm2 at 1 keV (Cui et al. 2020). These capabilities make HUBS highly optimized for detecting emission or absorption lines.
4U 1820–30 is an excellent target for HUBS observations, given its relatively low Galactic column density and energetic X-ray bursts in the soft X-ray band. To evaluate HUBS’s ability to resolve narrow lines near 1 keV, we generated a mock spectrum using the fitted parameters of burst #8 and the current ARF and RMF of HUBS. Using the XSPEC tool fakeit, we simulated spectra with a one-second exposure time, incorporating two emission lines at 1.005 and 1.06 keV (both with width of 0.01 keV). The spectra were grouped with minimum counts of 20. The simulated spectrum clearly resolved the two spectral features, which were successfully fitted using a two-Gaussian model. The fitted line energies were Ea = 1.005 ± 0.002 keV and Eb = 1.061 ± 0.002 keV, see Figure 10. The MC simulations estimated significances of approximately ∼10.4σ for Ea and ∼12.3σ for Eb (see Fig. 11). By combining these measured energy shifts with the effects of rotational broadening, the NS mass and radius can be accurately determined using a model-independent approach. This will provide crucial constraints on the equation of state for compact objects, offering valuable insights into their fundamental properties (see e.g., Chang et al. 2006; Jonker et al. 2008; Li et al. 2018).
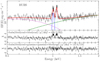 |
Fig. 10. Mock HUBS X-ray spectrum with the continuum parameters from burst #8 and two additional narrow emission lines. The best fitting model is Tbabs × (bbodyrad+gaussian+gaussian+bbodyrad). The dashed lines represent the two Gaussian lines. The best-fit model is plotted as red solid line. The burst blackbody and disk blackbody components are shown in pink and green dotted lines, respectively. |
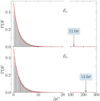 |
Fig. 11. Distributions of the ΔC for 105 simulations for the lines of the mock HUBS spectra. From top to bottom: Distributions of the simulations for 1.005 (Ea) and 1.06 keV (Eb) emission lines. The distributions fitted by χ2-distribution with two dofs (red dashed-dotted lines). The arrow marks the measured ΔC from the true data. |
When the current work was in progress, Barra et al. (2025) was also analyzing the spectral lines in 12 type I X-ray bursts from the same NICER observations. Compared with their work, our data set include three more X-ray bursts from the UFA event files (see Table A.1). Barra et al. (2025) applied different models to the burst continuum spectra and also identified these three lines. Moreover, Barra et al. (2025) obtained other emission residuals at 2 keV (Si XIV) and 2.6 keV (S XVI) using state-of-art plasma codes available within SPEX with a phenomenological continuum. Generally, our results are broadly consistent with Barra et al. (2025).
4. Conclusions
In this study, we carried out a comprehensive spectral analysis of 4U 1820–30 using NICER observations, focusing on the search for emission and absorption lines in 15 PRE bursts. We identified a 1 keV emission line from 14 bursts, a 1.6 keV absorption line from one burst, and a 3 keV absorption line from 12 bursts. The main results are generally consistent with those derived from the first five bursts presented by Strohmayer et al. (2019). However, our findings indicate a lower confidence level for the 1.6 keV absorption line. These lines were detected in coadded spectra, revealing a significant and systematic shift in their energies between bursts with varying PRE radii. These shifts are consistent with predictions from burst-driven wind models, suggesting that the spectral lines originate from heavy elements in the PRE winds. Based on the predicted line energies in winds, we attribute the 1 keV emission line to Fe L-shell transitions. Furthermore, our analysis indicates that the 1 keV line is a superposition of several narrow lines rather than a single broad feature. Simulated mock observations with a one-second exposure time demonstrate that HUBS data can effectively resolve the 1 keV emission lines during bursts, offering new opportunities for precise spectral studies.
Acknowledgments
We appreciate the referee for the valuable comments and suggestions, which improves the manuscript. This work was supported by the Major Science and Technology Program of Xinjiang Uygur Autonomous Region (No. 2022A03013-3). Z.S.L. and Y.Y.P. were supported by National Natural Science Foundation of China (12103042, 12273030, 12122302, 12173103, U1938107). This work made use of data from the High Energy Astrophysics Science Archive Research Center (HEASARC), provided by NASA’s Goddard Space Flight Center.
References
- Angelini, L., White, N. E., Nagase, F., et al. 1995, ApJ, 449, L41 [NASA ADS] [CrossRef] [Google Scholar]
- Antonelli, V., Pietschner, D., Strecker, R., et al. 2024, in Space Telescopes and Instrumentation 2024: Ultraviolet to Gamma Ray, eds. J. W. A. den Herder, S. Nikzad, & K. Nakazawa, SPIE Conf. Ser., 13093, 130934L [Google Scholar]
- Arnaud, K. A. 1996, in Astronomical Data Analysis Software and Systems V, eds. G. H. Jacoby, & J. Barnes, ASP Conf. Ser., 101, 17 [NASA ADS] [Google Scholar]
- Ascenzi, S., Graber, V., & Rea, N. 2024, Astropart. Phys., 158, 102935 [NASA ADS] [CrossRef] [Google Scholar]
- Barra, F., Barret, D., Pinto, C., et al. 2025, A&A, 694, A266 [NASA ADS] [CrossRef] [EDP Sciences] [Google Scholar]
- Bult, P., Jaisawal, G. K., Güver, T., et al. 2019, ApJ, 885, L1 [CrossRef] [Google Scholar]
- Bult, P., Altamirano, D., Arzoumanian, Z., et al. 2021, ApJ, 920, 59 [NASA ADS] [CrossRef] [Google Scholar]
- Butler, K., & Badnell, N. R. 2008, A&A, 489, 1369 [NASA ADS] [CrossRef] [EDP Sciences] [Google Scholar]
- Cash, W. 1979, ApJ, 228, 939 [Google Scholar]
- Chang, P., Morsink, S., Bildsten, L., & Wasserman, I. 2006, ApJ, 636, L117 [NASA ADS] [CrossRef] [Google Scholar]
- Costantini, E., Pinto, C., Kaastra, J. S., et al. 2012, A&A, 539, A32 [NASA ADS] [CrossRef] [EDP Sciences] [Google Scholar]
- Cottam, J., Paerels, F., Mendez, M., et al. 2002, Nature, 420, 6911 [Google Scholar]
- Cottam, J., Paerels, F., Méndez, M., et al. 2008, ApJ, 672, 504 [NASA ADS] [CrossRef] [Google Scholar]
- Cruise, M., Guainazzi, M., Aird, J., et al. 2025, Nat. Astron., 9, 36 [Google Scholar]
- Cui, W., Chen, L. B., Gao, B., et al. 2020, J. Low Temp. Phys., 199, 502 [NASA ADS] [CrossRef] [Google Scholar]
- Degenaar, N., Miller, J. M., Wijnands, R., Altamirano, D., & Fabian, A. C. 2013, ApJ, 767, L37 [NASA ADS] [CrossRef] [Google Scholar]
- Degenaar, N., Pinto, C., Miller, J. M., et al. 2017, MNRAS, 464, 398 [NASA ADS] [CrossRef] [Google Scholar]
- Degenaar, N., Ballantyne, D. R., Belloni, T., et al. 2018, Space Sci. Rev., 214, 15 [Google Scholar]
- Falanga, M., Chenevez, J., Cumming, A., et al. 2008, A&A, 484, 43 [NASA ADS] [CrossRef] [EDP Sciences] [Google Scholar]
- Galloway, D. K., & Keek, L. 2021, Astrophys. Space Sci. Lib., 461, 209 [NASA ADS] [CrossRef] [Google Scholar]
- Galloway, D. K., Muno, M. P., Hartman, J. M., Psaltis, D., & Chakrabarty, D. 2008, ApJS, 179, 360 [NASA ADS] [CrossRef] [Google Scholar]
- Gofford, J., Reeves, J. N., Tombesi, F., et al. 2013, MNRAS, 430, 60 [Google Scholar]
- Guichandut, S., Cumming, A., Falanga, M., Li, Z., & Zamfir, M. 2021, ApJ, 914, 49 [NASA ADS] [CrossRef] [Google Scholar]
- in’t Zand, J. J. M., & Weinberg, N. N. 2010, A&A, 520, A81 [CrossRef] [EDP Sciences] [Google Scholar]
- in’t Zand, J. J. M., Galloway, D. K., Marshall, H. L., et al. 2013, A&A, 553, A83 [CrossRef] [EDP Sciences] [Google Scholar]
- in’t Zand, J. J. M., Bagnoli, T., D’Angelo, C., et al. 2017, arXiv e-prints [arXiv:1703.07221] [Google Scholar]
- Jaisawal, G. K., Bostancı, Z. F., Boztepe, T., et al. 2024, ApJ, 975, 67 [NASA ADS] [CrossRef] [Google Scholar]
- Jonker, P. G., Kaastra, J., Méndez, M., & In’t Zand, J. J. M. 2008, Astron. Nachr., 329, 198 [NASA ADS] [CrossRef] [Google Scholar]
- Keek, L., Ballantyne, D. R., Kuulkers, E., & Strohmayer, T. E. 2014, ApJ, 797, L23 [NASA ADS] [CrossRef] [Google Scholar]
- Keek, L., Iwakiri, W., Serino, M., et al. 2017, ApJ, 836, 111 [NASA ADS] [CrossRef] [Google Scholar]
- Keek, L., Arzoumanian, Z., Chakrabarty, D., et al. 2018, ApJ, 856, L37 [NASA ADS] [CrossRef] [Google Scholar]
- Lanzuisi, G., Matzeu, G., Baldini, P., et al. 2024, A&A, 689, A247 [NASA ADS] [CrossRef] [EDP Sciences] [Google Scholar]
- Lewin, W. H. G., van Paradijs, J., & Taam, R. E. 1993, Space Sci. Rev., 62, 223 [CrossRef] [Google Scholar]
- Li, Z., Suleimanov, V. F., Poutanen, J., et al. 2018, ApJ, 866, 53 [NASA ADS] [CrossRef] [Google Scholar]
- Li, X., Ge, M., Lin, L., et al. 2022, ApJ, 931, 56 [NASA ADS] [CrossRef] [Google Scholar]
- Lu, Y., Li, Z., Yu, W., Pan, Y., & Falanga, M. 2024, ApJ, 969, 15 [NASA ADS] [CrossRef] [Google Scholar]
- Marino, A., Russell, T. D., Del Santo, M., et al. 2023, MNRAS, 525, 2366 [NASA ADS] [CrossRef] [Google Scholar]
- Nelson, L. A., Rappaport, S. A., & Joss, P. C. 1986, ApJ, 304, 231 [Google Scholar]
- Paczynski, B., & Proszynski, M. 1986, ApJ, 302, 519 [NASA ADS] [CrossRef] [Google Scholar]
- Paczynski, B., & Sienkiewicz, R. 1981, ApJ, 248, L27 [NASA ADS] [CrossRef] [Google Scholar]
- Parra, M., Petrucci, P. O., Bianchi, S., et al. 2024, A&A, 681, A49 [NASA ADS] [CrossRef] [EDP Sciences] [Google Scholar]
- Peng, Z., Li, Z., Pan, Y., et al. 2025, ApJ, 982, 18 [NASA ADS] [CrossRef] [Google Scholar]
- Porquet, D., Reeves, J. N., Uttley, P., & Turner, T. J. 2004, A&A, 427, 101 [NASA ADS] [CrossRef] [EDP Sciences] [Google Scholar]
- Protassov, R., van Dyk, D. A., Connors, A., Kashyap, V. L., & Siemiginowska, A. 2002, ApJ, 571, 545 [NASA ADS] [CrossRef] [Google Scholar]
- Rappaport, S., Nelson, L. A., Ma, C. P., & Joss, P. C. 1987, ApJ, 322, 842 [NASA ADS] [CrossRef] [Google Scholar]
- Remillard, R. A., Loewenstein, M., Steiner, J. F., et al. 2022, AJ, 163, 130 [NASA ADS] [CrossRef] [Google Scholar]
- Salvo, T. D., Papitto, A., Marino, A., Iaria, R., & Burderi, L. 2022, in Low-Magnetic-Field Neutron Stars in X-ray Binaries, eds. C. Bambi, & A. Santangelo (Singapore: Springer Nature Singapore), 1 [Google Scholar]
- Schatz, H., Bildsten, L., Cumming, A., & Ouellette, M. 2003, Nucl. Phys. A, 718, 247 [Google Scholar]
- Šmıd, M., Humphries, O., Baehtz, C., et al. 2024, arXiv e-prints [arXiv:2406.06233] [Google Scholar]
- Stella, L., Priedhorsky, W., & White, N. E. 1987, ApJ, 312, L17 [NASA ADS] [CrossRef] [Google Scholar]
- Strohmayer, T., & Bildsten, L. 2006, in Compact stellar X-ray sources, eds. W. Lewin, & M. van der Klis (Cambridge: Cambridge University Press), Camb. Astrophys. Ser., 39, 113 [Google Scholar]
- Strohmayer, T. E., Altamirano, D., Arzoumanian, Z., et al. 2019, ApJ, 878, L27 [NASA ADS] [CrossRef] [Google Scholar]
- Tombesi, F., Cappi, M., Reeves, J. N., et al. 2010, A&A, 521, A57 [NASA ADS] [CrossRef] [EDP Sciences] [Google Scholar]
- Van Hoof, P. A. M. 2018, Galaxies, 6 [Google Scholar]
- Wang, P. J., Kong, L. D., Chen, Y. P., et al. 2022, MNRAS, 512, 4541 [NASA ADS] [CrossRef] [Google Scholar]
- Weinberg, N. N., Bildsten, L., & Schatz, H. 2006, ApJ, 639, 1018 [NASA ADS] [CrossRef] [Google Scholar]
- Xu, X., & Wang, J. 2022, ApJ, 938, 127 [NASA ADS] [CrossRef] [Google Scholar]
- Yu, H., & Weinberg, N. N. 2018, ApJ, 863, 53 [CrossRef] [Google Scholar]
- Yu, W., Li, Z., Lu, Y., et al. 2024, A&A, 683, A93 [NASA ADS] [CrossRef] [EDP Sciences] [Google Scholar]
- Zhang, Y.-N., Li, C., Xu, D., & Cui, W. 2022, Exp. Astron., 53, 1053 [NASA ADS] [CrossRef] [Google Scholar]
- Zhang, Y.-Q., Xiong, S.-L., Mao, J.-R., et al. 2024, Sci. China Phys. Mech. Astron., 67, 289511 [Google Scholar]
- Zhao, Y., Xu, H., Liu, A., et al. 2025, A&A, 695, A15 [NASA ADS] [CrossRef] [EDP Sciences] [Google Scholar]
Appendix A: Table
Burst observations.
All Tables
All Figures
|
Fig. 1. 0.1 s binned light curves of 15 X-ray bursts from 4U 1820–30 observed by NICER in 0.5–10 keV are marked as red lines. The right axis shows the 3–10 keV light curves as black lines. The persistent emissions are regarded as background and subtracted. The gray shaded region mark the intervals used to extract PRE phase spectra. |
| In the text | |
|
Fig. 2. PRE phase spectra and residuals for burst # 9. Top panel: PRE phase spectra from the burst # 9. The best-fit model, Tbabs × (bbodyrad+gaussion+bbodyrad) × gabs × gabs, is represented by the solid red line. The 1 keV emission line are clearly shown in the spectra and a pair of absorption lines are indicated near 1.6 and 3 keV. The two middle panels are the residuals of the spectra fitted with 3c50 and SCORPEON backgrounds, respectively. The bottom panel shows the residuals of the best-fit model to the spectra. |
| In the text | |
|
Fig. 3. Distributions of the ΔC of 105 simulations for the lines of burst # 9. The distributions fitted by χ2-distribution with two dofs (red dashed-dotted lines). From top to bottom panel, the arrow marks the significance for the 1 keV emission line, 1.6 and 3.0 keV absorption lines, respectively. |
| In the text | |
|
Fig. 4. Unabsorbed spectra extracted during the PRE phase for all bursts in 0.3–5 keV. The solid red lines indicate the best-fitting model, including the continuum and spectral lines if necessary. The residuals of the best fit model to the data are plotted in bottom panels. |
| In the text | |
|
Fig. 5. Coadded spectroscopy of all bursts (except burst # 2) at the maximum photospheric radius. The solid red line is the best-fitting model including the continuum and the emission line, E1, the absorption lines, E2 and E3, and the absorption lines at 2.2 keV (due to the reflectivity of gold M shell of the detector itself). The middle panel shows the residuals of the fitting of the model without lines. The residuals of the best fit model to the data are plotted in the bottom panel. |
| In the text | |
|
Fig. 6. Distributions of the ΔC for 105 simulations for the coadded spectra lines. From top to bottom: Distributions of the simulations for 1 keV emission line (E1), 1.6 keV absorption line (E2), and 3 keV absorption line (E3). The distributions fitted by χ2-distribution with two dofs (red solid lines). The arrow marks the measured ΔC from the true data. |
| In the text | |
|
Fig. 7. Coadded spectroscopy of all burst at the moderate expansion phase (black) and the touchdown moment (blue). The touchdown spectra show no evidence of line features and the moderate expansion phase shows a narrow 1 keV emission line. |
| In the text | |
|
Fig. 8. 1 keV emission lines of 13 bursts with the blackbody radius. The Lyα transition of Ne X in the rest frame at 1.022 keV is plotted with blue dot line. The Fe L shell transitions at 1.045, 1.055 and 1.066 keV are plotted with red dot line, see e.g., Guichandut et al. (2021). |
| In the text | |
|
Fig. 9. Ratios of the centroid energy between E3 and E1 at the same time. The distributions are well fitted by two Gaussian function. The main peak at 2.819, and secondary at 2.972. |
| In the text | |
|
Fig. 10. Mock HUBS X-ray spectrum with the continuum parameters from burst #8 and two additional narrow emission lines. The best fitting model is Tbabs × (bbodyrad+gaussian+gaussian+bbodyrad). The dashed lines represent the two Gaussian lines. The best-fit model is plotted as red solid line. The burst blackbody and disk blackbody components are shown in pink and green dotted lines, respectively. |
| In the text | |
|
Fig. 11. Distributions of the ΔC for 105 simulations for the lines of the mock HUBS spectra. From top to bottom: Distributions of the simulations for 1.005 (Ea) and 1.06 keV (Eb) emission lines. The distributions fitted by χ2-distribution with two dofs (red dashed-dotted lines). The arrow marks the measured ΔC from the true data. |
| In the text | |
Current usage metrics show cumulative count of Article Views (full-text article views including HTML views, PDF and ePub downloads, according to the available data) and Abstracts Views on Vision4Press platform.
Data correspond to usage on the plateform after 2015. The current usage metrics is available 48-96 hours after online publication and is updated daily on week days.
Initial download of the metrics may take a while.