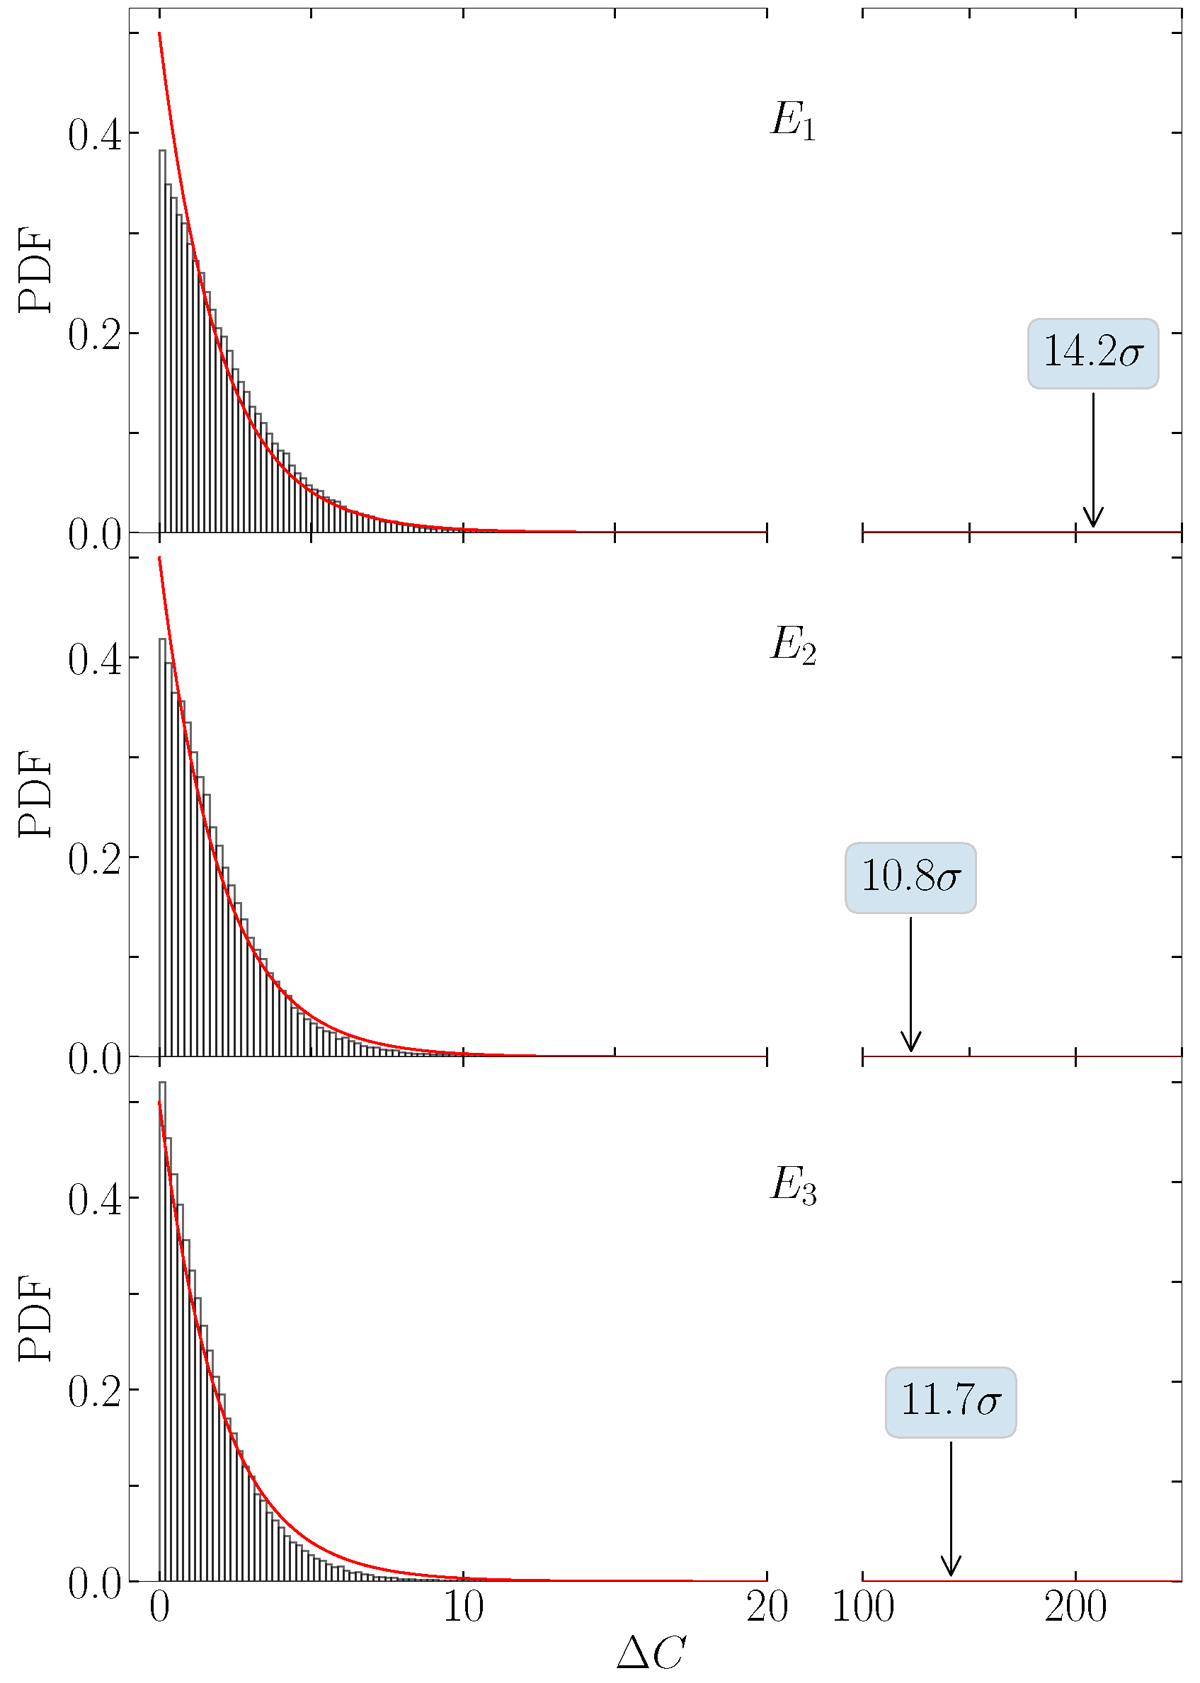
Fig. 6.
Download original image
Distributions of the ΔC for 105 simulations for the coadded spectra lines. From top to bottom: Distributions of the simulations for 1 keV emission line (E1), 1.6 keV absorption line (E2), and 3 keV absorption line (E3). The distributions fitted by χ2-distribution with two dofs (red solid lines). The arrow marks the measured ΔC from the true data.
Current usage metrics show cumulative count of Article Views (full-text article views including HTML views, PDF and ePub downloads, according to the available data) and Abstracts Views on Vision4Press platform.
Data correspond to usage on the plateform after 2015. The current usage metrics is available 48-96 hours after online publication and is updated daily on week days.
Initial download of the metrics may take a while.