Open Access
Fig. 4.
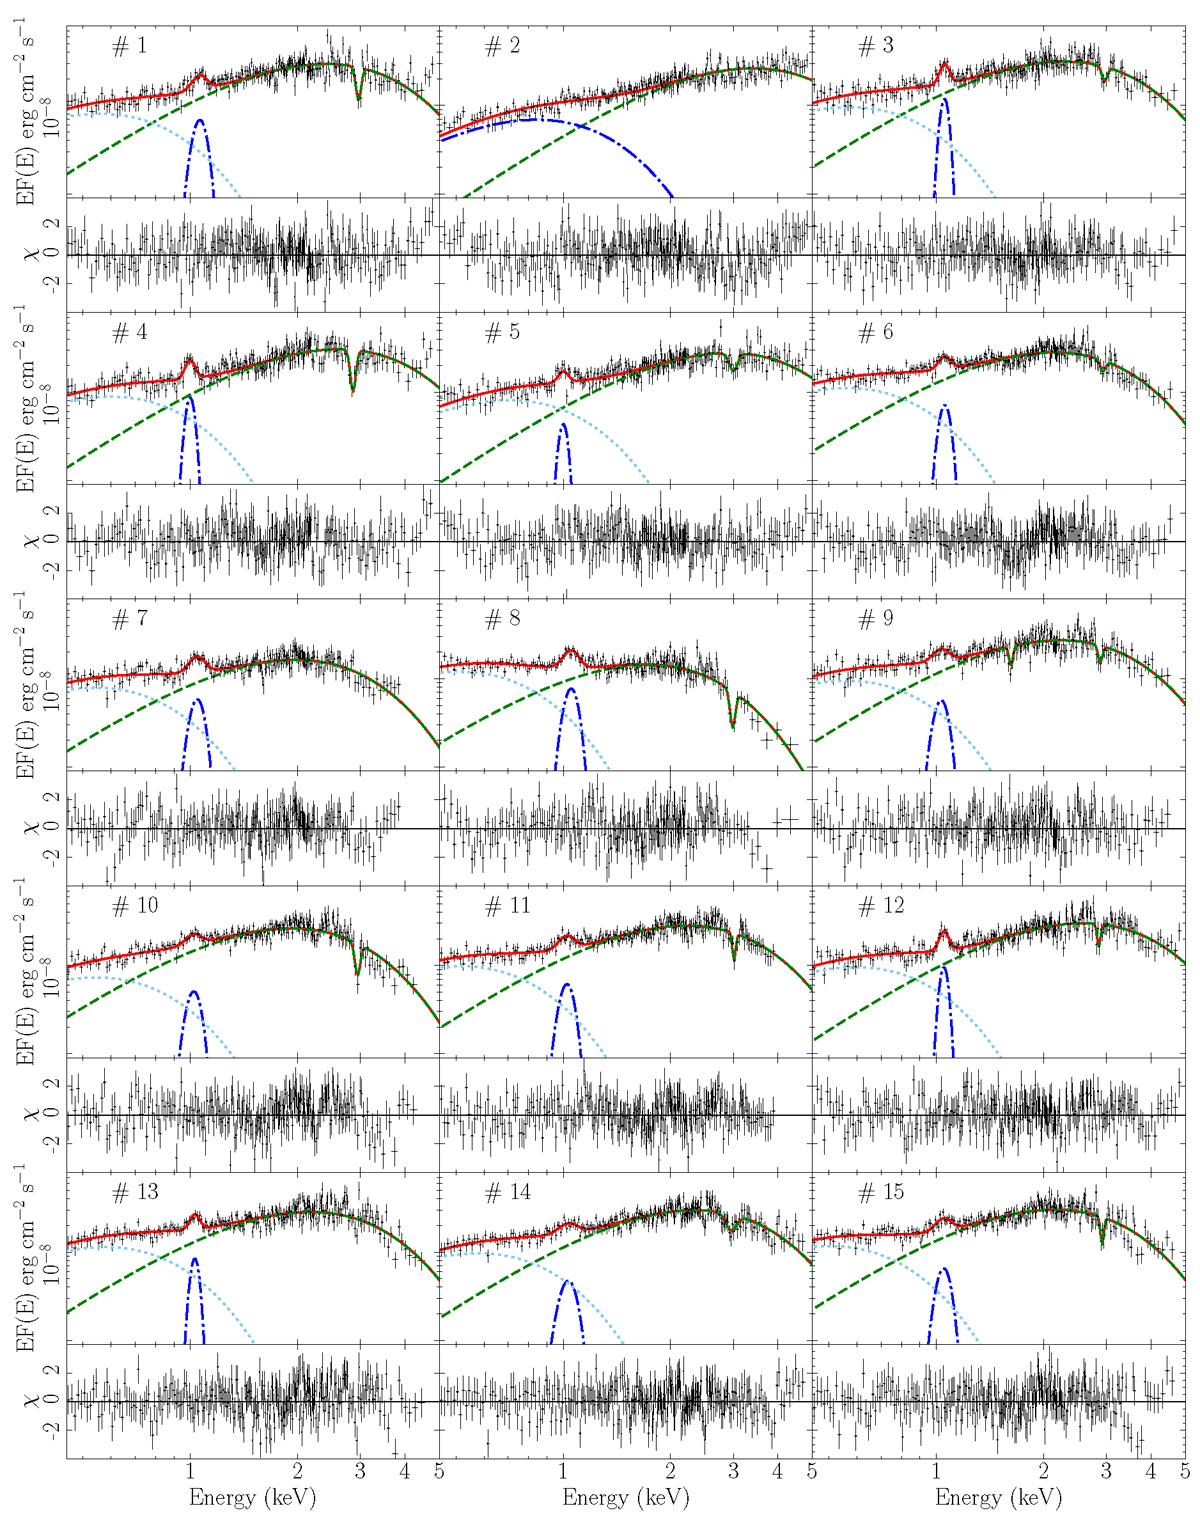
Download original image
Unabsorbed spectra extracted during the PRE phase for all bursts in 0.3–5 keV. The solid red lines indicate the best-fitting model, including the continuum and spectral lines if necessary. The residuals of the best fit model to the data are plotted in bottom panels.
Current usage metrics show cumulative count of Article Views (full-text article views including HTML views, PDF and ePub downloads, according to the available data) and Abstracts Views on Vision4Press platform.
Data correspond to usage on the plateform after 2015. The current usage metrics is available 48-96 hours after online publication and is updated daily on week days.
Initial download of the metrics may take a while.