Fig. 10.
Download original image
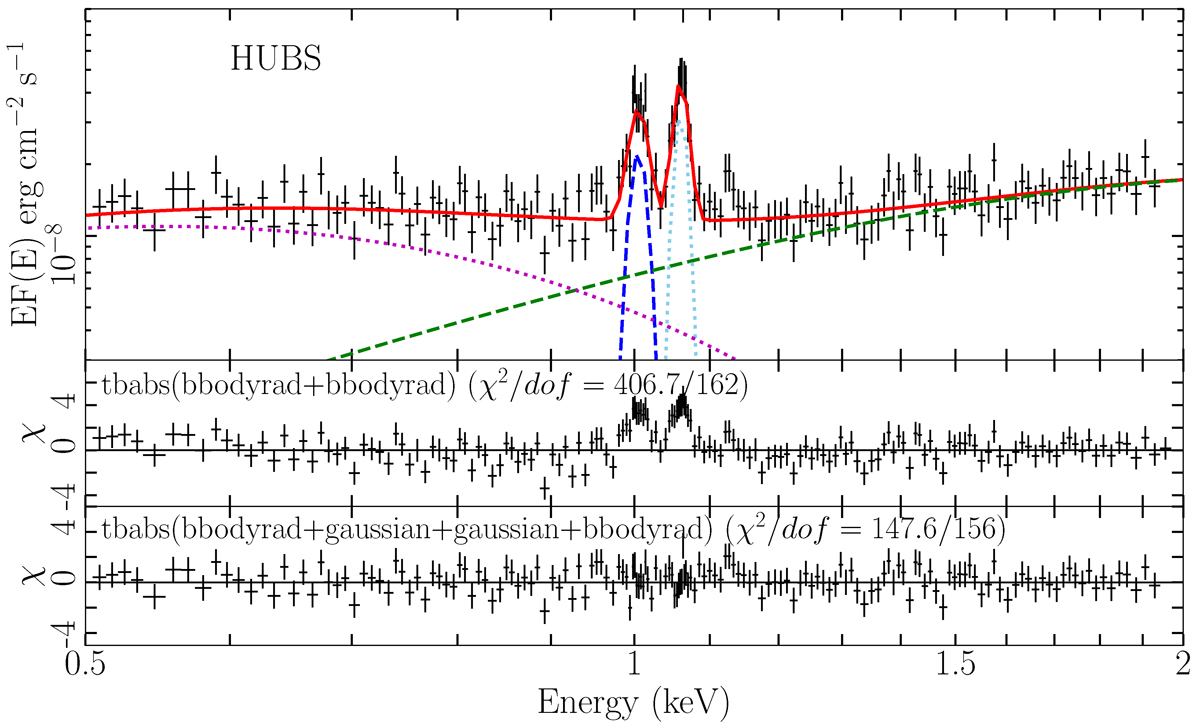
Mock HUBS X-ray spectrum with the continuum parameters from burst #8 and two additional narrow emission lines. The best fitting model is Tbabs × (bbodyrad+gaussian+gaussian+bbodyrad). The dashed lines represent the two Gaussian lines. The best-fit model is plotted as red solid line. The burst blackbody and disk blackbody components are shown in pink and green dotted lines, respectively.
Current usage metrics show cumulative count of Article Views (full-text article views including HTML views, PDF and ePub downloads, according to the available data) and Abstracts Views on Vision4Press platform.
Data correspond to usage on the plateform after 2015. The current usage metrics is available 48-96 hours after online publication and is updated daily on week days.
Initial download of the metrics may take a while.