Open Access
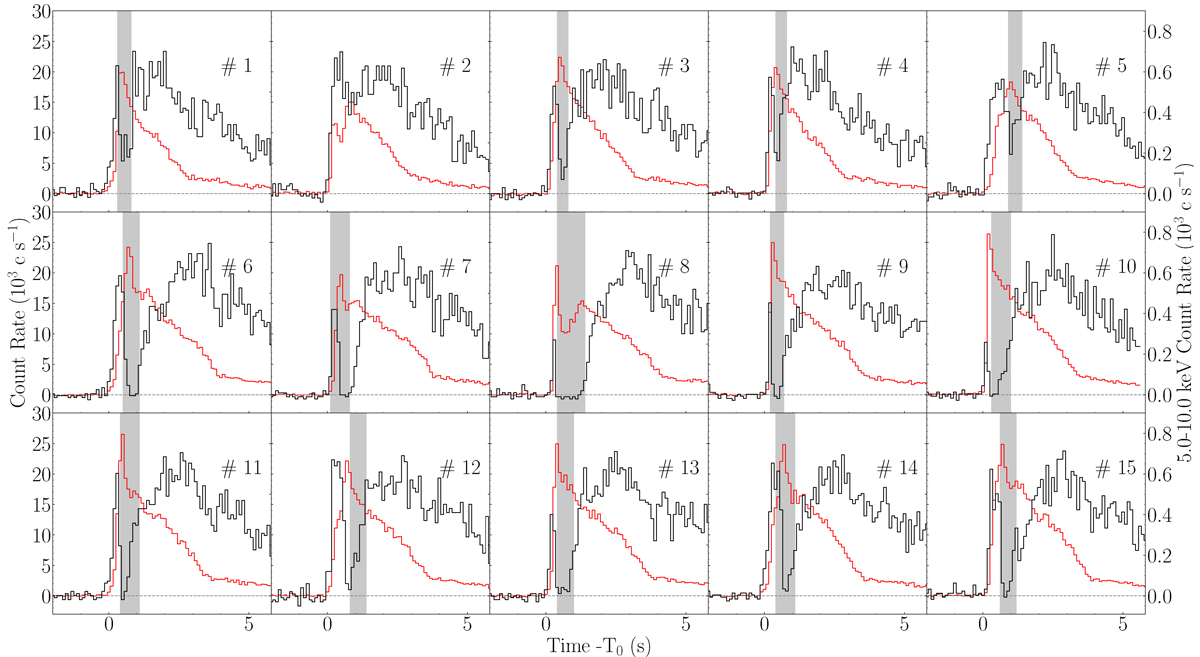
Fig. 1.
Download original image
0.1 s binned light curves of 15 X-ray bursts from 4U 1820–30 observed by NICER in 0.5–10 keV are marked as red lines. The right axis shows the 3–10 keV light curves as black lines. The persistent emissions are regarded as background and subtracted. The gray shaded region mark the intervals used to extract PRE phase spectra.
Current usage metrics show cumulative count of Article Views (full-text article views including HTML views, PDF and ePub downloads, according to the available data) and Abstracts Views on Vision4Press platform.
Data correspond to usage on the plateform after 2015. The current usage metrics is available 48-96 hours after online publication and is updated daily on week days.
Initial download of the metrics may take a while.