Fig. 5.
Download original image
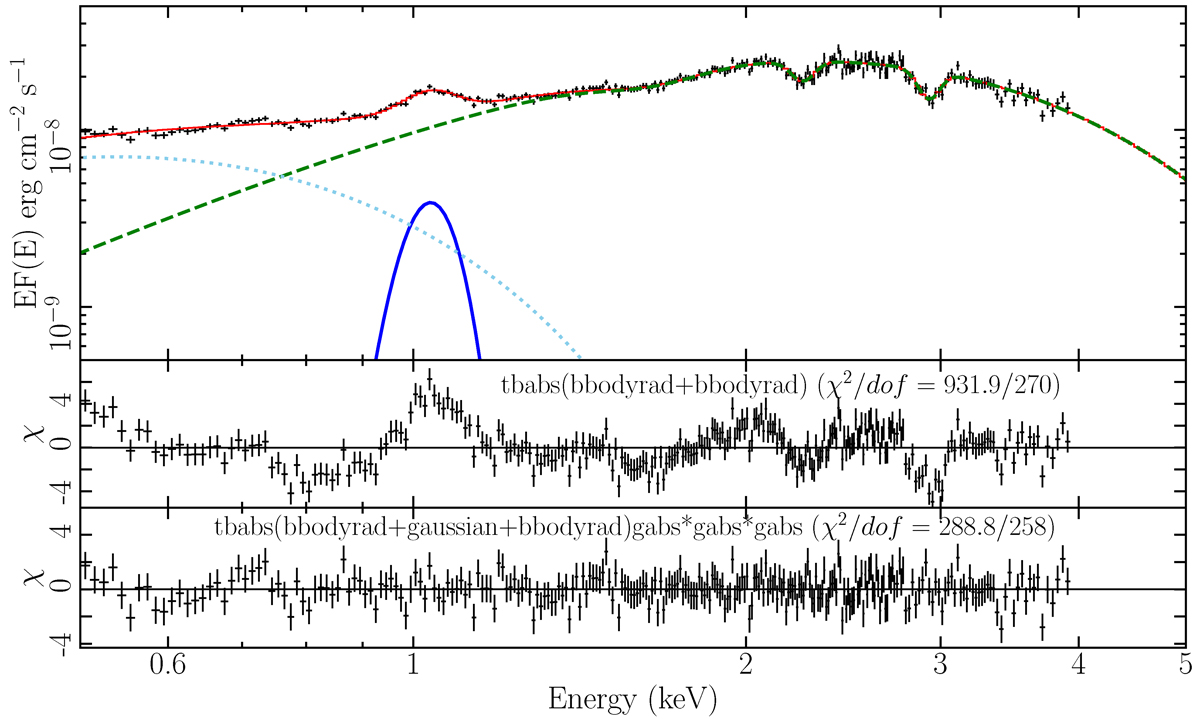
Coadded spectroscopy of all bursts (except burst # 2) at the maximum photospheric radius. The solid red line is the best-fitting model including the continuum and the emission line, E1, the absorption lines, E2 and E3, and the absorption lines at 2.2 keV (due to the reflectivity of gold M shell of the detector itself). The middle panel shows the residuals of the fitting of the model without lines. The residuals of the best fit model to the data are plotted in the bottom panel.
Current usage metrics show cumulative count of Article Views (full-text article views including HTML views, PDF and ePub downloads, according to the available data) and Abstracts Views on Vision4Press platform.
Data correspond to usage on the plateform after 2015. The current usage metrics is available 48-96 hours after online publication and is updated daily on week days.
Initial download of the metrics may take a while.