| Issue |
A&A
Volume 696, April 2025
|
|
|---|---|---|
| Article Number | A140 | |
| Number of page(s) | 11 | |
| Section | Interstellar and circumstellar matter | |
| DOI | https://doi.org/10.1051/0004-6361/202452072 | |
| Published online | 11 April 2025 | |
DCO+ and DCN 1–0 survey toward a sample of Planck cold clumps
1
Guangxi Key Laboratory for Relativistic Astrophysics, School of Physical Science and Technology, Guangxi University,
Nanning
530004,
PR China
2
National Astronomical Observatories, Chinese Academy of Sciences,
Beijing
100101,
PR China
3
Key Laboratory of Radio Astronomy and Technolgoy, Chinese Academy of Sciences,
A20 Datun Road, Chaoyang District,
Beijing
100101, PR China
4
Space Engineering University,
Beijing
101416,
PR China
5
School of Physics and Astronomy, Sun Yat-sen University,
Zhuhai
519082, PR China
6
Shanghai Astronomical Observatory, Chinese Academy of Sciences,
No. 80 Nandan Road,
Shanghai
200030, PR China
7
School of Astronomy and Space Sciences, University of Chinese Academy of Sciences,
No. 19A Yuquan Road,
Beijing
100049, PR China
8
Department of Electrical and Electronic Engineering, Guilin University of Technology at Nanning,
Nanning
530001, PR China
★ Corresponding author; This email address is being protected from spambots. You need JavaScript enabled to view it.
Received:
30
August
2024
Accepted:
4
March
2025
Abstract
Context. Deuterated molecules can be used to study the physical conditions and astro-chemical evolution of molecular clouds.
Aims. Large-sample surveys for deuterated molecules are needed to understand the enhancement of deuterated molecules from diffuse molecular gas to cold cores.
Methods. A single-pointing survey toward the 559 Planck cold clumps of the Early Cold Core Catalogue (ECC) was conducted using the Arizona Radio Observatory 12-meter telescope, focusing on the J = 1–0 transitions of DCO+ and DCN. The survey included observations of 309 cores for DCO+ and DCN 1–0 simultaneously, followed by 71 of these cores where DCO+ 1–0 was detected for H13CO+ and H13CN 1–0 simultaneously, aiming to determine the deuterated fraction (Dfrac). Additionally, 250 cores were observed for DCO+, DCN, H13CO+, and H13CN 1–0 simultaneously.
Results. DCO+ and DCN 1–0 were detected in 79 and 11 of the 309 sources, with detection rates of 25.6% and 3.6%, respectively. In the 250 sources that were observed for all four species, DCO+, DCN, H13CO+, and H13CN 1–0 were detected in 58, 9, 57, and 13 sources, with a detection rate of 23.2%, 3.6%, 22.8%, and 5.2%, respectively. The Dfrac(HCO+) values in 112 sources range from 0.89% to 7.4%, with a median value of 3.1%, while Dfrac(HCN) values in 11 sources range from 1.5% to 5.5%, with a median value of 2.3%. The line widths of the DCO+ and H13CO+ 1–0 detections are mostly within 1 km s−1.
Conclusions. The similarity in Dfrac values between HCO+ and HCN indicates that the higher detection rate of DCO+ 1–0 compared with DCN 1–0 is due to the lower critical density of DCO+ 1–0. We suggest that the enhancement of DCO+ and DCN likely begins in the early diffuse stage of the molecular cloud and not during the cold-core formation stage.
Key words: methods: observational / ISM: abundances / ISM: clouds / ISM: molecules / radio lines: ISM
© The Authors 2025
 Open Access article, published by EDP Sciences, under the terms of the Creative Commons Attribution License (https://creativecommons.org/licenses/by/4.0), which permits unrestricted use, distribution, and reproduction in any medium, provided the original work is properly cited.
This article is published in open access under the Subscribe to Open model. This email address is being protected from spambots. You need JavaScript enabled to view it. to support open access publication.
1 Introduction
Deuterated molecules are useful tools for studying the physical conditions and astro-chemical evolution of molecular clouds (Roberts et al. 2002; Guilloteau et al. 2006). The deuterium fractionation, that is, the abundance ratios of deuterated molecules to their hydrogenated counterparts, are much enhanced over the cosmic D/H elemental abundance ratio ~1.5 × 10⁻⁵ (Roberts & Millar 2000). Due to the lower zeropoint energy of deuterated molecules compared to their nondeuterated counterparts, which ensures that deuterium is preferentially bonded into molecules compared to hydrogen, deuterated molecules can be synthesized effectively in the cold gas-phase during the early stage of the evolution of molecular clouds (Roberts & Millar 2000). The process of deuterium fractionation is sensitive to various physical conditions such as temperature, density, CO depletion (Millar et al. 1989; Feng et al. 2020), and ionization (Caselli 2002), and low temperatures and high densities have particularly significant effects (Fontani et al. 2011; Pillai et al. 2011). Therefore, deuterated molecules are considered as excellent tracers for cold (T ~ 10 K) and dense (n ≥104 cm−3) regions within molecular clouds (Roberts & Millar 2007).
After the detection of DCN in the Orion Nebula molecular cloud (Jefferts et al. 1973), many other deuterated species were identified in molecular clouds over the past decades. These include DCO+ (Hollis et al. 1976; Tiné et al. 2000; Caselli 2002), DNC (Snell & Wootten 1977; van der Tak et al. 2009; Yang et al. 2024), N2D+ (Snyder et al. 1977; Crapsi et al. 2005; Fontani et al. 2006), deuterated NH3 (Turner et al. 1978; Roueff et al. 2005; Pillai et al. 2007; Li et al. 2022b), and deuterated H2CO (Watson et al. 1975; Roberts et al. 2002; Roberts & Millar 2007). Among these deuterated molecules, DCO+ and DCN are particularly valuable for studying the physical conditions and astro-chemical evolution of molecular clouds. This is due to their relatively high abundances, simple rotational spectra, accessible rotational transitions (Yang et al. 2024), and their synthetic pathways, which are closely linked to the deuterium fractionation process (Millar et al. 1989). Observational studies (Watson 1973; Roberts et al. 2002; Feng et al. 2020) and theoretical models (Herbst 1982; Millar et al. 1989) of deuterium chemistry suggest that DCO+ and DCN are important for understanding the evolution of a molecular cloud.
The deuterated fraction (Dfrac) is defined as the abundance ratio of a deuterated molecule to its hydrogenated counterpart. This ratio was studied for many deuterated species (Hirota et al. 2001; Turner 2001; Caselli 2002; Roberts et al. 2002), including DCO+ and DCN. DCO+ was first detected in the molecular clouds NGC 2264, and DR (OH) was studied with H13CO+/DCO+ abundance ratios of 0.54 and 1.18 (Hollis et al. 1976). The DCO+/HCO+ ratio was found to be ~0.18 in the dark cloud L134N and 0.02 in TMC1-N (Tiné et al. 2000). For massive starless clump candidates, the DCO+/HCO+ and DCN/HCN ratios were estimated to be 0.011−0.040 and 0.004– 0.045, respectively (Yang et al. 2024). The DCN/HCN ratio increases from 0.001 in the hot core gas close to the infrared source IRc2 to values of 0.01−0.06 in the OMC-1 ridge region (Schilke et al. 1992). The abundance of deuterated molecules is considered crucial for understanding the physical conditions and deuterium chemistry in the cold gas-phase of molecular clouds.
However, large-sample surveys of DCO+ and DCN lines toward cold dense cores are still lacking in the literature. This gap limits our understanding of the enhancement of deuterated molecules in the phase from diffuse molecular gas to cold cores, including the measurements of Dfrac for these molecules. The Planck cold clumps from the Early Cold Core Catalogue (ECC), which were selected from Wu et al. (2012), lack feedback from star formation, represent some of the most quiescent regions, and are ideal for such large-sample surveys. These Planck cold clumps have a typical mass of ~5 M⊙, a size of ~0.5 pc (Planck Collaboration XXVIII 2016), and an excitation temperature of ~10 K (Wu et al. 2012).
We present a single-pointing survey of DCO+ and DCN 1−0 toward the 559 Planck cold clumps observed to date. The observational details are described in Sect. 2, the results are presented in Sect. 3, and the discussion and summary are provided in Sect. 4 and Sect. 5, respectively.
2 Observations
In total, 559 sources selected from the 674 Planck cold clumps with CO line detections (Wu et al. 2012) were observed using the Arizona Radio Observatory (ARO) 12-meter telescope in 2020 and 2023. The masses of 83 of the 559 observed sources can be found in Planck Collaboration XXVIII (2016), with mass values ranging from 0.29 to 1.85 × 10⁴ M⊙. There are 75 sources with masses below 100 M⊙, 6 sources with masses between 100 and 1000 M⊙, and only 2 sources with masses exceeding 1000 M⊙. The kinematic distances of these 559 sources range from 0.10 to 21.58 kpc, while the excitation temperatures derived from CO 1– 0 (Tex(CO) hereafter) range from 3.9 to 27.1 K (Wu et al. 2012). The beam size at 72 GHz is ~87″. The focus was checked at the beginning of each observing block. The pointing was checked every two hours on a nearby quasar or planet. The main-beam brightness temperature (Tmb) was calculated from  , where
  is the antenna temperature, and η is the average beam efficiency of the 4 mm receiver, with a value of 0.92 ± 0.06.
In early 2020, 258 sources were observed in DCO+ and DCN 1−0 using the 4 mm receiver (66–90 GHz) with dual polarizations and the ARO Wideband Spectrometer (AROWS) with mode 3, which provides a 78.125 kHz channel spacing (~0.32 km s−1 at 72 GHz) and 500 MHz bandwidth, covering DCO+ 1−0 at 72.039312 GHz and DCN 1−0 at 72.414927 GHz simultaneously. Due to the limited velocity resolution of ~0.32 km s−1 with AROWS mode 3, accurate measurements of the full width at half maximum (FWHM) for sources with narrow line widths were challenging. To address this, high spectral resolution supplementary observations were conducted for 32 sources with narrow DCO+ 1−0 lines using AROWS mode 5, which provides a 19.531 kHz channel spacing (~0.081 km s−1 at 72 GHz) and 125 MHz bandwidth. To derive Dfrac, 41 sources with DCO+ 1−0 detections were observed for H13CO+ 1−0 at 86.754288 GHz and H13CN 1−0 at 86.3401764 GHz simultaneously, using AROWS mode 3 with a velocity resolution ~0.27 km s−1 at 86 GHz. Standard position-switching mode was used with 3 minutes on and 3 minutes off for each source. The typical system temperatures (Tsys) were 150 K at 72 GHz and 120 K at 86 GHz, resulting in a root-mean-square (rms) noise level of ~50 mK at 78.125 kHz channel spacing for the final spectrum after averaging both polarizations.
In 2023, 51 sources were observed for DCO+ and DCN 1−0, with 30 sources additionally observed for H13CO+ and H13CN 1−0. The same setup was used as in 2020.
In 2023, 250 sources were observed using the 4 mm receiver and the newly updated AROWS multiwindow mode 13, which provides up to eight spectral windows of the same size with a 19.53 kHz channel spacing (~0.081 km s−1 at 72 GHz) and a bandwidth of 40 MHz. This setup covers DCO+ and DCN 1−0 in the lower sideband (LSB) and H13CO+ and H13CN 1-0 in the upper sideband (USB) simultaneously. The standard positionswitching mode was used with 30 seconds on and 30 seconds off, repeating six times for each source. The typical Tsys values are 150 K at 72 GHz and 120 K at 86 GHz, resulting in an rms noise level of ~100 mK at the 19.53 kHz channel spacing for the final spectrum after averaging both polarizations. As a result of a software bug in the multiwindow configuration code during the shared-risking period for the wrong sign of the Doppler correction for the second sideband in observations using AROWS mode 13 in 2023, the VLSR measurements of H13CO+ and H13CN 1−0 in USB exhibit offsets of 1 to 7 km s−1, even though all the parameters were obtained for the lines in the first sideband (which is the LSB, including DCO+ and DCN 1−0), but all the other parameters are correct. Therefore, the VLSR values of H13CO+ and H13CN 1−0 are not provided in Sect. 3 and were not used for the scientific discussion.
The data reduction was performed using the CLASS package in the GILDAS1 software. After checking each scan, we discarded poor scans (fewer than 3%). A first-order baseline was applied to all spectral lines, and a single-component Gaussian fitting was applied to obtain parameters, including the velocity- integrated intensity (∫Tmbdv denoted as W hereafter), VLSR, and FWHM for each source.
3 Results
Sources considered with detections were judged by W greater than 3σ, where both W and σ were obtained from the Gaussian fitting in CLASS. W of the DCO+ 1−0 line is denoted as W(DCO+) hereafter, and an analogous notation is applied to the DCN, H13CO+, and H13CN 1−0 lines. Examples of detections for the DCO+ and DCN 1−0 lines toward G091.73+04.3 observed in 2020 using the low-velocity resolution mode (AROWS mode 3) are shown in Figure 1. The detections toward G159.21- 20.1 observed in 2023 using high-resolution mode (AROWS mode 13) are shown in Figure 2. Since each source was observed for approximately the same duration of six minutes, the noise levels of the spectra are similar, although the different rms levels are caused by a different velocity resolution. DCN and H13CN J = 1−0 exhibit hyperfine splitting into the F = 1−0, 2−1, and 0−0 components, and F = 2−1 is the strongest. For the results and discussion in this paper, we focused on the J = 1−0, F = 2−1 lines of DCN and H13CN, which are written as DCN 1−0 and H13CN 1−0 hereafter.
Detection rates of different molecular lines and observing modes.
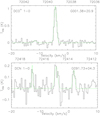 |
Fig. 1 Spectral lines of DCO+ and DCN 1−0 (black line) overlaid with the Gaussian fitting results (green line) toward G091.73+04.3, as observed in 2020 using the low-velocity resolution mode (AROWS mode 3) with a velocity resolution of ~0.32 km s−1. The hyperfine components of DCN 1−0 are visible. |
3.1 Detection rates of DCO+, DCN, H13CO+, and H13CN 1−0
Using the low-velocity resolution mode (AROWS mode 3), we detected DCO+ and DCN 1−0 in 79 and 11 out of 309 sources with detection rates of 25.6% and 3.6%, respectively. Using the high-velocity resolution mode (AROWS mode 13), we detected DCO+, DCN, H13CO+, and H13CN 1−0 in 58, 9, 57, and 13 out of 250 sources with detection rates of 23.2%, 3.6%, 22.8%, and 5.2%, respectively. The detection rates of DCO+ and DCN 1−0 are similar in the two AROWS modes. Overall, the detection rates for DCO+ and DCN 1−0 are 24.5% and 3.6%, with detections in 137 and 20 out of 559 sources, respectively. The detection rates are summarized in Table 1. The detailed detection status is presented in Table A.1 (see Appendix A).
The detection rates of DCO+ and H13CO+ 1−0 are similar in the 250 sources observed with the high-velocity resolution mode (AROWS mode 13), and detections of these two lines occurred simultaneously in most sources. In 46 sources, both DCO+ and H13CO+ 1−0 were detected, with a median W(DCO+) of 6.0σ and a median W(H13CO+) of 7.0σ. Twelve sources only showed detections of DCO+ 1−0, with a median W (DCO+) of 4.0σ. These sources are G168.85-15.8, G161.85-08.6, G163.32- 08.4, G165.69-09.1, G178.48-06.7, G195.00-16.9, G177.14-01.2, G200.34-10.9, G185.33-02.1, G181.84+00.3, G199.88+00.9, and G201.13+00.3. Eleven sources only had H13CO+ 1−0 detections, suggesting that deuterium enhancement may not occur, with median a W(H13CO+) of 6.6σ, These sources are G159.23- 34.4, G162.64-31.6, G168.00-15.6, G170.13-16.0, G170.99- 15.8, G165.16-07.5, G195.09-16.4, G159.34+11.2, G191.00-04.5, G215.00-15.1, and G216.18-15.2.
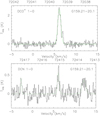 |
Fig. 2 Spectral lines of DCO+ and DCN 1−0 (black line) overlaid with the Gaussian fitting results (green line) toward G159.21-20.1, as observed in 2023 using the high-velocity resolution mode (AROWS mode 13) with a velocity resolution of ~0.081 km s−1. The hyperfine components of DCN 1−0 are visible. |
3.2 Derived parameters of the detected DCO+ and DCN 1−0
The parameters for sources with DCO+ 1−0 detections are listed in Table A.2, and those with DCN 1−0 detections are listed in Table A.3 (see Appendix A). DCO+ and DCN 1−0 were detected in 137 and 20 out of 559 sources, respectively. Sixten sources had detections of both DCO+ and DCN 1−0, 121 sources with DCO+ but without DCN, 4 sources with DCN but without DCO+, and 418 sources with no detection of either molecule. The distributions of W(DCO+) and W(DCN) are shown in Figure 3. W(DCO+) ranges from 0.06 to 2.40 K km s−1 with a median value of 0.35 K km s−1, and the FWHM ranges from 0.2 to 2.5 km s−1 with a median value of 0.7 km s−1. W(DCN) ranges from 0.10 to 0.44 K km s−1 with a median value of 0.15 K km s−1, and the FWHM ranges from 0.2 to 1.2 km s−1 with a median value of 0.4 km s−1.
In G209.28-19.6 and G206.10-15.7, multiple velocity components of DCO+ 1−0 were found. In G209.28-19.6, W was derived by directly integrating the velocity range of the line. In G206.10- 15.7, two components are shown in Figure 4, with W values derived from a double-component Gaussian fitting.
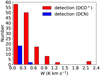 |
Fig. 3 Distribution of W(DCO+) (red bars) and W(DCN) (blue bars). |
3.3 Derived parameters of the detected H13CO+and H13CN 1−0
We observed a total of 71 sources, selected from 79 sources with DCO+ 1−0 detections using the low-velocity resolution mode (AROWS mode 3), for H13CO+ and H13CN 1−0 simultaneously in the low-velocity resolution mode (AROWS mode 3). H13CO+ 1−0 was detected in 66 of these 71 observed sources. Twenty of these 66 sources with H13CO+ 1−0 had H13CN 1−0 detections.
H13CO+ and H13CN 1−0 were detected using the high- velocity resolution mode (AROWS mode 13) in 57 and 13 out of 250 sources, respectively, and 12 sources showed detections of both H13CO+ and H13CN 1-0. The distributions of W(H13CO+) and W (H13 CN) with this mode are shown in Figure 5.
The parameters for H13CO+ and H13CN 1−0 are listed in Table A.4 and Table A.5 (see Appendix A), respectively. W(H13CO+) ranges from 0.06 to 1.11 K km s−1 with a median value of 0.24 K km s−1 , and the FWHM ranges from 0.1 to 2.4 km s−1 with a median value of 0.5 km s−1. W(H13CN) ranges from 0.05 to 0.28 km s−1 with a median value of 0.10 K km s−1 , and the FWHM ranges from 0.2 to 1.5 km s−1 with a median value of 0.4 km s−1 .
As mentioned in Sect. 3.2, G206.10-15.7 and G209.28-19.6 also exhibited multiple velocity components of H13CO+ 1−0. For G209.28-19.6, W(H13CO+) was derived by directly integrating the velocity range of the line. For G206.10-15.7, the parameters for H13CO+ 1−0 with two velocity components are listed in Table A.4 (see Appendix A).
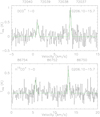 |
Fig. 4 Spectral lines of DCO+ and H13CO+ 1−0 (black line) overlaid with the Gaussian fitting results (green line) toward G206.10-15.7. Double-velocity components in DCO+ and H13CO+ 1−0 were detected. |
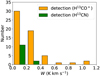 |
Fig. 5 Distribution of W(H13CO+) (orange bars) and W(H13CN) (green bars). |
3.4 Deuterated fraction of HCO+and HCN
The Dfrac values of HCO+ and HCN were estimated by calculating the column density ratios of deuterated molecules to their hydrogenated counterparts, using their 13C-isotopolog counterparts. The column densities were derived from Eq. (1), assuming local thermodynamic equilibrium (LTE) and that the two deuterated molecules and their 13C-isotopolog counterparts are optically thin,
 (1)
(1)
Here, k = 1.38 × 10⁻¹³ erg K−1 is the Boltzmann constant, v is the frequency of the transition, h = 6.624 × 10⁻²⁷ erg s is the Planck constant, c = 2.998 × 1010 cm s−1 is the speed of light, Tex is the excitation temperature (assumed to be 9.375 K), Q(Tex) is the partition function dependent on the Tex, Aul is the Einstein emission coefficient, gu is the upper-level degeneracy, and El is the energy of the ground state. Q(Tex), Aul, gu, and El for the four transitions are given by the CDMS (van der Tak et al. 2009). Since all the four lines are the transitions between J =1 and J = 0, El is zero for each line.
According to Eq. (1), the column density ratios of deuterated molecules to their 13C-isotopolog counterparts are given by N(DCO+)/N(H13CO+)≈1.33×W(DCO+)/W(H13CO+) and N(DCN)/N(H13CN)≈1.30×W(DCN)/W(H13CN). Tex = 9.375 K is a reasonable assumption, since these sources are cold cores. Even when the gas density is below the critical densities of these lines, which might invalidate the LTE assumption, the derived column densities of DCO+ and H13CO+ may have large uncertainties. However, the relative abundance ratio of DCO+/H13CO+ estimated based on there J = 1−0 lines does not vary much because the two molecules have similar excitation conditions, which can cancel the bias in the column density estimation. This also holds for estimating the relative abundance ratio of DCN/H13CN.
The kinematic distances of the Planck cold clumps were obtained for 741 13CO components, with 51% ranging from 0.5 to 1.5 kpc (Wu et al. 2012), indicating that these sources are in the solar neighborhood. The corresponding physical scale of the beam size 87″ for source at 1 kpc is ~4 pc. The 12C/13C ratio as a function of Galactocentric distance DGC, 12C/13C = 6.21 DGC + 18.71, provided in Milam et al. (2005), where the DGC of the sun is 8.15 kpc (Reid et al. 2019). A 12C/13C ratio of 68, representative of the local interstellar medium, was used for these Planck cold clumps. The Dfrac values were derived from the 12C/13C ratios and column density ratios: Dfrac(HCO+) = 1/68×N(DCO+)/N(H13CO+) and Dfrac(HCN) = 1/68×N(DCN)/N(H13CN), which are listed in Table A.6 (see Appendix A). The 3σ upper limit values are also provided, calculated as  (K ⋅ km ⋅ s−1), where δv is the channel spacing of the velocity, and ∆v is the FWHM.
Dfrac(HCO+) was derived for 113 components from 112 sources, including two velocity components in G206.10-15.7, ranging from 0.89% to 7.4% with a median of 3.1%. Dfrac(HCN) was derived for 11 sources, ranging from 1.5% to 5.5% with a median of 2.3%. Four of the 9 sources with both Dfrac(HCO+) and Dfrac(HCN) values show Dfrac(HCO+) greater than Dfrac (HCN), and the remaining 5 sources show the opposite (see Figure 6).
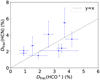 |
Fig. 6 Dfrac(HCO+) vs. Dfrac(HCN) for nine sources with both deuterated fractions. |
3.5 FWHMs of DCO+ and H13CO+ 1−0
Of the 250 sources observed using the high-velocity resolution mode (AROWS mode 13), the number distributions of the FWHM of DCO+ and H13CO+ 1−0 in 46 sources with detections of both molecules are shown in the top of Figure 7. The FWHMs of these detections are mainly below 1 km s−1, and the peak at 0.3−0.4 km s−1 corresponds to 11 and 12 out of 46 detections for DCO+ and H13CO+, respectively. The number distributions of FWHM of DCO+ and H13CO+ 1−0 in the 12 sources for which only DCO+ 1−0 was detected and the 11 sources for which only H13CO+ 1−0 was detected are shown in the bottom panle of Figure 7. The FWHM of the sources with single detections shows no significant difference compared to those for which DCO+ and H13CO+ 1−0 are both detected. A comparison of the FWHMs between DCO+ and H13CO+ is shown in Figure 8, which demonstrates that the line widths are roughly similar within the error bars, with DCO+ 1−0 having a slightly larger line width than H13CO+ 1−0. Figure 9 displays the comparisons between FWHM of DCO+ and Dfrac(HCO+) and between FWHM of H13CO+ and Dfrac(HCO+), without a clear trend. The FWHM of DCO+ 1−0 seems to be larger than that of H13CO+ 1−0 in sources with Dfrac greater than 5%. However, it is hard to conclude clearly for these differences because the signal-to-noise ratios of H13CO+ 1−0 are too low in these sources.
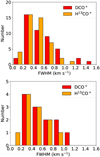 |
Fig. 7 Top: distributions of FWHM for DCO+ (red bars) and H13CO+ (orange bars) 1−0 in 46 sources where DCO+ and H13CO+ 1−0 were detected using the high-velocity resolution mode (AROWS mode 13). Bottom: distribution of FWHM of DCO+ in sources for which only DCO+ 1−0 was detected (red bars) and distribution of FWHM of H13CO+ in sources for which only H13CO+ 1−0 was detected (orange bars). |
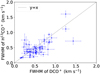 |
Fig. 8 FWHM of DCO+ 1−0 vs. H13CO+ 1−0 of 46 sources in which both lines were detected with the high-velocity resolution mode (AROWS mode 13). |
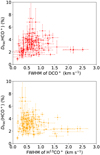 |
Fig. 9 Top: comparison between the FWHM of DCO+ and Dfrac(HCO+). Bottom: comparison between the FWHM of H13CO+ and Dfrac(HCO+). Each plot contains 113 data points. |
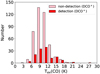 |
Fig. 10 Distribution of Tex(CO) in sources where DCO+ 1−0 is detected (red bars) and where it is not detected (pink bars). |
4 Discussion
4.1 Properties of these Planck cold clumps with and without a DCO+ 1−0 detection
In order to determine whether the properties of sources with DCO+ 1−0 detections differ from those without detections, the distributions of Tex(CO) and W(HCO+) for sources with and without DCO+ 1−0 detections are provided. The W(HCO+) data are from Yuan et al. (2016). The distributions of Tex(CO) for sources with and without a DCO+ 1−0 detection are similar, as shown in Figure 10. The Tex (CO)s of these Planck cold clumps are below 30 K. They mainly range from 7 to 12 K. The distributions of W(HCO+) for sources with and without a DCO+ 1−0 detection are also similar (see Figure 11). The detection rates of DCO+ 1−0 are slightly higher in sources with higher W(HCO+) than in those with lower W(HCO+). The similarity of distributions suggests that the detection or nondetection status of DCO+ 1−0 is not limited by Tex(CO) and W(HCO+).
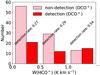 |
Fig. 11 Distribution of W(HCO+) in sources where DCO+ 1−0 is detected (red bars) and where it is not detected (pink bars). |
4.2 Possible reason for the different detection rates and similar Dfracs of HCO+ and HCN in Planck cold clumps
The detection rates for DCO+ and H13CO+ 1−0 are 24.5% and 22.8%, respectively, whereas those for DCN and H13CN 1–0 are 3.6% and 5.2%. This indicates that both the deuterated and13 C-isotopolog counterparts of HCO+ are detected more frequently than their HCN counterparts. The higher detection rates of DCO+ compared to DCN 1−0 are consistent with the studies of 70 µm dark high-mass clumps (Li et al. 2022a) and massive starless clump candidates (Yang et al. 2024).
The Dfrac(HCO+) values in 112 sources range from 0.89% to 7.4% with a median value of 3.1%, and the Dfrac(HCN) values in 11 sources range from 1.5% to 5.5% with a median value of 2.3%. These values do not show a significant difference between the two molecular pairs. The Dfrac values are consistent with those observed in molecular clouds (e.g., Hollis et al. 1976), low-mass starless cores (e.g., Tafalla et al. 2006), and massive starless clump candidates (e.g., Yang et al. 2024). Four of the nine sources where both Dfrac(HCO+) and Dfrac(HCN) were estimated show Dfrac(HCO+) greater than Dfrac (HCN), and the remaining five sources show the opposite (see Figure 6). Therefore, the significantly lower detection rate of DCN 1–0 compared to DCO+ 1−0, despite similar noise levels, cannot be attributed to differences in Dfrac values.
The deuterium fractionation is generally regarded as starting from the molecule-ion reaction primarily at temperature below 30 K. At these low temperatures, the reaction  (where ∆E = 232 K) proceeds forward, enhancing the abundance of H2D+, which is a precursor of many deuterated molecules (Millar et al. 1989). DCO+ is thought to form in the gas phase and to be abundant below ∼30 K, while DCN is thought to form through multiple pathways in the interstellar medium, and its abundance peaks at higher temperatures than DCO+ (Millar et al. 1989). Consequently, deuterated molecules are often used as chemical clocks to trace the evolutionary stages during star formation (Fuente et al. 2005; Busquet et al. 2010; Fontani et al. 2014; Sakai et al. 2022). For example, Kim et al. (2020) suggested that the detection rates of deuterated molecules signify chemical evolutionary stages, while the Dfrac s should be used for this study.
Because of the similar Dfrac values for HCO+ and HCN in Planck cold clumps, we propose that the disparity in the detection rates between DCO+ and DCN 1−0 is primarily due to differences in their critical densities. This explanation was also suggested for massive starless clump candidates (Yang et al. 2024). When we ignore the background emission, the optically thin critical density can be approximated by  , where Ajk (s−1) is the Einstein A, and γjk (cm3 s−1) is collision rate out of the upper level j to the level k (Shirley 2015). At 10 K, the critical densities for DCO+ and DCN 1−0 are 3.2 × 10⁴ and 2.6 × 105 cm−3 (Feng et al. 2020) , and those for H13CO+ and H13CN 1−0 are 6.2 × 10⁴ and 5.3 × 105 cm−3 (Shirley 2015). Although the Ajk values for DCO+ and DCN 1–0 are similar, γjk related to the collision cross section for collisions with H2 for DCO+ (a molecular ion) is larger than DCN (a neutral molecule), resulting in a critical density for DCO+ that is lower by an order of magnitude than DCN (Shirley 2015). This also holds for H13CO+ and H13CN as well as for DCO+ and DCN.
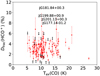 |
Fig. 12 Comparison of Tex and Dfrac (HCO+) (red points), including the 3σ upper and lower limit value of Dfrac(HCO+) (red points and arrows) for sources with only H13 CO+ and only DCO+ detections, respectively. |
4.3 Origin of the deuterium fractionation
The comparison between Tex(CO) and Dfrac (HCO+) shows no trend, including the upper and lower limits of Dfrac (HCO+) (see Figure 12). Most upper and lower limits of Dfrac (HCO+) fall within the expected ranges, suggesting that most sources with detections of only DCO+ or H13 CO+ do not exhibit significantly different properties compared to sources with both detections. The small range of Tex(CO)s for these sources makes it challenging to discuss a relation between Tex (CO) and the deuterium fractionation. Observations of the deuterium fractionation in late stages of star-forming regions are needed for further study. Chemical models suggest that deuterated molecules can be destroyed in hot molecular gas (Millar et al. 1989; Hatchell et al. 1998). Observations suggest that in hot cores, Dfrac(HCN) generally decreases from off-core to on-core positions, where temperatures vary significantly (Hatchell et al. 1998).
Twelve of the observed sources exhibit lower limits of Dfrac(HCO+), with only DCO+ 1–0 detections, possibly due to the lower critical density of 3.2 × 104 cm−3 for DCO+ 1−0 compared to 6.2 × 104 cm−3 for H13CO+ 1−0 at 10 K (Shirley 2015; Feng et al. 2020). Four of these 12 sources exhibit particularly high Dfrac values, namely G177.14-01.2, G181.84+00.3, G199.88+00.9, and G201.13+00.3 (see Figure 12). They deserve further study.
Conversely, 11 sources have upper limits of Dfrac(HCO+), with only H13CO+ 1–0 detections, corresponding to low Dfrac values. No significant differences in the number distributions of Tex(CO) are found between sources with only DCO+ 1–0 detections, only H13CO+ 1–0 detections, and those with both detections (see Figure 12). The FWHM number distributions for sources with only DCO+ 1–0 detections, only H13CO+ 1–0 detections, and both detections show no significant differences, and the FWHMs are mainly within 1 km s−1 (see Figure 7). It was suggested that Dfrac may decrease with increasing microturbulent velocity fields (Gerner et al. 2015; Li et al. 2022b). However, our results do not reveal any trend between the Dfrac and line widths for either DCO+ or H13CO+ 1–0 (see Figure 9). The limited range of the FWHMs for these emission lines in Planck cold clumps makes it difficult to discuss the relation between Dfrac and FWHM.
The deuterium chemistry suggests that the deuterium fractionation starts during the pre-collapse phase of the molecular cloud evolution, when the gas becomes cold (T ~10 K) and dense (n ≥ 104 cm−3) (Roberts & Millar 2000; Ceccarelli et al. 2001; Roberts & Millar 2007). This mechanism was used to explain the high Dfrac observed in cold molecular cores (Ceccarelli et al. 2001; Caselli et al. 2003). According to this framework, in the early stages of cold-core formation (T ~ 15-20 K, n ~104 cm−3), Dfrac would remain too low (~10−4–10−3) to produce detectable DCO+ 1–0, while H13CO+ 1–0 could be detected. However, among our 250 observed sources using the high-velocity resolution mode (AROWS mode 13), DCO+ and H13CO+ 1–0 are detected in 58 and 57 sources with similar detection rates of 23.2% and 22.8%, respectively. More importantly, there are 46 sources with both DCO+ and H13CO+ 1–0 detections. DCO+ and H13CO+ 1–0 emissions are detected almost simultaneously in the same sources. These results indicate that DCO+ can already be widespread in cold molecular clouds, rather than just beginning to become abundant. Thus, the phenomenon of high Dfrac observed in cold cores may not necessarily be explained by cold-core deuterium chemistry.
Moreover, the Dfrac values for HCO+ and HCN, reflecting the enhancement of deuterium for these two species, are similar. They range from 0.89% to 7.4% and 1.5% to 5.5%, respectively. The detection rates of DCN and H13CN 1–0 of 3.6% and 5.2%, respectively, are significantly lower than those of DCO+ and H13CO+ 1–0 of 24.5% and 22.8%, respectively. This might due to the higher critical densities of DCN and H13 CN 1–0 compared to those of DCO+ and H13CO+ 1–0, respectively. Thus, perhaps because the volume density is not high enough to excite DCO+ and DCN to the J = 1 energy level, the DCO+ and DCN lines cannot be detected in diffuse gas. The method for testing the origin of DCO+ and DCN in diffuse molecular clouds is to observe the DCO+ and DCN absorption lines toward diffuse molecular clouds with background quasar-emitting millimeterwave continuum sources. The differences in Dfrac during the evolution of molecular clouds and late stages of star formation are caused by the synthesis and depletion of deuterated molecules in different physical conditions. Thus, a comparison with large-sample surveys of deuterated molecular lines toward hot molecular cores at late stages of star formation, as well as updated astro-chemical models for these deuterated molecules, is needed to fully understand the enhancement of deuterium in molecular clouds.
5 Summary
With the aim to understand the enhancement of deuterated molecules from diffuse molecular gas to cold cores, we conducted a single-pointing survey toward 559 Planck cold clumps of ECC for DCO+ and DCN 1–0 using the ARO 12m telescope. This included observations of 309 cores for DCO+ and DCN 1– 0 simultaneously, followed by 71 of these cores in which DCO+ 1–0 was detected for H13CO+ and H13CN 1–0 simultaneously, with the aim to determine Dfrac . Additionally, 250 cores were observed for DCO+, DCN, H13CO+, andH13CN 1–0 simultaneously. The observed parameters, including W, VLSR, and FWHM, were presented. The detection rates and Dfrac for HCO+ and HCN were also presented. Potential reasons for the different detection rates and the similar Dfrac for HCO+ and HCN in Planck cold clumps were discussed. The main results of this survey are listed below:
DCO+ and DCN 1–0 were detected in 79 and 11 out of 309 sources with the low-velocity resolution mode (AROWS mode 3), which gives detection rates of 25.6% and 3.6%, respectively. DCO+, DCN, H13CO+, and H13CN 1–0 were detected in 58, 9, 57, and 13 out of 250 sources with the highvelocity resolution mode (AROWS mode 13), which gives detection rates of 23.2%, 3.6%, 22.8%, and 5.2%, respectively. Overall, DCO+ and DCN 1–0 were detected in 137 and 20 out of 559 sources, with detection rates of 24.5% and 3.6%, respectively, with about 6 minutes of telescope time for each source;
The Dfrac(HCO+) values in 112 sources range from 0.89% to 7.4%, with a median value of 3.1%, and the Dfrac(HCN) values in 11 sources range from 1.5% to 5.5%, with a median value of 2.3%;
The line widths (FWHMs) of the DCO+ and H13CO+ 1–0 detections are mainly distributed within 1 km s−1 , and most measurements fall between 0.3 and 0.4 km s−1;
The similar Dfrac values for DCO+ and DCN suggest that the higher detection rate of DCO+ compared to DCN is due to the lower critical density of DCO+ ;
The nearly simultaneous detections of DCO+ and H13CO+ 1–0 in the same sources suggest that deuterium fractionation may start during diffuse molecular gas phase prior to coldcore formation.
Data availability
Tables A.1 to A.6, B.1, E.1 and E.2 are only available in electronic form at the CDS via anonymous ftp to cdsarc.cds.unistra.fr (130.79.128.5) or via https://cdsarc.cds.unistra.fr/viz-bin/cat/J/A+A/696/A140. More information about DCO+, DCN, H13CO+ and H13CN 1–0 lines from our sample in Appendix D is available on Zenodo under the following link: https://zenodo.org/records/15013446
Acknowledgements
We would like to acknowledge the help of the staff of the ARO 12-m for assistance with the observations. This work is supported by National Key R&D Program of China under grant 2023YFA1608204, the National Natural Science Foundation of China (NSFC) grant 12173067 and the Guangxi Talent Programme (Highland of Innovation Talents). S.L. is supported by NSFC grant 11988101.
Appendix A Detection statuses and parameters of spectral lines
Sources with detection of DCO+, DCN, H13CO+ or H13CN.
Parameters of detected DCO+ 1-0.
Parameters of detected DCN 1-0.
Parameters of detected H13CO+ 1-0
Parameters of detected H13CN 1-0.
Dfrac(HCO+) and Dfrac(HCN).
Appendix B High spectral resolution supplementary observations with AROWS mode 5
As described in Sect. 2, high spectral resolution supplementary observations with AROWS mode 5 were conducted for DCO+ 1-0 narrow lines toward 32 sources. The fluxes of DCO+ 1-0 observed with the high-velocity resolution mode (AROWS mode 5) are similar to those observed with the low velocity resolution mode (AROWS mode 3) (see Table B.1).
The FWHMs of DCO+ 1-0 using the high-velocity resolution mode (AROWS mode 5) are compared with those using the low velocity resolution mode (AROWS mode 3) in Fig. B.1, showing similar values within the error bars. Therefore, even though the FWHMs from low spectral resolution observations may not be precise, they are still useful as a reference.
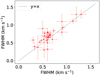 |
Fig. B.1 Comparison between FWHM of DCO+ with velocity resolution ~0.081 km s−1 with mode 5 and FWHM of DCO+ with velocity resolution ~0.32 km s−1 with mode 3. There are 32 points in the plot. |
High spectral resolution DCO+ 1-0 observed with the high-velocity resolution mode (AROWS mode 5).
Appendix C The relationships of the kinematic distances of sources and detection results
To determine whether DCO+ 1-0 detection is limited by distance, the distributions of kinematic distances for sources with and without DCO+ 1-0 detections are shown in Fig. C.1. To reduce uncertainty in kinematic distances, sources located at galactic longitudes 0º±l5º and 90º±l5º, as well as those with a galactic scale height greater than 1 kpc, were excluded. Among the observed sources, the kinematic distances for 378 sources that meet the coordinate requirements are from Wu et al. (2012). The kinematic distances of these sources, regardless of DCO+ 1-0 detection, show a similar distribution (see Fig. C.1). The kinematic distances of 82 sources with DCO+ 1-0 detections range from 0.11 to 5.75 kpc, with a mean of 1.08 kpc and a median value of 0.81 kpc. For the 296 sources without DCO+ 1-0 detections, kinematic distances range from 0.10 to 5.42 kpc, with a mean of 1.11 kpc and a median value of 1.01 kpc. The kinematic distances of sources with and without detections show similar distributions, means, and medians, which rules out the effect of beam dilution on the detection or non-detection status.
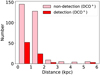 |
Fig. C.1 Distribution of kinematic distance of sources where DCO+ 1-0 is detected or not. |
Appendix D The spectral lines of DCO+, DCN, H13CO+, and H13CN 1-0
The spectra of deuterated molecules (black lines) and the spectra of13 C–isotopologue counterparts (red lines) are presented in Figs. D.1 to D13, grouped by HCO+ and HCN respectively.
Figures D.1 to D3 show the spectral lines of DCO+ 1-0. Figure D.1 displays the spectra for 8 sources where DCO+ 1-0 was detected using the low velocity resolution mode (AROWS mode 3), but H13CO+ 1-0 was not observed. Figure D2 presents spectra for 5 sources with DCO+ 1-0 detections and no H13CO+ 1-0 detections using the low velocity resolution mode (AROWS mode 3). Figure D3 shows spectra for 12 sources with DCO+ 1-0 detections and no H13 CO+ 1-0 detections using the high-velocity resolution mode (AROWS mode 13).
Figures 4~6 show the spectral lines of DCN 1-0. Figure 4 shows spectra for 2 sources with DCN 1-0 detection and no H13CN 1-0 observation using the low velocity resolution mode (AROWS mode 3). Figure 5 shows spectra for 5 sources with DCN 1-0 detections but without H13CN 1-0 detections using the low velocity resolution mode (AROWS mode 3). Figure 6 presents spectra for 2 sources with DCN 1-0 detections and no H13CN 1-0 detections using the high-velocity resolution mode (AROWS mode 13).
Figure D7 displays the spectral lines of H13CO+ 1-0, with 11 sources showing H13CO+ 1-0 detections but without DCO+ 1-0 detections with the high-velocity resolution mode (AROWS mode 13).
Figures D8 and D9 show the spectral lines of H13CN 1- 0. Figure D8 shows spectra for 16 sources with H13CN 1-0 detections but no DCO+ 1-0 detections using the low velocity resolution mode (AROWS mode 3). Figure D9 shows spectra for 6 sources with H13CN 1-0 detections and no DCN 1-0 detections using the high-velocity resolution mode (AROWS mode 13).
Figures D10 and D11 show the spectral lines of both DCO+ and H13CO+ 1-0. Figure D10 shows spectra for 66 sources with detections of both DCO+ and H13CO+ 1-0 using the low velocity resolution mode (AROWS mode 3). Figure D11 displays spectra for 46 sources with detections of both species using the highvelocity resolution mode (AROWS mode 13). Due to errors in the Doppler tracking with mode 13, H13 CO+ 1-0 lines were manually aligned with DCO+ 1-0 lines in Figure D11.
Figures D12 and D13 show the spectral lines of DCN and H13CN 1-0. Figure D12 includes spectra for 4 sources with both DCN and H13CN 1-0 detections using the low velocity resolution mode (AROWS mode 3). Figure D13 presents spectra for 7 sources with both detections using the high-velocity resolution mode (AROWS mode 13). Due to errors in the Doppler tracking with mode 13, H13CN 1-0 lines were manually aligned with DCN 1-0 lines in Figure D13.
 |
Fig. D.1 Line profiles of DCO+ 1-0 with the low velocity resolution mode (AROWS mode 3). The transitions of H13CO+ 1-0 have not been observed in these sources. Additional Figures D1∼D13 are available on Zenodo. https://zenodo.org/records/15013446 |
Appendix E The sources without any detection
A total of 228 sources were observed for DCO+ and DCN 1- 0 using the low velocity resolution mode (AROWS mode 3), with no detections of either molecule. The details for these 228 sources, including name, R.A., and Decl., are provided in Table E.1. Additionally, Table E.2 lists details for 180 sources observed with the high-velocity resolution mode (AROWS mode 13) that showed no detection of DCO+, DCN, H13CO+, or H13CN 1-0.
228 sources without DCO+ or DCN 1-0 detection with the low velocity resolution mode (AROWS mode 3).
180 sources without DCO+, DCN, H13CO+ and H13CN 1-0 detection with the high-velocity resolution mode (AROWS mode 13).
References
- Busquet, G., Palau, A., Estalella, R., et al. 2010, A&A, 517, L6 [NASA ADS] [CrossRef] [EDP Sciences] [Google Scholar]
- Caselli, P. 2002, Planet. Space Sci., 50, 1133 [NASA ADS] [CrossRef] [Google Scholar]
- Caselli, P., van der Tak, F. F. S., Ceccarelli, C., et al. 2003, A&A, 403, L37 [CrossRef] [EDP Sciences] [Google Scholar]
- Ceccarelli, C., Loinard, L., Castets, A., et al. 2001, A&A, 372, 998 [NASA ADS] [CrossRef] [EDP Sciences] [Google Scholar]
- Crapsi, A., Caselli, P., Walmsley, C. M., et al. 2005, ApJ, 619, 379 [Google Scholar]
- Feng, S., Li, D., Caselli, P., et al. 2020, ApJ, 901, 145 [Google Scholar]
- Fontani, F., Caselli, P., Crapsi, A., et al. 2006, A&A, 460, 709 [NASA ADS] [CrossRef] [EDP Sciences] [Google Scholar]
- Fontani, F., Palau, A., Caselli, P., et al. 2011, A&A, 529, L7 [NASA ADS] [CrossRef] [EDP Sciences] [Google Scholar]
- Fontani, F., Sakai, T., Furuya, K., et al. 2014, MNRAS, 440, 448 [NASA ADS] [CrossRef] [Google Scholar]
- Fuente, A., Rizzo, J. R., Caselli, P., et al. 2005, A&A, 433, 535 [NASA ADS] [CrossRef] [EDP Sciences] [Google Scholar]
- Gerner, T., Shirley, Y. L., Beuther, H., et al. 2015, A&A, 579, A80 [NASA ADS] [CrossRef] [EDP Sciences] [Google Scholar]
- Guilloteau, S., Piétu, V., Dutrey, A., et al. 2006, A&A, 448, L5 [NASA ADS] [CrossRef] [EDP Sciences] [Google Scholar]
- Hatchell, J., Millar, T. J., & Rodgers, S. D. 1998, A&A, 332, 695 [NASA ADS] [Google Scholar]
- Herbst, E. 1982, A&A, 111, 76 [NASA ADS] [Google Scholar]
- Hirota, T., Ikeda, M., & Yamamoto, S. 2001, ApJ, 547, 814 [NASA ADS] [CrossRef] [Google Scholar]
- Hollis, J. M., Snyder, L. E., Lovas, F. J., et al. 1976, ApJ, 209, L83 [NASA ADS] [CrossRef] [Google Scholar]
- Jefferts, K. B., Penzias, A. A., & Wilson, R. W. 1973, ApJ, 179, L57 [NASA ADS] [CrossRef] [Google Scholar]
- Kim, G., Tatematsu, K., Liu, T., et al. 2020, ApJS, 249, 33 [CrossRef] [Google Scholar]
- Li, S., Sanhueza, P., Lu, X., et al. 2022a, ApJ, 939, 102 [CrossRef] [Google Scholar]
- Li, Y., Wang, J., Li, J., et al. 2022b, MNRAS, 512, 4934 [NASA ADS] [CrossRef] [Google Scholar]
- Milam, S. N., Savage, C., Brewster, M. A., et al. 2005, ApJ, 634, 1126 [Google Scholar]
- Millar, T. J., Bennett, A., & Herbst, E. 1989, ApJ, 340, 906 [NASA ADS] [CrossRef] [Google Scholar]
- Pillai, T., Wyrowski, F., Hatchell, J., et al. 2007, A&A, 467, 207 [NASA ADS] [CrossRef] [EDP Sciences] [Google Scholar]
- Pillai, T., Kauffmann, J., Wyrowski, F., et al. 2011, A&A, 530, A118 [CrossRef] [EDP Sciences] [Google Scholar]
- Planck Collaboration XXVIII. 2016, A&A, 594, A28 [NASA ADS] [CrossRef] [EDP Sciences] [Google Scholar]
- Reid, M. J., Menten, K. M., Brunthaler, A., et al. 2019, ApJ, 885, 131 [Google Scholar]
- Roberts, H., & Millar, T. J. 2000, A&A, 361, 388 [NASA ADS] [Google Scholar]
- Roberts, H., & Millar, T. J. 2007, A&A, 471, 849 [NASA ADS] [CrossRef] [EDP Sciences] [Google Scholar]
- Roberts, H., Fuller, G. A., Millar, T. J., et al. 2002, A&A, 381, 1026 [CrossRef] [EDP Sciences] [Google Scholar]
- Roueff, E., Lis, D. C., van der Tak, F. F. S., et al. 2005, A&A, 438, 585 [NASA ADS] [CrossRef] [EDP Sciences] [Google Scholar]
- Sakai, T., Sanhueza, P., Furuya, K., et al. 2022, ApJ, 925, 144 [NASA ADS] [CrossRef] [Google Scholar]
- Schilke, P., Walmsley, C. M., Pineau Des Forets, G., et al. 1992, A&A, 256, 595 [Google Scholar]
- Shirley, Y. L. 2015, PASP, 127, 299 [Google Scholar]
- Snell, R. L., & Wootten, H. A. 1977, ApJ, 216, L111 [NASA ADS] [CrossRef] [Google Scholar]
- Snyder, L. E., Hollis, J. M., Buhl, D., et al. 1977, ApJ, 218, L61 [NASA ADS] [CrossRef] [Google Scholar]
- Tafalla, M., Santiago-García, J., Myers, P. C., et al. 2006, A&A, 455, 577 [NASA ADS] [CrossRef] [EDP Sciences] [Google Scholar]
- Tiné, S., Roueff, E., Falgarone, E., et al. 2000, A&A, 356, 1039 [Google Scholar]
- Turner, B. E. 2001, ApJS, 136, 579 [Google Scholar]
- Turner, B. E., Zuckerman, B., Morris, M., et al. 1978, ApJ, 219, L43 [NASA ADS] [CrossRef] [Google Scholar]
- van der Tak, F. F. S., M’uller, H. S. P., Harding, M. E., et al. 2009, A&A, 507, 347 [NASA ADS] [CrossRef] [EDP Sciences] [Google Scholar]
- Watson, W. D. 1973, ApJ, 181, L129 [NASA ADS] [CrossRef] [Google Scholar]
- Watson, W. D., Crutcher, R. M., & Dickel, J. R. 1975, ApJ, 201, 102 [NASA ADS] [CrossRef] [Google Scholar]
- Wu, Y., Liu, T., Meng, F., et al. 2012, ApJ, 756, 76 [CrossRef] [Google Scholar]
- Yang, K., Wang, J., Qiu, K., et al. 2024, ApJS, 270, 35 [NASA ADS] [CrossRef] [Google Scholar]
- Yuan, J., et al. 2016. VizieR Online Data Catalog: J/ApJ/820/37 [Google Scholar]
All Tables
High spectral resolution DCO+ 1-0 observed with the high-velocity resolution mode (AROWS mode 5).
228 sources without DCO+ or DCN 1-0 detection with the low velocity resolution mode (AROWS mode 3).
180 sources without DCO+, DCN, H13CO+ and H13CN 1-0 detection with the high-velocity resolution mode (AROWS mode 13).
All Figures
|
Fig. 1 Spectral lines of DCO+ and DCN 1−0 (black line) overlaid with the Gaussian fitting results (green line) toward G091.73+04.3, as observed in 2020 using the low-velocity resolution mode (AROWS mode 3) with a velocity resolution of ~0.32 km s−1. The hyperfine components of DCN 1−0 are visible. |
| In the text | |
|
Fig. 2 Spectral lines of DCO+ and DCN 1−0 (black line) overlaid with the Gaussian fitting results (green line) toward G159.21-20.1, as observed in 2023 using the high-velocity resolution mode (AROWS mode 13) with a velocity resolution of ~0.081 km s−1. The hyperfine components of DCN 1−0 are visible. |
| In the text | |
|
Fig. 3 Distribution of W(DCO+) (red bars) and W(DCN) (blue bars). |
| In the text | |
|
Fig. 4 Spectral lines of DCO+ and H13CO+ 1−0 (black line) overlaid with the Gaussian fitting results (green line) toward G206.10-15.7. Double-velocity components in DCO+ and H13CO+ 1−0 were detected. |
| In the text | |
|
Fig. 5 Distribution of W(H13CO+) (orange bars) and W(H13CN) (green bars). |
| In the text | |
|
Fig. 6 Dfrac(HCO+) vs. Dfrac(HCN) for nine sources with both deuterated fractions. |
| In the text | |
|
Fig. 7 Top: distributions of FWHM for DCO+ (red bars) and H13CO+ (orange bars) 1−0 in 46 sources where DCO+ and H13CO+ 1−0 were detected using the high-velocity resolution mode (AROWS mode 13). Bottom: distribution of FWHM of DCO+ in sources for which only DCO+ 1−0 was detected (red bars) and distribution of FWHM of H13CO+ in sources for which only H13CO+ 1−0 was detected (orange bars). |
| In the text | |
|
Fig. 8 FWHM of DCO+ 1−0 vs. H13CO+ 1−0 of 46 sources in which both lines were detected with the high-velocity resolution mode (AROWS mode 13). |
| In the text | |
|
Fig. 9 Top: comparison between the FWHM of DCO+ and Dfrac(HCO+). Bottom: comparison between the FWHM of H13CO+ and Dfrac(HCO+). Each plot contains 113 data points. |
| In the text | |
|
Fig. 10 Distribution of Tex(CO) in sources where DCO+ 1−0 is detected (red bars) and where it is not detected (pink bars). |
| In the text | |
|
Fig. 11 Distribution of W(HCO+) in sources where DCO+ 1−0 is detected (red bars) and where it is not detected (pink bars). |
| In the text | |
|
Fig. 12 Comparison of Tex and Dfrac (HCO+) (red points), including the 3σ upper and lower limit value of Dfrac(HCO+) (red points and arrows) for sources with only H13 CO+ and only DCO+ detections, respectively. |
| In the text | |
|
Fig. B.1 Comparison between FWHM of DCO+ with velocity resolution ~0.081 km s−1 with mode 5 and FWHM of DCO+ with velocity resolution ~0.32 km s−1 with mode 3. There are 32 points in the plot. |
| In the text | |
|
Fig. C.1 Distribution of kinematic distance of sources where DCO+ 1-0 is detected or not. |
| In the text | |
|
Fig. D.1 Line profiles of DCO+ 1-0 with the low velocity resolution mode (AROWS mode 3). The transitions of H13CO+ 1-0 have not been observed in these sources. Additional Figures D1∼D13 are available on Zenodo. https://zenodo.org/records/15013446 |
| In the text | |
Current usage metrics show cumulative count of Article Views (full-text article views including HTML views, PDF and ePub downloads, according to the available data) and Abstracts Views on Vision4Press platform.
Data correspond to usage on the plateform after 2015. The current usage metrics is available 48-96 hours after online publication and is updated daily on week days.
Initial download of the metrics may take a while.