| Issue |
A&A
Volume 693, January 2025
|
|
|---|---|---|
| Article Number | A65 | |
| Number of page(s) | 13 | |
| Section | Extragalactic astronomy | |
| DOI | https://doi.org/10.1051/0004-6361/202452456 | |
| Published online | 03 January 2025 | |
First detection of a deuterated molecule in a starburst environment within NGC 253
1
Leiden Observatory, Leiden University, PO Box 9513 NL-2300 RA Leiden, The Netherlands
2
European Southern Observatory, Alonso de Córdova, 3107, Vitacura, Santiago, 763-0355, Chile
3
Joint ALMA Observatory, Alonso de Córdova, 3107, Vitacura, Santiago, 763-0355, Chile
4
Centro de Astrobiología (CAB, CSIC-INTA), Ctra. de Torrejón a Ajalvir km 4, 28850 Torrejón de Ardoz, Madrid, Spain
5
Transdisciplinary Research Area (TRA) ‘Matter’/Argelander-Institut für Astronomie, University of Bonn, Bonn, Germany
6
Physics and Astronomy, University College London, London, UK
7
Elsevier, Radarweg 29, 1043 NX Amsterdam, The Netherlands
8
Istituto Nazionale di Astrofisica (INAF), Osservatorio Astrofisico di Arcetri, Florence, Italy
9
Max-Planck-Institute for Extraterrestrial Physics (MPE), Garching bei München, Germany
10
Laboratoire d’Études du Rayonnement et de la Matière en Astrophysique et Atmosphères (LERMA), Observatoire de Paris, Meudon, France
11
National Astronomical Observatory of Japan, 2-21-1 Osawa, Mitaka, Tokyo, 181-8588, Japan
12
Institute of Astronomy and Astrophysics, Academia Sinica, 11F of AS/NTU Astronomy-Mathematics Building, No. 1, Sec. 4, Roosevelt Rd, Taipei, 10617, Taiwan
13
Department of Astronomy, School of Science, The Graduate University for Advanced Studies (SOKENDAI), 2-21-1 Osawa, Mitaka, Tokyo, 181-1855, Japan
14
Max-Planck-Institut für Radioastronomie, Auf-dem-Hügel 69, 53121 Bonn, Germany
15
Xinjiang Astronomical Observatory, Chinese Academy of Sciences, 830011 Urumqi, China
⋆ Corresponding author; This email address is being protected from spambots. You need JavaScript enabled to view it.
Received:
1
October
2024
Accepted:
28
November
2024
Abstract
Context. Deuterium was primarily created during the Big Bang nucleosynthesis. This fact, alongside its fractionation reactions resulting in enhanced abundances of deuterated molecules, means that deuterium abundances can be used to better understand many processes within the interstellar medium as well as its history. Previously, observations of deuterated molecules have been limited to the Galaxy, the Magellanic Clouds, and (with respect to HD) to quasar absorption spectra.
Aims. We present the first robust detection of a deuterated molecule in a starburst environment and, apart from HD, the first one detected outside the Local Group. As such, we could constrain the deuterium fractionation as observed by DCN.
Methods. We observed the central molecular zone (CMZ) of the nearby starburst galaxy NGC 253 covering multiple giant molecular clouds (GMCs) with cloud scale observations (∼30 pc) using the Atacama Large Millimeter/submillimeter Array. Via the MADCUBA package, we were able to perform local thermodynamic equilibrium analysis in order to obtain deuterium fractionation estimates.
Results. We detected DCN in the nuclear region of the starburst galaxy NGC 253 and estimated the deuterium fractionation (D/H ratio) of DCN within the GMCs of the CMZ of NGC 253. We found a range of 5 × 10⁻⁴ to 10 × 10−4, which is relatively similar to the values observed in warm galactic star-forming regions. We also determined an upper limit of D/H of 8 × 10⁻⁵ from DCO+ within one region, closer to the cosmic value of D/H.
Conclusions. Our observations of deuterated molecules within NGC 253 appear to be consistent with previous galactic studies of star-forming regions. This implies that warmer gas temperatures increase the abundance of DCN relative to other deuterated species. This study also further expands the regions, particularly in the extragalactic domain, in which deuterated species have been detected.
Key words: astrochemistry / ISM: molecules / galaxies: active / galaxies: ISM / galaxies: starburst
© The Authors 2025
 Open Access article, published by EDP Sciences, under the terms of the Creative Commons Attribution License (https://creativecommons.org/licenses/by/4.0), which permits unrestricted use, distribution, and reproduction in any medium, provided the original work is properly cited.
This article is published in open access under the Subscribe to Open model. This email address is being protected from spambots. You need JavaScript enabled to view it. to support open access publication.
1. Introduction
Deuterium, one of the two stable isotopes of hydrogen, was primarily synthesised during the Big Bang nucleosynthesis, which occurred during the first seconds after the Big Bang (Epstein et al. 1976; Prodanović & Fields 2003; Cyburt et al. 2016). Deuterium has predominantly been observed in the form of molecules in dense galactic star-forming cloud cores, and the abundance of these deuterated molecules with respect to their hydrogenated counterparts (D/H ∼ 10−3 − 10−1; Crapsi et al. 2005; Caselli et al. 2008; Colzi et al. 2022) exceeds by orders of magnitude the [D/H] elemental abundance in the solar neighbourhood (∼10−5; Oliveira et al. 2003). Since stars are not a significant source of deuterium and because deuterium is destroyed in their interior, its abundance (i.e. the D/H ratio) is expected to decrease with cosmic time (Fontani et al. 2011). In fact, the D-abundance observed within molecules has been shown to be enhanced due to ongoing chemical processes (Caselli & Ceccarelli 2012).
Deuterium fractionation can result from the formation processes of different deuterated species, which depend on the physical conditions of a region (Colzi et al. 2018, 2022). This fractionation can then result in a column density ratio between a species containing D and its hydrogenated counterpart (Dfrac) that is higher than the primordial value. As an example, DCN has multiple formation pathways, with the primary pathway (62%) being HD + CH3+ → CH2D+, which then forms CHD and CH2D and subsequently reacts with N to form DCN (Turner 2001). A secondary formation mechanism (22%) of DCN includes the reaction HD + H3+ → H2D+. However, H2D+ is also consumed in the sole formation pathway of the deuterated cations N2D+ and DCO+. These cations are formed most abundantly at low temperatures (T < 20 K), where the ratio of H2D+/H3+ is enhanced (Wootten 1987). Notably, deuterium fractionation (Dfrac) in galactic massive dense cores exhibits values ranging from ∼0.01 to 0.7, substantially exceeding the primordial D/H ratio (Fontani et al. 2011, 2015; Zahorecz et al. 2017). The [D/H] molecular ratio has been shown to decrease with increasing dust temperature in N2D+ and its hydrogenated counterpart by Emprechtinger et al. (2009). Thus, the deuteration fraction represents a powerful tool to estimate the time since massive stars started heating their medium (Fontani et al. 2014). This fraction may probe the degree of processing of the gas by star formation. DCN on the other hand is primarily enhanced in warmer gas (up to ∼70 K. Roueff et al. 2013; Fontani et al. 2015; Gerner et al. 2015). Thus, processes that influence the temperature of an environment, such as shocks, may also affect the deuterium fractionation. This is seen in the deuterium fractionation of DCN/HCN within shocked galactic regions, such as L1157-B1, which are associated with particularly high DCN/HCN abundance ratios (Busquet et al. 2017).
Lyman limit system (LLS) measurements in the line of sight high-z quasars (z ∼ 2.5) indicate a primordial D/H ratio of around 2.55 ± (0.03)×10−5 (Zavarygin et al. 2018). In the Galactic centre, where matter has undergone particularly intense stellar processing, even lower D/H ratios are expected. The Galactic centre also typically possesses high kinetic temperatures (Tkin); thus deuteration is not expected to be efficient. There are two studies that have derived the D/H ratio within the Galactic centre. The first is a study by Lubowich et al. (2000) that identified a deuterium to hydrogen ratio of (D/H ∼ 1.7 × 10⁻⁶) within the Galactic bulge. This value was five orders of magnitude above the value of 5 × 10⁻¹² within the central bulge of the Milky Way, as predicted by nucleosynthesis models within this region. Such enhancement was claimed to result from pristine material feeding the central molecular zone of our Galaxy. Surprisingly, however, measurements in the Galactic centre star-forming regions have [D/H] values of 2 − 4 × 10⁻⁴, as derived from deuterated molecular species (Colzi et al. 2022). In this work, we used the high D/H ratio to pinpoint positions in the Galactic centre where a future generation of stars will form.
Despite extensive studies in the Milky Way, extragalactic investigations of deuterium fractionation remain limited due to observational challenges. Notable exceptions include detections of deuterated molecular hydrogen (HD) in absorption towards damped Lyman-α systems (Ivanchik et al. 2010). There are also reported detections of deuterated species (such as DCO+) towards star-forming regions in the Large Magellanic Cloud (LMC) with an estimated D/H ratio of ∼10−4 (Chin et al. 1996; Heikkilä et al. 1997). However, the information towards even the nearest and brightest galaxies consists of upper limits or tentative detections of DCN towards a couple of sources (Mauersberger et al. 1995). In particular, DCN and N2D+ have been tentatively observed towards the starbursting environment of NGC 253 by Martín et al. (2006). Martín et al. (2006) obtained an upper limit for DCN, DCO+ and a tentative detection of N2D+, resulting in a D/H ratio of < 1 − 4 × 10⁻³ for these molecules at low spatial resolution (∼300 pc).
In this paper, we present the first robust detection of a deuterated molecule in a non-Magellanic Cloud extragalactic starburst environment, the starburst galaxy NGC 253, which (besides HD) is also the first detection of such a molecule outside the Local Group. Hence, we derive for the first time a robust D/H ratio and compare it with both galactic ratios and those observed within the LMC as well as with theoretical models. By examining deuterated species, we seek to uncover clues about the evolutionary state of star-forming regions and the impact of galaxy-scale processes on deuterium enrichment.
2. Observations
We carried out interferometric observations using the Atacama Large Millimeter/submillimeter Array (ALMA) in Cycle 5 during the period between June and August 2018 as part of the project 2017.1.00028.S. The observations were centred at the coordinates αJ2000.0 = 0h 47m 33.182s and δJ2000.0 = −25° 17′ 17.148′′. We used two different spectral setups: one in Band 4 to target the J = 2−1 transitions of the deuterated species DCN, DCO+, and N2D+ and one in Band 5 to target the same transition of the hydrogenated species H13CN, H13CO+, and N2H+ (see Table 1). The information of the observations in each band (date, number of antennas, range of baselines, time on source, rms, system temperatures, and precipitable water vapour) are summarised in Table 2.
Spectroscopy of the deuterated molecular transitions and of their hydrogenated counterparts.
Parameters of the ALMA observations used as part of this study.
The data were calibrated and imaged using standard ALMA calibration scripts of the Common Astronomy Software Applications package (CASA) (CASA Team 2022)1. We used the CASA task tclean, with the auto-multithresh option, which automatically masks regions during the cleaning process. We chose a common beam for all the spectral datacubes on Band 4 and 5 of 1.6′′ × 1.2′′ and PA = 80°. The continuum was substracted in the image plane using the STATCONT2 package (Sánchez-Monge et al. 2017). The expected flux density calibration uncertainty is of 5%, as estimated from recent analysis of calibrators in bands 3 and 6 (Bonato et al. 2018; Remijan et al. 2019, and references therein). The integrated spectral line intensities from our datacubes were extracted using CubeLineMoment3 (Mangum et al. 2019). CubeLineMoment works by extracting integrated intensities for a given list of targeted spectral frequencies by applying a set of spectral and spatial masks (defined by the user). The CubeLineMoment masking process uses a brighter spectral line (typically the main isotopologue line of the same rotational transition) whose velocity structure over the galaxy is most representative of the science target line, which is used as a tracer of the velocity of the inspected gas component. The products of CubeLineMoment are moment 0, 1, and 2 maps in the units chosen by the user, masked below a chosen σ threshold (channel-based).
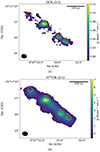 |
Fig. 1. Velocity integrated line intensity moment 0 maps, given in [Jy km s−1 /beam], for the observed DCN (2-1) line (a) alongside the accompanying H13CN (2-1) line (b). Both of these maps are shown with a 3 sigma cut-off. The orange ellipses show the beam-sized regions over which the later analysis of this letter was conducted. |
3. Analysis and results
In this paper we present the first observed spectra of a deuterated species detected within an extragalactic starburst environment. Using observations of deuterated DCN in combination with the hydrogenated isotopologue H13CN, we have computed an estimate of the D/H ratio towards four giant molecular cloud (GMC) regions within the NGC 253 central molecular zone. These GMC regions are based on both continuum and molecular line emission observations previously defined within NGC 253 (e.g. Leroy et al. 2015, 2018; Levy et al. 2022). Specifically, the four innermost GMCs are studied: GMC-4, 5, 6, and 7. The detections of DCN within these regions are provided alongside upper limits of the deuterium fractionation from the deuterated species DCO+ and N2D+. The integrated intensities of each line within each region are shown in Table 3. In Figure 1, we present the velocity integrated line intensity moment 0 maps from DCN (2-1) and H13CN (2-1) obtained via CubeLineMoment. The moment 0 maps of both N2H+ (2-1) and H13CO+ alongside the moment 0 maps of the two HC3N lines used as a part of this study are shown in Appendix B. The ratio map of DCN/H13CN is given in Figure 2.
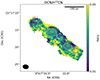 |
Fig. 2. Ratio map of the velocity integrated line intensities of DCN (2-1)/H13CN (2-1). The white contours shown are the 5 sigma limited intensities of DCN (2-1). |
Integrated intensities in [K km s−1] as observed within each of the studied GMC regions.
To conduct our analysis, we used the Spectral Line Identification and Modelling (SLIM) tool within the MADCUBA package (Martín et al. 2019)4, which allowed us to identify and perform multi-transition profile fitting. To accomplish this, SLIM generates a synthetic spectrum, assuming local thermodynamic equilibrium (LTE) conditions, and finds the best non-linear least-squares fit to the data as well as the associated statistical errors. The free parameters to be fitted are the column density of the molecule, Nmol; the excitation temperature, Tex; the peak velocity, vLSR; and the full width at half maximum (FWHM). In this paper, due to being limited to a single line in both DCN and H13CN, the parameter that was left free was the column density Nmol. In order to derive the temperature within each region, we decided to use the serendipitous detection of multiple lines of CH3CCH. CH3CCH is a molecule with a known population dependence on kinetic temperature. As a result of it being a symmetric top molecule, CH3CCH possesses a dipole moment in line with its carbon chain. This means that transitions with ΔK > 0 are forbidden (where k is the projection of the total angular momentum, J, on the rotational axis). Thus, different K-components are connected only via collisional processes, making their relative population sensitive to the kinetic temperature (Fayolle et al. 2015; Calcutt et al. 2019; Ben Khalifa et al. 2024). Due to the complex hyperfine structure of CH3CCH we were able to observe multiple lines of the J = 9–8 and J = 11–10 transitions. The temperatures for each region are given in Table 4. The resulting Tex from CH3CCH has been shown to be a good estimate of the kinetic temperature of the gas at densities of nH ≥ 103 − 4 cm−3 (Askne et al. 1984; Bergin et al. 1994). The source size of each region was assumed to be equal to the beam size, and thus the beam-sized region intensities were extracted. To perform the LTE line fitting, we used the MADCUBA AUTOFIT function, which provides the best solution for the free parameters and their associated errors. Also, H13CN has been found to be optically thin within NGC 253, and thus DCN is likely optically thin, too, at similar regions at similar spatial scales (Butterworth et al. 2024). This was tested in MADCUBA by varying the Tex within the LTE modelling, which had a negligible effect.
To determine the D/H ratios in each region, the column density of H13CN was converted to the column density of the primary isotopologue (HCN) by determining the 12C/13C ratio from the simultaneously observed HC3N and two of its prominent isotopologues: HC13CCN and HCC13CN. The calculated 12C/13C ratios ranged from ∼40–56 across the four regions. These values are on the high end but are relatively consistent with the ratio derived by Martín et al. (2021) using HC3N at 16′′ resolution towards NGC 253; they are also consistent with the 12C/13C ratio obtained by Tang et al. (2019) using ALMA observations of CN and its 13C-bearing isotopologue within NGC 253. Table 4 lists the obtained D/H ratios for each GMC region as indicated by DCN as well as the estimated upper limits for N2D+ and DCO+. DCN (2-1) benefits from not having many nearby lines that would potentially contaminate the detection. Thanks to the broadband spectral scan carried out by ALMA (ALCHEMI, Martín et al. 2021), we can safely confirm the lack of contamination by known species. Of the known lines at the same frequency as DCN (2-1) at the redshift of NGC 253, they are only of either a complex species not previously observed in extragalactic sources or low intensity hyperfine structure lines from species such as CH3OH (Endres et al. 2016). For each of these cases of unknown lines, we can say with some assurance that they do not contaminate the DCN (2-1) detection within our regions. While the low-resolution data published by Martín et al. (2021) does not indicate the presence of DCN, the full spectral modelling of the high-resolution data (Lopez-Gallifa in prep.) shows hints of the emission of DCN in four different transitions from 144 GHz to 362 GHz. The transition reported here is the only one not blended with emission from other species, as shown in Fig. 3. We note that the data presented here are much deeper than those reached in the ALCHEMI data. The spectra of all four GMC regions for all investigated lines are given in Appendix C.
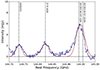 |
Fig. 3. Spectrum of DCN (2-1) observed in the brightest region GMC-6 (in blue). The best-fitting LTE model from MADCUBA is shown overplotted in red. |
The deuterium fractionations for each GMC region.
4. Discussion and conclusions
Observing deuterated species in extragalactic environments is key to understanding deuteration processes within the interstellar medium of galaxies. The degrees of fractionation we observed in DCN/HCN in NGC 253 are consistent with similar galactic central molecular zone (CMZ) studies covering regions of similar kinetic temperatures (e.g. Colzi et al. 2022). In order to properly interpret our results, we compared our observed values and upper limits of D/H with those observed in other sources. In Figure 4, we show how the D/H ratio from column density ratios and the line intensity ratios of DCN (2-1)/H13CN (2-1) compare to the recent galactic D/H ratio obtained from DCN by Colzi et al. (2022). The intensity and column density ratios as shown in Figure 4 generally agree in each of the GMCs. Colzi et al. (2022) observed two components within G+0.693-0.027, a molecular cloud located within the Sgr B2 complex of the Milky Way’s central molecular zone. Using non-LTE radiative transfer modelling, they were able to identify physical conditions of a prestellar component (TK ∼ 30 K) and a broad warm component (TK ∼ 100 K). These components were observed with varying deuterium fractionations, as observed with isotopologues of dense gas tracers such as HCN, HCO+, and HNC. When comparing to the results of Colzi et al. (2022), we observed that GMC-6 is quite comparable to the broad warmer component of G+0.693-0.027. The D/H ratio of (10.3 ± 0.1)×10−4 we observed towards GMC-6 is comparable to the (8.6 − 13)×10−4 observed in G+0.693-0.027’s broad component by Colzi et al. (2022) also using DCN. The broad component of G+0.693-0.027 and the gas component traced by DCN and H13CN, within GMC-6, in this project both also seem to have comparable kinetic temperatures (∼100 K). GMCs −4, −5, and −7 on the other hand each have DCN/HCN fractions (D/H = 5.58 − 6.75 × 10⁻⁴) that lie between what is observed by the cooler prestellar component (D/H ∼ 4 × 10⁻⁴) and by the broad component of G+0.693-0.027, D/H = (8.6 − 13)×10−4. This is consistent with the observed temperatures of these regions (∼60 K, shown in Table 4), which are predicted to be warmer than the cooler prestellar region of G+0.693-0.027 but less warm than the broad warm component. This all implies a similarity between the CMZ of NGC 253 and our own Galaxy. The upper limit D/H ratio as derived from a tentative detection of DCO+ is < 8 × 10⁻⁵ within GMC-4, which is relatively similar to the cosmic value of ∼2 × 10⁻⁵ (Zavarygin et al. 2018). It is also important to note that Colzi et al. (2022) detected similarly low D/H ratios within the broad component of G+0.693-0.027 through N2D+ and DCO+ and their hydrogenated counterparts. When comparing our deuterium fractions to those observed within the LMC using the DCN by Chin et al. (1996), we saw that they appear to be low relative to their ∼2 × 10⁻³. It should be noted that the LMC is a known low-metallicity environment, and thus this may contribute to the relatively high deuterium fraction observed since the LMC gas is less contaminated by stellar processing, negatively affecting the deuterium abundance. Finally, we compared our D/H values to those observed in a shocked region. The shocked molecular outflow region L1157-B1 was observed by Busquet et al. (2017) to have D/H values an order higher than observed within this study at D/H ∼ 4 × 10⁻³. The predicted temperatures of this region of 80 K are also relatively consistent with those predicted for the regions of this study. As can be seen in Figure 4, the observed D/H fraction within this region is significantly higher, implying an enhancement on the deuterium fractionation by shocks.
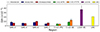 |
Fig. 4. Ratio of D/H obtained through DCN for each region across NGC 253, shown both for the intensity ratio of DCN (2-1)/H13CN (2-1) (in blue) and column density ratio (in red). These observations are shown relative to the prestellar (indicated with ‘PS’) and broad (shown with ‘B’) components of G+0.693-0.027 from Colzi et al. (2022) (C+22, shown in green and orange, respectively), the D/H ratio observed in the shock region L1157-B1 by Busquet et al. (2017) (in purple), and the DCN/HCN ratio observed in the LMC by Chin et al. (1996) (in yellow). |
It was also important to compare our observed D/H ratios to those predicted by appropriate chemical modelling. Figure 5 shows how the range of D/H ratios across the GMC regions compares to previous investigations of this ratio in DCN/HCN using chemical models from Roueff et al. (2007) and Bayet et al. (2010). In theory, the most appropriate model for the conditions of GMCs within the CMZ of NGC 253 would be that of the cosmic-ray enhanced starburst environments (denoted as ‘SB+’) from Bayet et al. (2010), specifically the 106 cm−3 density case (similar to the density derived by Mangum et al. 2019). The ‘SB+’ model is in full agreement with the enhanced cosmic ray ionisation rate towards the central molecular zone of NGC 253 probed by various molecular species (Holdship et al. 2021; Harada et al. 2021; Holdship et al. 2022; Behrens et al. 2022). As can be seen in Figure 5, however, this model significantly overpredicts the DCN/HCN ratio relative to what we have observed. The D/H ratio appears to increase in GMC-6 relative to the other three regions, and this also corresponds to a significantly higher temperature in GMC-6 relative to the other GMCs; a plot showing this trend can be seen in Figure 6. The ‘SB+’ model in Bayet et al. (2010) was run with a temperature of 300 K, which is significantly higher than the temperature range we probed with these observations (∼50–100 K). DCN is favoured to form from HD present in warmer gas, so this may explain the overprediction in the Bayet et al. (2010) models. The models from Roueff et al. (2007) were run using more comparable temperatures (50–70 K), and as can be seen in Figure 5, the warm core model at a density of 106 cm−3 and temperature of 70 K fits very well with our observations, as they also do to the broad component of G+0.693-0.027 studied by Colzi et al. (2022). This may also suggest that the cosmic ray ionisation rate is not important for deuterium fractionation processes.
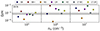 |
Fig. 5. Comparison of LTE analysis predicted column density ranges of DCN/HCN to models shown in Roueff et al. (2007) and Bayet et al. (2010). The term ‘SB’ stands for starburst, ‘SB+’ for cosmic-ray enhanced starburst, ‘NS’ for normal spiral, ‘LM’ for low metallicity, ‘HZ’ for high redshift, and ‘WC’ for warm core. The ‘LT’ (lower temperature) prefix is given to the models from Roueff et al. (2007), as these models were conducted at a significantly lower kinetic temperature (70 K) than the remaining models from Bayet et al. (2010) (> 300 K). The effect of this temperature difference is discussed in the text. The primordial D/H ratio of around 2.55 ± (0.03)×10−5 is presented with a horizontal dashed line (Zavarygin et al. 2018). |
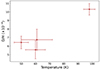 |
Fig. 6. Derived excitation temperatures of DCN from LTE analysis versus the predicted deuterium fractionation derived for DCN across the GMC regions. |
When approaching the warmer temperatures of the gas traced by these molecules (> 60 K), the most efficient formation mechanism for DCN in the interstellar medium is that of CH2D+ reacting with atomic N (Roueff et al. 2007, 2013). The CH2D+ is formed by the exothermic reaction
 (1)
(1)
which becomes the primary processing reaction of HD (the most abundant deuterated species) at > 50 K. The CH2D+ then reacts with the atomic N in the following reaction:
 (2)
(2)
The DCN+ cation then undergoes hydrogenation and dissociative recombination reactions to form DCN. Roueff et al. (2007) performed chemical models at 50–70 K and observed D/H ratios in DCN and HCN of > 5 × 10⁻⁴, which are consistent with the observed results of this paper.
In conclusion, the results of this paper are the following:
-
Observing DCN within the CMZ of NGC253 is advantageous thanks to the relatively close proximity of this galaxy. Our observation provides us with the opportunity to study deuteration in known star-forming regions at cloud-scale resolution despite the limited spatial resolution inherent in extragalactic studies.
-
We were able to constrain D/H ratio estimates within four regions of the CMZ of NGC 253 via isotopologues of HCN. We obtained a range between 5.58 ± 1.06 ×10⁻⁴ and 10.3 ± 0.1 ×10⁻⁴ across the four GMCs. The warmest observed region, GMC-6, compared favourably to the warm broad component of G+0.693-0.027 observed within the CMZ of our Galaxy. The remaining three GMCs, each with cooler predicted temperatures aligned more closely to the cooler prestellar component observed within G+0.693-0.027 as observed by Colzi et al. (2022).
-
Our results seem to be consistent with the idea that warmer temperature gas components lead to an increase in the abundance of DCN.
-
In order to be more certain of the exact conditions of the gas being traced by DCN, other species such as N2D+ and DCO+ need to be detected, as, thanks to their preference of lower temperature formation mechanisms, the correlation between deuterium fractionation and temperature could be better constrained in future extragalactic studies.
To conclude, in this paper we have shown the first detection of a deuterated molecule in a non-Magellanic extragalactic starburst environment. This work serves as another step in the progression of the study of deuterated species in the interstellar medium by providing a comparison to the numerous observations of deuterated molecules within our own Galaxy.
STATCONT is a python-based tool designed to determine the continuum emission level in line-rich spectral data; https://hera.ph1.uni-koeln.de/~sanchez/statcont
Madrid Data Cube Analysis on ImageJ is a software developed in the Center of Astrobiology (CAB, CSIC-INTA) to visualise and analyse astronomical single spectra and datacubes. MADCUBA is available at https://cab.inta-csic.es/madcuba/
Acknowledgments
This paper makes use of the following ALMA data: ADS/JAO.ALMA#2017.1.00028.S ALMA is a partnership of ESO (representing its member states), NSF (USA) and NINS (Japan), together with NRC (Canada), NSTC and ASIAA (Taiwan), and KASI (Republic of Korea), in co-operation with the Republic of Chile. The Joint ALMA Observatory is operated by ESO, AUI/NRAO and NAOJ. J.B. and S.V. have received funding from the European Research Council (ERC) under the European Union’s Horizon 2020 research and innovation programme MOPPEX 833460. V.M.R. and LC acknowledge support from the grants No. PID2019-105552RB-C41 and PID2022-136814NB-I00 by the Spanish Ministry of Science, Innovation and Universities/State Agency of Research MICIU/AEI/10.13039/501100011033 and by “ERDF A way of making Europe”. VMR also acknowledges support from the grant RYC2020-029387-I funded by MICIU/AEI/10.13039/501100011033 and by “ESF, Investing in your future”, from the Consejo Superior de Investigaciones Científicas (CSIC) and the Centro de Astrobiología (CAB) through the project 20225AT015 (Proyectos intramurales especiales del CSIC); and from the grant CNS2023-144464 funded by MICIU/AEI/10.13039/501100011033 and by “European Union NextGenerationEU/PRTR”. The authors would like to thank the anonymous referee for the constructive comments that greatly increased the quality of this paper from its original version.
References
- Askne, J., Hoglund, B., Hjalmarson, A., & Irvine, W. M. 1984, A&A, 130, 311 [NASA ADS] [Google Scholar]
- Bayet, E., Awad, Z., & Viti, S. 2010, ApJ, 725, 214 [NASA ADS] [CrossRef] [Google Scholar]
- Behrens, E., Mangum, J. G., Holdship, J., et al. 2022, ApJ, 939, 119 [NASA ADS] [CrossRef] [Google Scholar]
- Ben Khalifa, M., Darna, B., & Loreau, J. 2024, A&A, 683, A53 [NASA ADS] [CrossRef] [EDP Sciences] [Google Scholar]
- Bergin, E. A., Goldsmith, P. F., Snell, R. L., & Ungerechts, H. 1994, ApJ, 431, 674 [NASA ADS] [CrossRef] [Google Scholar]
- Bonato, M., Liuzzo, E., Giannetti, A., et al. 2018, MNRAS, 478, 1512 [NASA ADS] [CrossRef] [Google Scholar]
- Busquet, G., Fontani, F., Viti, S., et al. 2017, A&A, 604, A20 [CrossRef] [EDP Sciences] [Google Scholar]
- Butterworth, J., Viti, S., Van der Werf, P. P., et al. 2024, A&A, 686, A31 [NASA ADS] [CrossRef] [EDP Sciences] [Google Scholar]
- Calcutt, H., Willis, E. R., Jørgensen, J. K., et al. 2019, A&A, 631, A137 [NASA ADS] [CrossRef] [EDP Sciences] [Google Scholar]
- CASA Team, Bean, B., Bhatnagar, S., et al. 2022, PASP, 134, 114501 [NASA ADS] [CrossRef] [Google Scholar]
- Caselli, P., & Ceccarelli, C. 2012, A&ARv, 20, 56 [Google Scholar]
- Caselli, P., Vastel, C., Ceccarelli, C., et al. 2008, A&A, 492, 703 [NASA ADS] [CrossRef] [EDP Sciences] [Google Scholar]
- Chin, Y. N., Henkel, C., Millar, T. J., Whiteoak, J. B., & Mauersberger, R. 1996, A&A, 312, L33 [Google Scholar]
- Colzi, L., Fontani, F., Rivilla, V. M., et al. 2018, MNRAS, 478, 3693 [Google Scholar]
- Colzi, L., Romano, D., Fontani, F., et al. 2022, A&A, 667, A151 [NASA ADS] [CrossRef] [EDP Sciences] [Google Scholar]
- Crapsi, A., Caselli, P., Walmsley, C. M., et al. 2005, ApJ, 619, 379 [Google Scholar]
- Cyburt, R. H., Fields, B. D., Olive, K. A., & Yeh, T.-H. 2016, Rev. Mod. Phys., 88, 015004 [NASA ADS] [CrossRef] [Google Scholar]
- Emprechtinger, M., Caselli, P., Volgenau, N. H., Stutzki, J., & Wiedner, M. C. 2009, A&A, 493, 89 [NASA ADS] [CrossRef] [EDP Sciences] [Google Scholar]
- Endres, C. P., Schlemmer, S., Schilke, P., Stutzki, J., & Müller, H. S. P. 2016, J. Mol. Spectr., 327, 95 [NASA ADS] [CrossRef] [Google Scholar]
- Epstein, R. I., Lattimer, J. M., & Schramm, D. N. 1976, Nature, 263, 198 [NASA ADS] [CrossRef] [Google Scholar]
- Fayolle, E. C., Öberg, K. I., Garrod, R. T., van Dishoeck, E. F., & Bisschop, S. E. 2015, A&A, 576, A45 [NASA ADS] [CrossRef] [EDP Sciences] [Google Scholar]
- Fontani, F., Palau, A., Caselli, P., et al. 2011, A&A, 529, L7 [NASA ADS] [CrossRef] [EDP Sciences] [Google Scholar]
- Fontani, F., Sakai, T., Furuya, K., et al. 2014, MNRAS, 440, 448 [NASA ADS] [CrossRef] [Google Scholar]
- Fontani, F., Busquet, G., Palau, A., et al. 2015, A&A, 575, A87 [NASA ADS] [CrossRef] [EDP Sciences] [Google Scholar]
- Gerner, T., Shirley, Y. L., Beuther, H., et al. 2015, A&A, 579, A80 [NASA ADS] [CrossRef] [EDP Sciences] [Google Scholar]
- Harada, N., Martín, S., Mangum, J. G., et al. 2021, ApJ, 923, 24 [NASA ADS] [CrossRef] [Google Scholar]
- Heikkilä, A., Johansson, L. E. B., & Olofsson, H. 1997, A&A, 319, L21 [Google Scholar]
- Holdship, J., Viti, S., Martín, S., et al. 2021, A&A, 654, A55 [NASA ADS] [CrossRef] [EDP Sciences] [Google Scholar]
- Holdship, J., Mangum, J. G., Viti, S., et al. 2022, ApJ, 931, 89 [NASA ADS] [CrossRef] [Google Scholar]
- Ivanchik, A. V., Petitjean, P., Balashev, S. A., et al. 2010, MNRAS, 404, 1583 [NASA ADS] [Google Scholar]
- Leroy, A. K., Bolatto, A. D., Ostriker, E. C., et al. 2015, ApJ, 801, 25 [NASA ADS] [CrossRef] [Google Scholar]
- Leroy, A. K., Bolatto, A. D., Ostriker, E. C., et al. 2018, ApJ, 869, 126 [NASA ADS] [CrossRef] [Google Scholar]
- Levy, R. C., Bolatto, A. D., Leroy, A. K., et al. 2022, ApJ, 935, 19 [NASA ADS] [CrossRef] [Google Scholar]
- Lubowich, D. A., Pasachoff, J. M., Balonek, T. J., et al. 2000, Nature, 405, 1025 [NASA ADS] [CrossRef] [Google Scholar]
- Mangum, J. G., Ginsburg, A. G., Henkel, C., et al. 2019, ApJ, 871, 170 [NASA ADS] [CrossRef] [Google Scholar]
- Martín, S., Mauersberger, R., Martín-Pintado, J., Henkel, C., & García-Burillo, S. 2006, ApJS, 164, 450 [Google Scholar]
- Martín, S., Martín-Pintado, J., Blanco-Sánchez, C., et al. 2019, A&A, 631, A159 [Google Scholar]
- Martín, S., Mangum, J. G., Harada, N., et al. 2021, A&A, 656, A46 [NASA ADS] [CrossRef] [EDP Sciences] [Google Scholar]
- Mauersberger, R., Henkel, C., & Chin, Y. N. 1995, A&A, 294, 23 [NASA ADS] [Google Scholar]
- Müller, H. S. P., Thorwirth, S., Roth, D. A., & Winnewisser, G. 2001, A&A, 370, L49 [Google Scholar]
- Müller, H. S. P., Schlöder, F., Stutzki, J., & Winnewisser, G. 2005, J. Mol. Struct., 742, 215 [Google Scholar]
- Oliveira, C. M., Hébrard, G., Howk, J. C., et al. 2003, ApJ, 587, 235 [NASA ADS] [CrossRef] [Google Scholar]
- Prodanović, T., & Fields, B. D. 2003, ApJ, 597, 48 [CrossRef] [Google Scholar]
- Remijan, A., Biggs, A., Cortes, P. A., et al. 2019, ALMA Technical Handbook, ALMA Doc. 7.3, ver. 1.1, 2019, ALMA Technical Handbook, ALMA Doc. 7.3, ver. 1.1ISBN 978-3-923524-66-2 [Google Scholar]
- Roueff, E., Parise, B., & Herbst, E. 2007, A&A, 464, 245 [NASA ADS] [CrossRef] [EDP Sciences] [Google Scholar]
- Roueff, E., Gerin, M., Lis, D. C., et al. 2013, J. Phys. Chem. A, 117, 9959 [Google Scholar]
- Sánchez-Monge, Á., Schilke, P., Schmiedeke, A., et al. 2017, A&A, 604, A6 [NASA ADS] [CrossRef] [EDP Sciences] [Google Scholar]
- Tang, X. D., Henkel, C., Menten, K. M., et al. 2019, A&A, 629, A6 [NASA ADS] [CrossRef] [EDP Sciences] [Google Scholar]
- Turner, B. E. 2001, ApJS, 136, 579 [Google Scholar]
- Wootten, A. 1987, in Astrochemistry, eds. M. S. Vardya, & S. P. Tarafdar, 120, 311 [NASA ADS] [CrossRef] [Google Scholar]
- Zahorecz, S., Jimenez-Serra, I., Testi, L., et al. 2017, A&A, 602, L3 [NASA ADS] [CrossRef] [EDP Sciences] [Google Scholar]
- Zavarygin, E. O., Webb, J. K., Dumont, V., & Riemer-Sørensen, S. 2018, MNRAS, 477, 5536 [NASA ADS] [CrossRef] [Google Scholar]
Appendix A: Additional spectral information
Spectroscopy of the HC3N and its isotopologues studied in this work from CDMS (Müller et al. 2001, 2005; Endres et al. 2016).
Appendix B: Additional moment zero maps
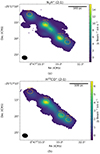 |
Fig. B.1. Velocity integrated line intensity moment 0 maps, given in [Jy km s−1 /beam], of the N2H+ (2-1) and H13 CO+ (2-1) lines observed in the CMZ of NGC 253. |
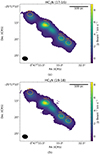 |
Fig. B.2. Velocity integrated line intensity moment 0 maps, given in [Jy km s−1 /beam], of the HC3N (17-16) and HC3N (19-18) lines observed in the CMZ of NGC 253. |
Appendix C: Spectra
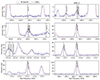 |
Fig. C.1. Spectra of selected lines observed in the region GMC-3 (in blue). The best fitting LTE model from MADCUBA is shown overplotted in red. |
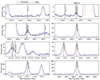 |
Fig. C.2. Spectra of selected lines observed in the region GMC-4 (in blue). The best fitting LTE model from MADCUBA is shown overplotted in red. |
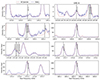 |
Fig. C.3. Spectra of selected lines observed in the region GMC-6 (in blue). The best fitting LTE model from MADCUBA is shown overplotted in red. |
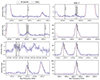 |
Fig. C.4. Spectra of selected lines observed in the region GMC-7 (in blue). The best fitting LTE model from MADCUBA is shown overplotted in red. |
All Tables
Spectroscopy of the deuterated molecular transitions and of their hydrogenated counterparts.
Integrated intensities in [K km s−1] as observed within each of the studied GMC regions.
Spectroscopy of the HC3N and its isotopologues studied in this work from CDMS (Müller et al. 2001, 2005; Endres et al. 2016).
All Figures
|
Fig. 1. Velocity integrated line intensity moment 0 maps, given in [Jy km s−1 /beam], for the observed DCN (2-1) line (a) alongside the accompanying H13CN (2-1) line (b). Both of these maps are shown with a 3 sigma cut-off. The orange ellipses show the beam-sized regions over which the later analysis of this letter was conducted. |
| In the text | |
|
Fig. 2. Ratio map of the velocity integrated line intensities of DCN (2-1)/H13CN (2-1). The white contours shown are the 5 sigma limited intensities of DCN (2-1). |
| In the text | |
|
Fig. 3. Spectrum of DCN (2-1) observed in the brightest region GMC-6 (in blue). The best-fitting LTE model from MADCUBA is shown overplotted in red. |
| In the text | |
|
Fig. 4. Ratio of D/H obtained through DCN for each region across NGC 253, shown both for the intensity ratio of DCN (2-1)/H13CN (2-1) (in blue) and column density ratio (in red). These observations are shown relative to the prestellar (indicated with ‘PS’) and broad (shown with ‘B’) components of G+0.693-0.027 from Colzi et al. (2022) (C+22, shown in green and orange, respectively), the D/H ratio observed in the shock region L1157-B1 by Busquet et al. (2017) (in purple), and the DCN/HCN ratio observed in the LMC by Chin et al. (1996) (in yellow). |
| In the text | |
|
Fig. 5. Comparison of LTE analysis predicted column density ranges of DCN/HCN to models shown in Roueff et al. (2007) and Bayet et al. (2010). The term ‘SB’ stands for starburst, ‘SB+’ for cosmic-ray enhanced starburst, ‘NS’ for normal spiral, ‘LM’ for low metallicity, ‘HZ’ for high redshift, and ‘WC’ for warm core. The ‘LT’ (lower temperature) prefix is given to the models from Roueff et al. (2007), as these models were conducted at a significantly lower kinetic temperature (70 K) than the remaining models from Bayet et al. (2010) (> 300 K). The effect of this temperature difference is discussed in the text. The primordial D/H ratio of around 2.55 ± (0.03)×10−5 is presented with a horizontal dashed line (Zavarygin et al. 2018). |
| In the text | |
|
Fig. 6. Derived excitation temperatures of DCN from LTE analysis versus the predicted deuterium fractionation derived for DCN across the GMC regions. |
| In the text | |
|
Fig. B.1. Velocity integrated line intensity moment 0 maps, given in [Jy km s−1 /beam], of the N2H+ (2-1) and H13 CO+ (2-1) lines observed in the CMZ of NGC 253. |
| In the text | |
|
Fig. B.2. Velocity integrated line intensity moment 0 maps, given in [Jy km s−1 /beam], of the HC3N (17-16) and HC3N (19-18) lines observed in the CMZ of NGC 253. |
| In the text | |
|
Fig. C.1. Spectra of selected lines observed in the region GMC-3 (in blue). The best fitting LTE model from MADCUBA is shown overplotted in red. |
| In the text | |
|
Fig. C.2. Spectra of selected lines observed in the region GMC-4 (in blue). The best fitting LTE model from MADCUBA is shown overplotted in red. |
| In the text | |
|
Fig. C.3. Spectra of selected lines observed in the region GMC-6 (in blue). The best fitting LTE model from MADCUBA is shown overplotted in red. |
| In the text | |
|
Fig. C.4. Spectra of selected lines observed in the region GMC-7 (in blue). The best fitting LTE model from MADCUBA is shown overplotted in red. |
| In the text | |
Current usage metrics show cumulative count of Article Views (full-text article views including HTML views, PDF and ePub downloads, according to the available data) and Abstracts Views on Vision4Press platform.
Data correspond to usage on the plateform after 2015. The current usage metrics is available 48-96 hours after online publication and is updated daily on week days.
Initial download of the metrics may take a while.