Open Access
Fig. 1.
Download original image
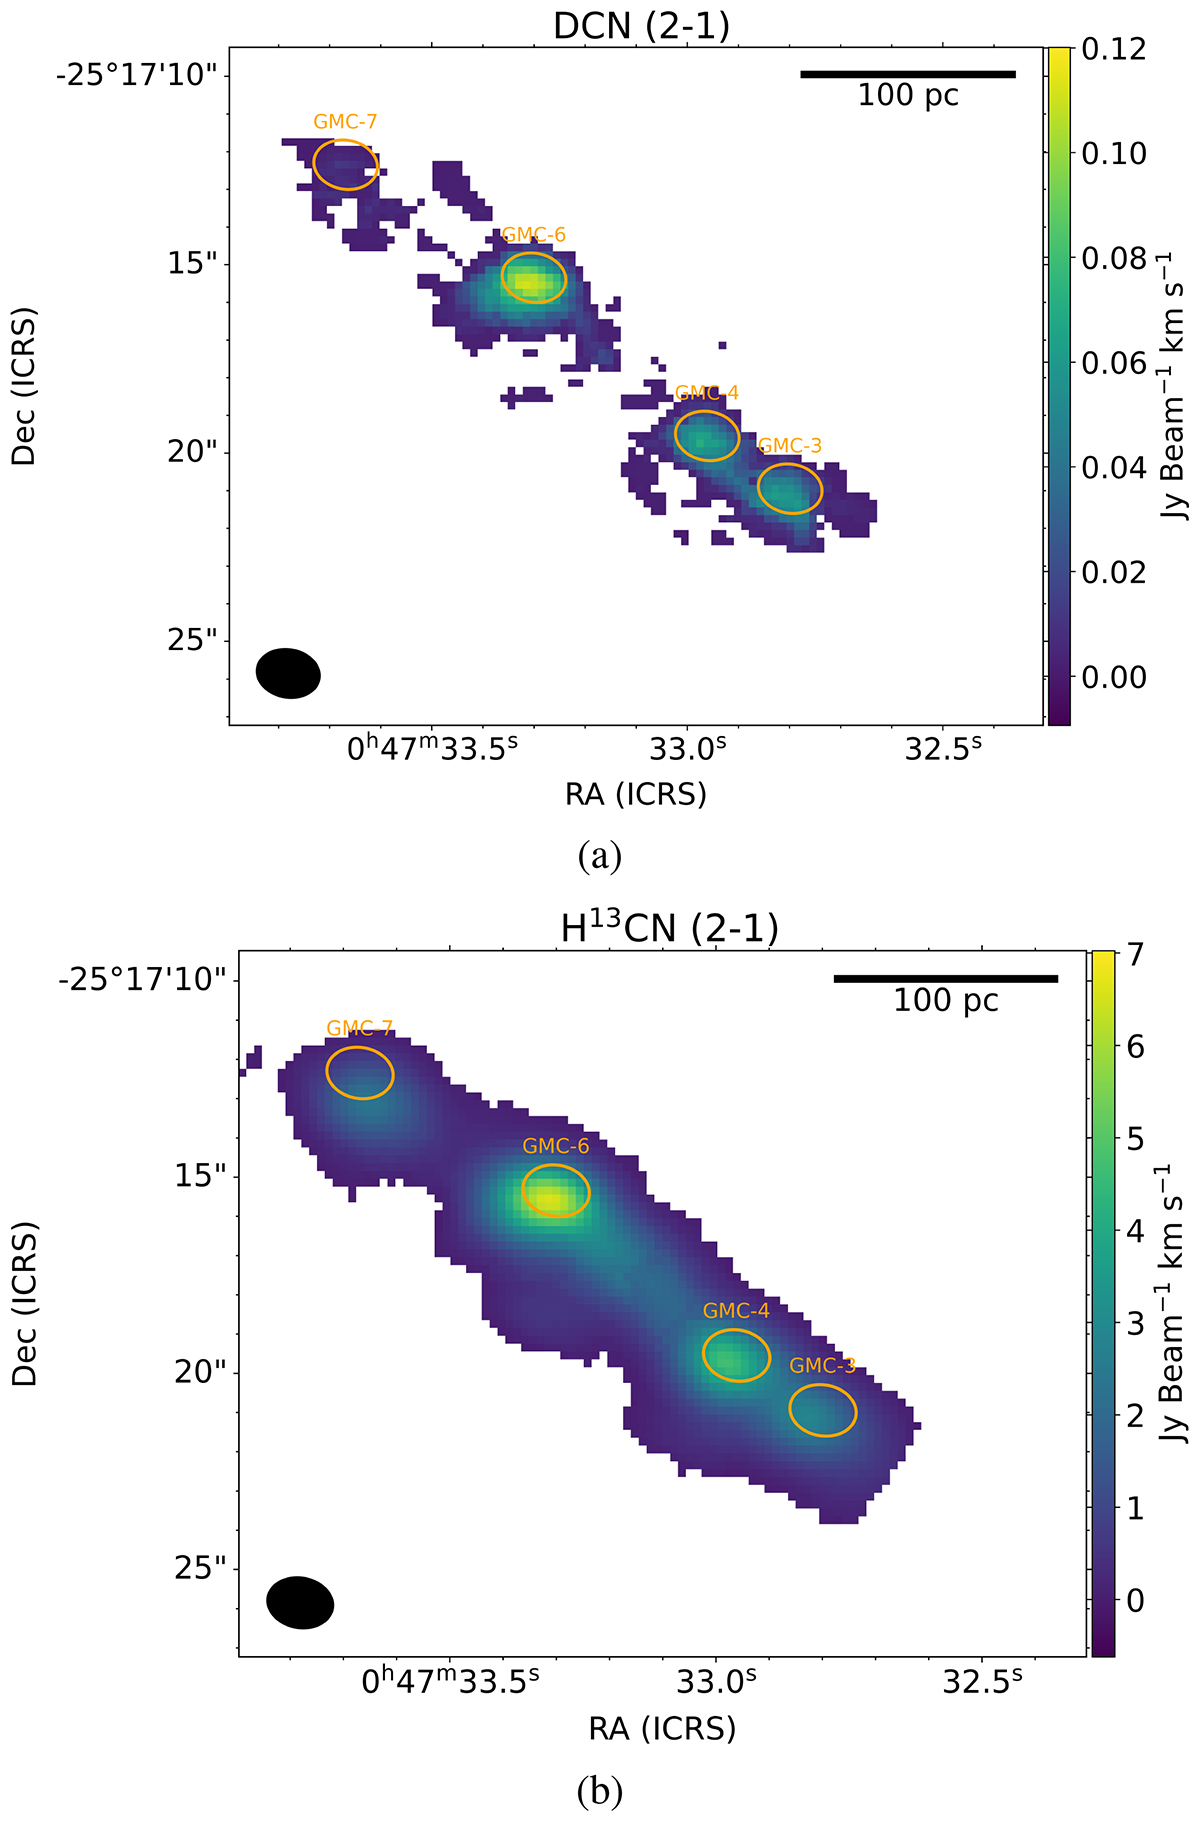
Velocity integrated line intensity moment 0 maps, given in [Jy km s−1 /beam], for the observed DCN (2-1) line (a) alongside the accompanying H13CN (2-1) line (b). Both of these maps are shown with a 3 sigma cut-off. The orange ellipses show the beam-sized regions over which the later analysis of this letter was conducted.
Current usage metrics show cumulative count of Article Views (full-text article views including HTML views, PDF and ePub downloads, according to the available data) and Abstracts Views on Vision4Press platform.
Data correspond to usage on the plateform after 2015. The current usage metrics is available 48-96 hours after online publication and is updated daily on week days.
Initial download of the metrics may take a while.