Fig. 7
Download original image
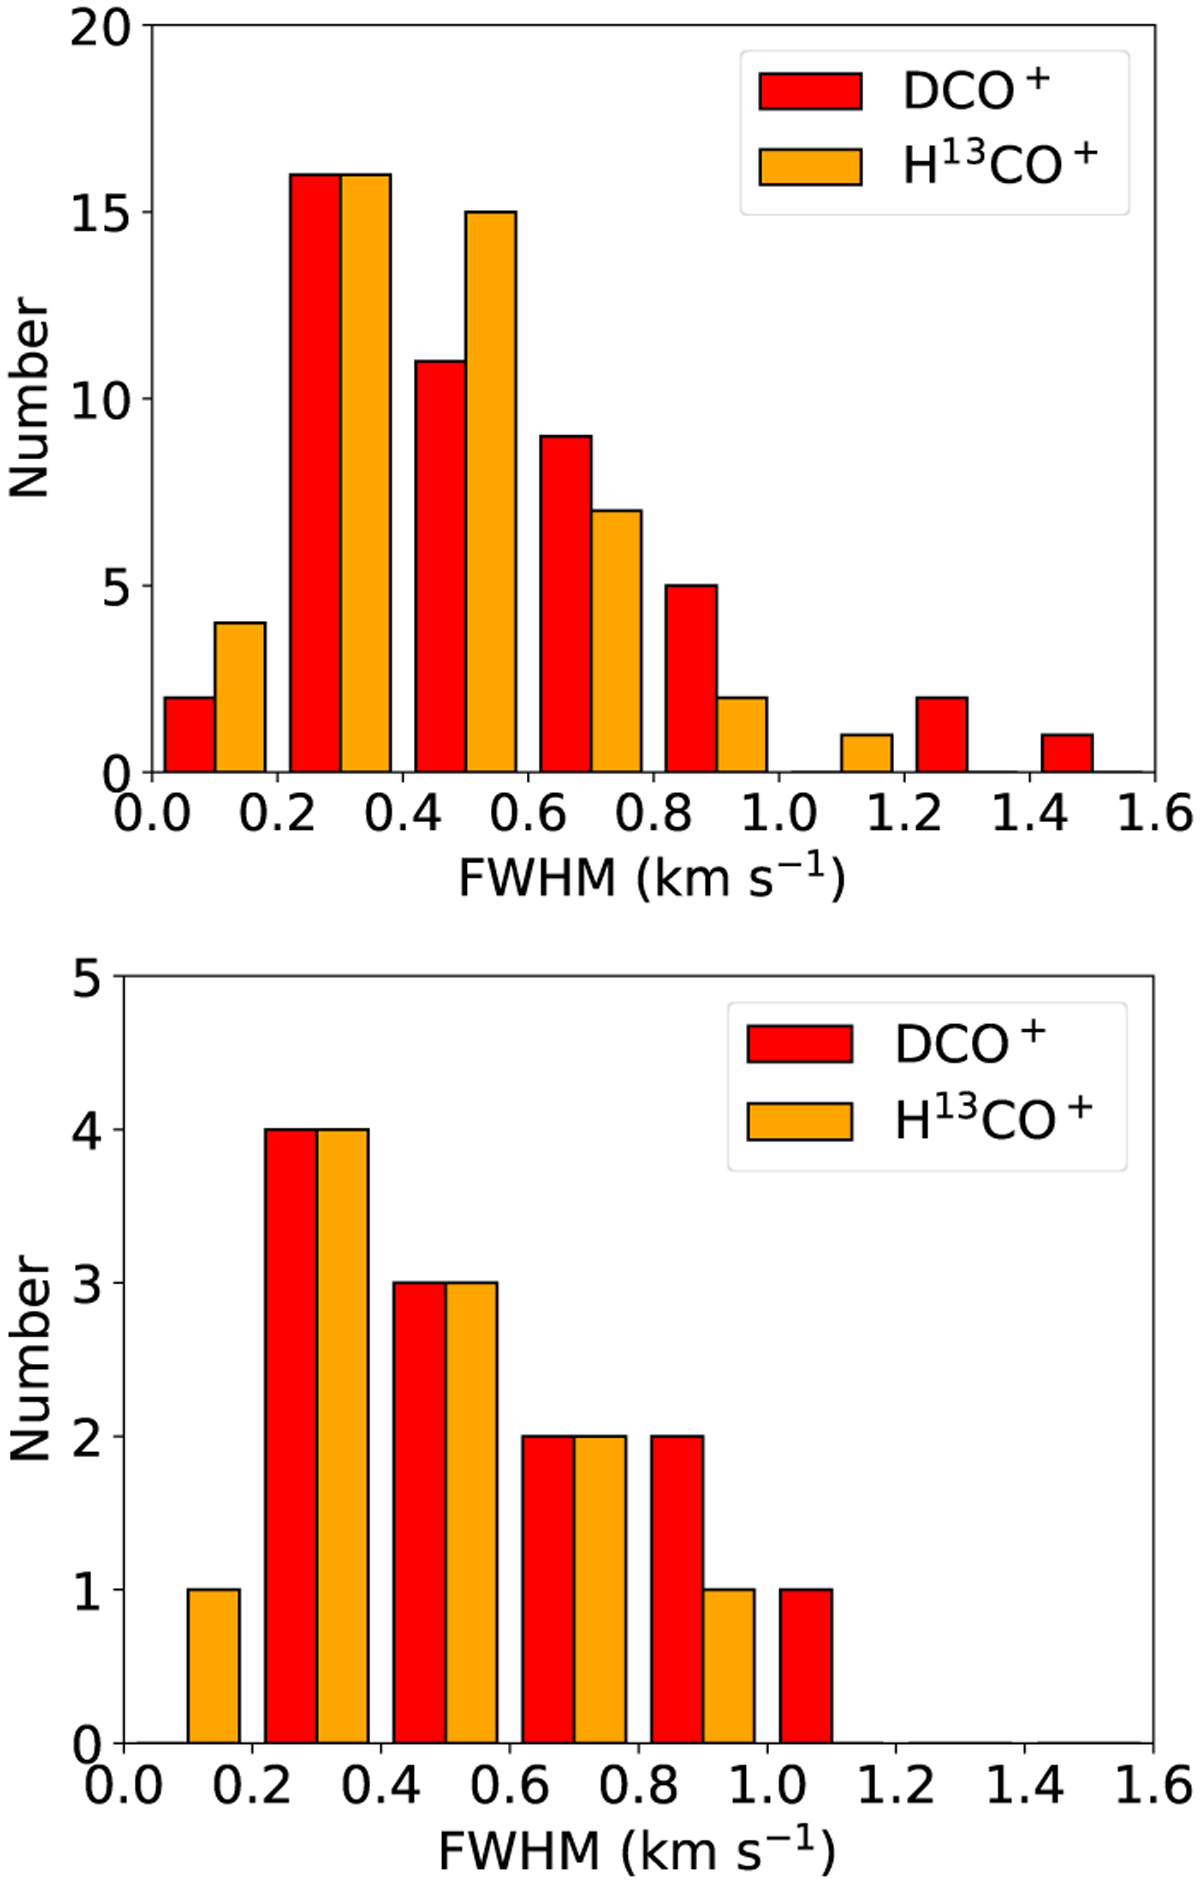
Top: distributions of FWHM for DCO+ (red bars) and H13CO+ (orange bars) 1−0 in 46 sources where DCO+ and H13CO+ 1−0 were detected using the high-velocity resolution mode (AROWS mode 13). Bottom: distribution of FWHM of DCO+ in sources for which only DCO+ 1−0 was detected (red bars) and distribution of FWHM of H13CO+ in sources for which only H13CO+ 1−0 was detected (orange bars).
Current usage metrics show cumulative count of Article Views (full-text article views including HTML views, PDF and ePub downloads, according to the available data) and Abstracts Views on Vision4Press platform.
Data correspond to usage on the plateform after 2015. The current usage metrics is available 48-96 hours after online publication and is updated daily on week days.
Initial download of the metrics may take a while.