| Issue |
A&A
Volume 695, March 2025
|
|
|---|---|---|
| Article Number | L18 | |
| Number of page(s) | 9 | |
| Section | Letters to the Editor | |
| DOI | https://doi.org/10.1051/0004-6361/202453279 | |
| Published online | 21 March 2025 | |
Letter to the Editor
ALMA 360 parsec, high-frequency observations reveal warm dust in the center of a z = 6.9 quasar
1
Departement d’Astronomie, University of Geneva, Chemin Pegasi 51, 1290 Versoix, Switzerland
2
Max-Planck Institute for Astronomy, Königstuhl 17, 69118 Heidelberg, Germany
3
Scuola Normale Superiore, Piazza dei Cavalieri 7, 56126 Pisa, Italy
4
Dipartimento di Fisica “G. Occhialini”, Università degli Studi di Milano-Bicocca, Piazza della Scienza 3 I-20126 Milano, Italy
5
National Radio Astronomy Observatory, 520 Edgemont Road, Charlottesville, VA, 22903, USA
6
Leiden Observatory, Leiden University, Niels Bohrweg 2, NL-2333 CA Leiden, The Netherlands
⋆ Corresponding author; This email address is being protected from spambots. You need JavaScript enabled to view it.
Received:
3
December
2024
Accepted:
20
February
2025
Abstract
The temperature of the cold dust in z > 6 galaxies is a potential tracer of the presence of an active galactic nucleus (AGN) and stellar feedback. This is also the dominant source of uncertainty in inferring properties from the far-infrared (FIR) emission of these galaxies. We present the first resolved dust temperature map in a z > 6 quasar host galaxy. We combined new 360 parsec (pc) resolution ALMA Band 9 continuum observations with 190 pc Band 6 observations from the literature to derive the dust temperature and opacity at 0.1 < r < 0.5 kpc scales in a z = 6.9 luminous quasar host galaxy (J2348–3054). We find that the dust temperature (and opacity) increases at the center (r < 216 pc) of the galaxy up to Td = 73 − 88 K, potentially rising up to Td < 149 K at r < 110 pc. The combination of the resolved and integrated FIR spectral energy distribution (SED) further reveal a dust temperature gradient and a significant contribution of the AGN hot dust torus at νobs ≳ 700 GHz. By taking into account the torus contribution and resolved optically thick emission, we derived the total IR luminosity (LTIR = 8.78 ± 0.10) × 1012 L⊙) and corresponding star formation rate (SFR = 1307 ± 15 M⊙yr-1), which are at least a factor of ∼3.6 (∼0.56 dex) lower than previous measurements based on the assumption of optically thin emission. We compared the resolved dust temperature, mass, and IR luminosity profiles to simulations where they are only reproduced by models that include the AGN radiation heating the dust in the center of the galaxy. Our observations provide evidence that dust in J2348–3054 cannot be assumed to be uniformly cold and optically thin. Whether J2348–3054 is representative of the larger population of high-redshift quasars and galaxies remains to be determined with future dedicated high-resolution and high-frequency ALMA observations.
Key words: galaxies: high-redshift / galaxies: ISM / quasars: general / galaxies: star formation / submillimeter: galaxies
© The Authors 2025
 Open Access article, published by EDP Sciences, under the terms of the Creative Commons Attribution License (https://creativecommons.org/licenses/by/4.0), which permits unrestricted use, distribution, and reproduction in any medium, provided the original work is properly cited.
This article is published in open access under the Subscribe to Open model. This email address is being protected from spambots. You need JavaScript enabled to view it. to support open access publication.
1. Introduction
The advent of ground-based sub-mm interferometry (ALMA/NOEMA) has opened a new window onto the interstellar medium (ISM) of distant galaxies (e.g., Carilli & Walter 2013, for a review). Over the past two decades, fine structure lines and continuum emission in the rest-frame far-infrared (FIR) have been detected in increasing numbers of extragalactic sources. However, the interpretation of the FIR continuum emission relies on numerous assumptions about the underlying properties of cold ISM dust. The dust continuum modified blackbody emission peaks at a rest-frame of  , depending on the dust temperature. High-frequency observations are thus required to accurately constrain the peak of the spectral energy distribution (SED) and infer the dust temperature; however, such observations are difficult to obtain (especially at z ≳ 5). Even recent studies have approached (but rarely go beyond) the peak of the dust SED at z ≳ 6 (e.g., Novak et al. 2019; Shao et al. 2022; Witstok et al. 2023; Algera et al. 2024; Tripodi et al. 2024). The FIR luminosities, star formation rates (SFRs), and (in some cases) gas mass estimates (when no suitable lines are present) can be derived from the integrated dust SED and they are similarly uncertain as a result. It is even more challenging to obtain resolved dust temperature measurements (and, thus, resolved SFR, gas, and dust mass profiles), which require high-resolution observations at multiple frequencies (including at high frequency). Resolved dust temperature measurements are however crucial to investigate assumptions made about dust properties when analyzing unresolved data and characterizing the interstellar medium (ISM) of distant galaxies.
One area of particular interest is the interaction between the active galactic nucleus (AGN) and the surrounding ISM. Numerous studies have searched for evidence of AGN feedback in the host galaxies of luminous z > 6 quasars powered by supermassive black hole (SMBH), with masses of MBH > 108 − 109 M⊙ and accretion rates that are close to the Eddington accretion rate; thus, we expect these to be optimal to search for AGN feedback in the first billion years. The majority of studies have focused on [C II] outflows, with mixed results (Maiolino et al. 2012; Cicone et al. 2015; Bischetti et al. 2019; Novak et al. 2020; Izumi et al. 2021; Tripodi et al. 2022; Shao et al. 2022; Meyer et al. 2022; Tripodi et al. 2024). However, other forms of feedback signatures predicted by theoretical models, such as highly-excited gas tracers (e.g., Carniani et al. 2019) or warm ( ) dust, have been thoroughly less explored, in comparison. In a recent study, Di Mascia et al. (2021) showed that radiation from the AGN is expected to heat the ISM in its vicinity. Although the mass of warm dust heated in this way is negligible, it can significantly affect the integrated dust SED at longer wavelengths. Disentangling the effect of the AGN on the dust is not only an important new tracer of AGN feedback, but is also crucial for accurately measuring their star formation rates from the heated dust continuum emission (e.g., Scoville & Kwan 1976; Casey 2012; Tsukui et al. 2023; Fernández Aranda et al. 2025). So far, however, such measurements have been impossible at z > 5 due to the difficulty in obtaining the necessary high-resolution and high-frequency observations. Currently, resolved (i.e., sub-kpc) observations of high-redshift (z > 5) sources are still rare and limited to a single continuum frequency around the [C II] line (e.g., Venemans et al. 2019; Walter et al. 2022; Meyer et al. 2023, 2025; Neeleman et al. 2023; Rowland et al. 2024).
J2348–3054 is a luminous broad absorption line (BAL) quasar at z = 6.9 discovered in VIKING imaging data (Venemans et al. 2013). It hosts a black hole with a mass of 0.6 − 2.0 × 10⁹ M⊙ (De Rosa et al. 2014; Mazzucchelli et al. 2017; Farina et al. 2022). The host galaxy was first detected in unresolved [C II] and ALMA Band 3 continuum (Venemans et al. 2015, 2016, 2020) and it was more recently was observed at 190 pc resolution in [C II] and continuum by Walter et al. (2022). The galaxy is IR and [C II] luminous (![Mathematical equation: $ L_\mathrm{{TIR},8{-}1000\,{\upmu}\rm{m}}=3.2\times10^{13}\, L_\odot,\, L_{[{\mathrm{C}\,\textsc{II}}]}=1.9\times10^9\, L_\odot $](/articles/aa/full_html/2025/03/aa53279-24/aa53279-24-eq7.gif) ) and massive (dynamical mass Mdyn = 1010.3 ± 0.3 M⊙), with a very compact host galaxy (the central
) and massive (dynamical mass Mdyn = 1010.3 ± 0.3 M⊙), with a very compact host galaxy (the central  containing ∼90% of the continuum flux), it also displays kinematics that are compatible with a rotating disk. Based on the surface brightness observed in the central resolution element, Walter et al. (2022) suggested that the continuum dust emission is optically-thick, with a dust temperature
  associated with an Eddington-limited starburst (
 ) in the central hundred parsec region.
In this Letter, we present resolved ALMA Band 9 continuum observations (rest-frame 4623 GHz) probing the peak of the dust SED of J2348–3054. Combined with the previous Band 6 190 pc resolution data (Walter et al. 2022), these observations have enabled us to derive the resolved dust temperature profile and dust opacity for the first time at this redshift. We confirm the presence of an increase in the dust temperature in the central hundred pc. We also discuss the role of the quasar in heating the dust in the central region. This Letter showcases how ALMA is able to resolve the ISM properties of the first galaxies in the Universe. Throughout this work, we use a concordance cosmology with  .
.
2. The resolved dust properties of a z = 6.9 quasar
We observed the z = 6.9 quasar J2348–3054 in configuration C43-6 in ALMA Band 9 at a frequency of 670 GHz (Program ID #2021.1.01350.S, PI: Meyer). The final on-source time is 48 min. J1924-2914 was used a bandpass calibrator, and J2349-3133 as the phase calibrator. The data were reduced directly by the ALMA ARC node. Baselines exceeding a phase root mean square (rms) of > 100 deg were manually flagged to minimize decoherence. Importantly, the maximum recoverable scale ( ) is similar to that of the 250 GHz continuum observations (Walter et al. 2022). We imaged the Band 9 continuum using CASA version 6.2.1-7 (THE CASA TEAM 2022), with multiscale cleaning down to 2σ and a robust Briggs weighting of r = 0.5, using the entire bandwidth (15 GHz) with a pixel scale of
  . A visual inspection of the datacube did not reveal significant absorption or emission in the spectrum. The final 670 GHz continuum map has a synthesized beam of
  , corresponding to a FWHM of ∼360 pc and an effective radius of r = 216 pc, which then corresponds to a circular area with an equivalent area to the beam (for comparison, the beam of the Band 6 data has an effective radius r = 110 pc). The rms of the continuum map is 215 μJy beam−1. Finally, we convolve the 250 GHz continuum map from Walter et al. (2022) down to the 670 GHz continuum beam using the SpectralCube package1, resulting in an rms of 6.2 μJy beam−1 at 250 GHz.
We found a peak continuum flux density of  at a position of RA = 23:48:33.346, Dec = −30:54:10.307 (ICRS). We then integrated the 670 GHz continuum flux over an aperture of
  centered on this peak pixel and found
  . We note that here we have applied residual-scaling (see e.g., Jorsater & van Moorsel 1995; Walter & Brinks 1999) as implemented in the interferopy Python package. The aperture radius of
  is chosen with a curve-of-growth analysis, where we find that the flux is consistent within uncertainties for all
  apertures.
We show the resolved 670 GHz continuum observations in Fig. 1, along with a comparison to the original and convolved Band 6 continuum data given in Appendix A. The contours of the 250 GHz continuum are more tightly spaced than that of the 670 GHz continuum, suggesting a radial evolution of  and specific dust emission properties. To quantify this result, we fit the SED in each pixel using the Band 6 and Band 9 resolved data (we further show in Appendix B that our results are not affected by the imprint of the two different dirty beams in the residuals). As Walter et al. (2022) showed, the dust emission is likely optically thick in the inner center of the quasar host galaxy. Therefore, we fit the dust SED using the dust emission equation in the optically thick regime and applied cosmic microwave background contrast and heating corrections as per Da Cunha et al. (2013)
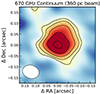 |
Fig. 1. New resolved continuum map at |

![Mathematical equation: $$ \begin{aligned} S_\nu \,=\,\Omega _A\,[B_\nu (T_d)-B_\nu (T_{\rm CMB})]\,[1-\exp (-\tau _\nu )]\,(1+z)^{-3}, \end{aligned} $$](/articles/aa/full_html/2025/03/aa53279-24/aa53279-24-eq24.gif) (1)
(1)
where Sν is the frequency–dependent dust continuum flux density, ΩA is the solid angle corresponding to the chosen aperture or beam size, Bν(Td) and Bν(TCMB) are the black body emission (Bν(T)=2 h ν3 c−2[exp(h ν/(kbT)) − 1]−1) from the dust and cosmic microwave background (CMB), with h as the Planck constant, c the speed of light, kB the Boltzmann constant, and τν the optical depth (as a function of frequency ν) of the dust. In this work, we adopted the prescription of Draine (2003)τν = κ0(ν/νref)β Mdust A−1, where κ0 = 13.9 cm2 g−1 is the absorption coefficient per unit dust mass, β is the emissivity index, νref = 2141 GHz is the reference frequency for the dust emissivity, Mdust is the dust mass, and A = πr2 is the area of the emitting region. With the dust opacity specified in this way, we can fit the resolved dust SED for the dust temperature, mass, and β slope. Here, we assume β = 1.8, which corresponds roughly to the median value found in statistical samples of galaxies and quasars observed in multi-band FIR observations at z > 5 (e.g., Witstok et al. 2023; Tripodi et al. 2024). Consequently, the only two free parameters in our fit are the dust temperature and mass (see Appendix C for a discussion of the non-degenerate nature of our temperature constraints).
We show the resolved dust temperature and optical depth in Fig. 2. We only fit pixels where the 670 GHz and 250 GHz continuum is detected at a signal-to-noise ratio of S/N > 3, which essentially reduces to the 670 GHz S/N > 3 criterion given the deeper sensitivity of the 250 GHz observations. The dust temperature peaks in the central beam to a beam-averaged temperature  , with an optical depth of τd = 1.8 at
  . Accordingly, the central (
 ) total IR luminosity (
 ) is LTIR = 4.8 ± 0.5 × 10¹² L⊙. Assuming that dust is heated by star formation, we would derive a central SFR of
  using the Kennicutt & Evans (2012) relation. The corresponding star-formation rate densities (SFRD)
  . These values could be lower if 1) the central pixel is contaminated by AGN torus hot dust emission and/or 2) the cold dust is in part heated by the AGN. We discuss these two possibilities in Sects. 3 and 4, respectively.
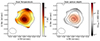 |
Fig. 2. Maps of the dust temperature (top left) and dust optical depth (top right), obtained from our best-fit optically-thick dust SED models to the 360 pc resolution Band 6 and Band 9 continuum observations. We only fit pixels where the continuum is detected at S/N > 3 in both bands. The median uncertainty in the dust temperature is |

We note that the lower resolution of our observations (∼twice that of Walter et al. 2022) results in lower dust temperatures, SFR, dust masses, and opacities in the central resolution element as the radial density decreases rapidly away from the center of the galaxy. We can still treat the observed continuum in the central beam 360 pc resolution as an upper limit to the flux at 190 pc resolution (Walter et al. 2022). Following the same method as above, we find an upper limit on the central ( ) dust temperature:
  , total IR luminosity: (
 ), LTIR < (10.5 ± 0.6) × 1012 L⊙, central SFR of
  , and SFRD
  , in agreement with Walter et al. (2022).
3. Constraining cold and warm ISM dust and the AGN hot dust torus emission
An important consequence of our results concerns the standard interpretation of the FIR SED with a single, cold dust SED greybody model. As shown in Fig. 3, the ALMA Band 9 continuum data excludes the optically-thin model fitted by Walter et al. (2022) with a single temperature of  . The summed S/N > 3 Band 6 and Band 9 pixels (see the previous section) accounts for ∼80% of the total flux, as cold (
 ) dust emission is likely missing from the outskirts of the galaxy. Incidentally, the observed SED implies that the Herschel/PACS fluxes at
  contain a non-negligible contribution from the AGN hot dust torus emission.
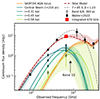 |
Fig. 3. FIR SED of J2348–3054. We show the constraints from ALMA, ACA and Herschel/PACS (Venemans et al. 2017; Walter et al. 2022) in black as well as our Band 9 integrated measurement in red. The dashed grey line show the single optically-thin emission model of (Walter et al. 2022) which does not reproduce the Band 9 continuum. The 360 pc resolved 250 and 670 GHz continuum fluxes are present in colored diamonds. The total SED, composed of the sum of the individual annuli SED and the SKIRTOR torus (shaded lines), is shown in dashed red and shaded area. Further ALMA Band 10 (resolved) observations could constrain the properties of the dust torus, which would contribute |


We thus proceeded to simultaneously fit the resolved continuum at 250 and 670 GHz and the integrated FIR emission using all literature data at 100 − 2000 GHz. To do this, we divided the resolved continuum data in four annuli starting with the central resolution element (r < 216 pc) up to  . We then fit the dust continuum in each annuli (assuming optically-thick emission) and additionally include the contribution from hot dust torus emission in the central beam. To model the AGN torus, we used SKIRTOR AGN models (Stalevski et al. 2012, 2016) with a nearly face-on geometry (i = 10°), motivated by the fact that J2348–3054 is a luminous type 1 quasar and the face-on disk [C II] kinematics (Walter et al. 2022). We defined the total log-likelihood as the sum of the individual log-likelihoods in each annuli and that of the integrated SED (see Appendix D).
We show the resulting best fits and uncertainties in Fig. 3 and refer to Appendix D for details of the dust properties in each annuli and the parameters posterior distribution2. We find that the central temperature decreases to  K when including an AGN hot torus contribution, although the strength of the torus emission and the central dust temperature are highly anti-correlated. Further high-resolution observations in Band 10 could break this degeneracy, where the AGN torus emission would be expected to dominate the central beam with a flux of
  . Nonetheless, we still find lower dust temperatures at larger radii
  (see Appendix D), indicating that the dust temperature gradient discussed in the previous section is robust.
Finally, we find that the summed FIR luminosity of the four annuli is LFIR = (8.78 ± 0.10) × 1012 L⊙, corresponding to SFR =  . This is 3.6× lower than the previously reported value of Walter et al. (2022), based on a single, optically-thin emission model, highlighting the importance of high-resolution observations to unveil optically thick dust emission and potential AGN contamination.
4. Considering whether AGN radiation is heating the dust in the center of J2348–3054
Our results show that the dust temperature in J2348–3054 is ∼60 K in the outskirts ( ) and rises up to 70−90 K in the central r < 360 pc (Fig. 2) – and even up to 149 ± 5 K in the central r < 110 pc. An interesting question pertains to whether the luminous BAL quasar or an associated intense starburst is primarily responsible for heating the dust. We compare our observations to three different simulations from Di Mascia et al. (2021) with: 1) no AGN feedback; 2) spherical AGN feedback; and 3) conical AGN feedback (Fig. 4). In particular, we compare the dust temperature profile, dust mass, and luminosity fraction as a function of temperature for the most luminous source in their simulations (M1450 = −21.4, −21.3, −25.4 in their noAGN, AGNsphere, and AGNcone runs). We find that the simulations without AGN feedback do not reproduce the warm dust temperature profile observed in the center of J2348–3054 and our observations are in general agreement with the AGNsphere model.
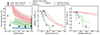 |
Fig. 4. Comparison between our observations and simulations by Di Mascia et al. (2021). We show the simulated profiles for the most luminous source in the simulations in dashed lines and the average profile of all sources in the simulation with full lines. We show the constraints from the matched-resolution (360 pc) ALMA Band 9 and Band 6 data in full datapoints, as well as the central limits on the inner r < 110 pc region with an open square (see further text). Left: Radially averaged dust temperature profile. We indicate the dust temperature inferred from the simultaneous fit in full circles, and that from independent fit not taking the total FIR SED into account with open circles (see Appendix D). Middle: Mass fraction as a function of the dust temperature. Right: Total IR luminosity (8–1000 μm) fraction as a function of the dust temperature. |
We have previously shown that the FIR SED of J2348–3054 indicates the presence of an AGN hot dust torus component at  (Fig. 3), while the resolved continuum observations at 250 and 670 GHz provides evidence for warm dust in the core of the galaxy. Although we cannot formally exclude the possibility that the central FIR luminosity and dust temperature in J2348–3054 is due to a starburst, these results (along with the improved agreement of our resolved temperature observations with a model including AGN feedback, as shown in Fig. 4) suggest that the high dust temperature is most likely due to AGN radiation heating the dust.
An important consequence of AGN radiation heating the dust is that the previous estimates of both the central and total SFR are too high. As a first-order estimate of this overestimation, we can consider excluding the contribution from the central r < 216 pc region, which accounts for 35% of the continuum emission at 670 GHz. Since the high temperature is likely to be AGN-related – and not due to star-formation – the central FIR luminosity should not be converted to SFR. We note that our analysis in Sect. 3 includes a revision of the FIR luminosity by a factor 3.6, compared to a single optically-thin greybody estimation (Walter et al. 2022), implying a total nearly five-fold overestimation of the total SFR of when excluding the central resolution element. We note that this is a very rough estimate: in reality, the AGN can heat dust beyond the central beam and, conversely, the central beam is not completely devoid of star-formation. A more quantitative (but model-dependent) estimate of the overestimation of the SFR can be established with simulations, with Di Mascia et al. (2023) suggesting that the SFR in J2348–3054 might be overestimated by a factor ∼10, significantly above our back-of-the-envelope calculation. If confirmed in this and other high-redshift quasars, this would alter our view of z > 6 quasar host galaxies as extreme starbursts, bringing their SFR in line with those observed in non-active galaxies such as REBELS and ALPINE (Bouwens et al. 2022; Schouws et al. 2023; Béthermin et al. 2020; Schaerer et al. 2020).
A number of caveats apply to our analysis. Firstly, the luminosity of the most-luminous source in the AGNsphere model is much lower than that observed for J2348–3054. However, for the AGNcone simulation, the temperature profiles are relatively similar between the most luminous source (as luminous as J2348–3054 this time) and the average profile of all objects in the box. Secondly, while the simulations match the observations best when AGN feedback is switched on, other models and simulations might reproduce the observed temperature profiles. Finally, J2348–3054 is among the most compact and FIR-luminous high-redshift quasars observed with ALMA so far, which could either support the AGN heating scenario detailed here or simply be an outlier in terms of SRFD.
5. Summary and future prospects
We have reported the first high-frequency (> 600 GHz) and high-resolution (360 pc) observations of a z ∼ 7 quasar host galaxy, resolving the dust temperature and optical depth across its host galaxy. These observations sample the peak of the dust SED and spatially resolve it at 360 parsec resolution, leading to the following key results:
-
We report the presence of a warm (88 ± 2 K), optically-thick (
 ) dust component at the center (r < 216 pc) of J2348–3054. Including a contribution from the AGN hot dust torus, we find a slightly reduced dust temperature of
  . However, further ALMA Band 10 high-resolution observations are necessary to draw a conclusion on the precise AGN torus contribution.
 -
The approximation of the unresolved dust emission as optically thin is inadequate, leading to overestimated measurements of the FIR luminosity. Consequently, we show that the SFR of J2348–3054 is likely overestimated by a factor of ∼3.6. This could rise to a factor of ∼5 (∼0.7 dex) if the contribution of the central 216 pc parsec is removed, as the dust in this region is likely heated by AGN radiation.
-
Comparison to simulations by Di Mascia et al. (2021) show that the dust is likely heated by AGN radiation, with a strong preference for their spherical feedback prescription.
ALMA high-frequency, resolved observations of high-redshift sources had been missing until now. However, these results, obtained in only 48 minutes, show the potential of such observations to reveal and resolve the ISM properties of the most distant IR-luminous sources. With an abundance of lower frequency high-resolution observations in the archive, it appears that a minimal investment in ALMA Band 8–10 observations would yield considerable progress in the study of galaxies and quasars over the first billion years of the Universe.
For future reference the best-fit SKIRTOR AGN model is the t3_p1.5_q1.5_oa80_R10_Mcl0.97_i0_sed.dat model. We refer to Stalevski et al. (2016) for the naming convention and physical parameters of the model.
Acknowledgments
We thank the anonymous referee for an insightful report that improved this Letter. RAM acknowledges support from the Swiss National Science Foundation (SNSF) through project grant 200020_207349. FW acknowledges support from the ERC Advanced Grant 740246 (Cosmic_Gas). This paper makes use of the following ALMA data: ASA/JAO.ALMA#2018.1.00012.S, ASA/JAO.ALMA#2021.1.01350.S. ALMA is a partnership of ESO (representing its member states), NSF (USA) and NINS (Japan), together with NRC (Canada), NSTC and ASIAA (Taiwan), and KASI (Republic of Korea), in cooperation with the Republic of Chile. The Joint ALMA Observatory is operated by ESO, AUI/NRAO and NAOJ. This work made use of the following Python packages: numpy (Harris et al. 2020), matplotlib (Hunter 2007), scipy (Virtanen et al. 2020), Astropy (The Astropy Collaboration 2022), interferopy (Boogaard et al. 2021).
References
- Algera, H. S. B., Inami, H., De Looze, I., et al. 2024, MNRAS, 533, 3098 [NASA ADS] [CrossRef] [Google Scholar]
- Béthermin, M., Fudamoto, Y., Ginolfi, M., et al. 2020, A&A, 643, A2 [Google Scholar]
- Bischetti, M., Maiolino, R., Carniani, S., et al. 2019, A&A, 630, A59 [NASA ADS] [CrossRef] [EDP Sciences] [Google Scholar]
- Boogaard, L., Meyer, R. A., & Novak, M. 2021, https://doi.org/10.5281/ZENODO.5775603 [Google Scholar]
- Bouwens, R. J., Smit, R., Schouws, S., et al. 2022, ApJ, 931, 160 [NASA ADS] [CrossRef] [Google Scholar]
- Carilli, C., & Walter, F. 2013, ARA&A, 51, 105 [NASA ADS] [CrossRef] [Google Scholar]
- Carniani, S., Gallerani, S., Vallini, L., et al. 2019, MNRAS, 489, 3939 [NASA ADS] [Google Scholar]
- Casey, C. M. 2012, MNRAS, 425, 3094 [Google Scholar]
- Cicone, C., Maiolino, R., Gallerani, S., et al. 2015, A&A, 574, A14 [NASA ADS] [CrossRef] [EDP Sciences] [Google Scholar]
- Da Cunha, E., Groves, B., Walter, F., et al. 2013, ApJ, 766, 13 [NASA ADS] [CrossRef] [Google Scholar]
- De Rosa, G., Venemans, B. P., Decarli, R., et al. 2014, ApJ, 790, 145 [Google Scholar]
- Di Mascia, F., Gallerani, S., Behrens, C., et al. 2021, MNRAS, 503, 2349 [NASA ADS] [CrossRef] [Google Scholar]
- Di Mascia, F., Carniani, S., Gallerani, S., et al. 2023, MNRAS, 518, 3667 [Google Scholar]
- Draine, B. T. 2003, ApJ, 598, 1017 [NASA ADS] [CrossRef] [Google Scholar]
- Farina, E. P., Schindler, J.-T., Walter, F., et al. 2022, ApJ, 941, 106 [NASA ADS] [CrossRef] [Google Scholar]
- Fernández Aranda, R., Díaz Santos, T., Hatziminaoglou, E., et al. 2025, A&A, 695, L15 [NASA ADS] [CrossRef] [EDP Sciences] [Google Scholar]
- Harris, C. R., Jarrod Millman, K., van der Walt, S. J., et al. 2020, Nature, 585, 357 [NASA ADS] [CrossRef] [Google Scholar]
- Hunter, J. D. 2007, Comput. Sci. Eng., 9, 90 [NASA ADS] [CrossRef] [Google Scholar]
- Izumi, T., Onoue, M., Matsuoka, Y., et al. 2021, ApJ, 908, 235 [NASA ADS] [CrossRef] [Google Scholar]
- Jorsater, S., & van Moorsel, G. A. 1995, ApJ, 110, 2037 [Google Scholar]
- Kennicutt, R. C., & Evans, N. J. 2012, ARA&A, 50, 531 [NASA ADS] [CrossRef] [Google Scholar]
- Maiolino, R., Gallerani, S., Neri, R., et al. 2012, MNRAS, 425, L66 [Google Scholar]
- Mazzucchelli, C., Bañados, E., Venemans, B. P., et al. 2017, ApJ, 849, 91 [Google Scholar]
- Meyer, R. A., Walter, F., Cicone, C., et al. 2022, ApJ, 927, 152 [NASA ADS] [CrossRef] [Google Scholar]
- Meyer, R. A., Neeleman, M., Walter, F., & Venemans, B. 2023, ApJ, 956, 127 [CrossRef] [Google Scholar]
- Meyer, R. A., Venemans, B., Neeleman, M., Decarli, R., & Walter, F. 2025, ApJ, 980, 20 [Google Scholar]
- Neeleman, M., Walter, F., Decarli, R., et al. 2023, ApJ, 958, 132 [NASA ADS] [CrossRef] [Google Scholar]
- Novak, M., Bañados, E., Decarli, R., et al. 2019, ApJ, 881, 63 [NASA ADS] [CrossRef] [Google Scholar]
- Novak, M., Venemans, B. P., Walter, F., et al. 2020, ApJ, 904, 131 [NASA ADS] [CrossRef] [Google Scholar]
- Rowland, L. E., Hodge, J., Bouwens, R., et al. 2024, MNRAS, 535, 2068 [Google Scholar]
- Schaerer, D., Ginolfi, M., Béthermin, M., et al. 2020, A&A, 643, A3 [NASA ADS] [CrossRef] [EDP Sciences] [Google Scholar]
- Schouws, S., Bouwens, R., Smit, R., et al. 2023, ApJ, 954, 103 [NASA ADS] [CrossRef] [Google Scholar]
- Scoville, N. Z., & Kwan, J. 1976, ApJ, 206, 718 [NASA ADS] [CrossRef] [Google Scholar]
- Shao, Y., Wang, R., Weiss, A., et al. 2022, A&A, 668, A121 [NASA ADS] [CrossRef] [EDP Sciences] [Google Scholar]
- Stalevski, M., Fritz, J., Baes, M., Nakos, T., & Popović, L. Č. 2012, MNRAS, 420, 2756 [Google Scholar]
- Stalevski, M., Ricci, C., Ueda, Y., et al. 2016, MNRAS, 458, 2288 [Google Scholar]
- The Astropy Collaboration (Price-Whelan, A. M., et al.) 2022, ApJ, 935, 167 [NASA ADS] [CrossRef] [Google Scholar]
- THE CASA TEAM (Bean, B., et al.) 2022, Publ. Astron. Soc. Pacific, 134, 114501 [Google Scholar]
- Tripodi, R., Feruglio, C., Fiore, F., et al. 2022, A&A, 665, A107 [NASA ADS] [CrossRef] [EDP Sciences] [Google Scholar]
- Tripodi, R., Scholtz, J., Maiolino, R., et al. 2024, A&A, 682, A54 [NASA ADS] [CrossRef] [EDP Sciences] [Google Scholar]
- Tsukui, T., Wisnioski, E., Krumholz, M. R., & Battisti, A. 2023, MNRAS, 523, 4654 [NASA ADS] [CrossRef] [Google Scholar]
- Venemans, B. P., Findlay, J. R., Sutherland, W. J., et al. 2013, ApJ, 779 [Google Scholar]
- Venemans, B. P., Walter, F., Zschaechner, L., et al. 2015, ApJ, 816, 37 [CrossRef] [Google Scholar]
- Venemans, B. P., Walter, F., Zschaechner, L., et al. 2016, ApJ, 816, 37 [Google Scholar]
- Venemans, B. P., Walter, F., Decarli, R., et al. 2017, ApJ, 845, 154 [Google Scholar]
- Venemans, B., Neeleman, M., Walter, F., et al. 2019, ApJ, 874, L30 [NASA ADS] [CrossRef] [Google Scholar]
- Venemans, B. P., Walter, F., Neeleman, M., et al. 2020, ApJ, 904, 130 [Google Scholar]
- Virtanen, P., Gommers, R., Oliphant, T. E., et al. 2020, Nat. Methods, 17, 261 [Google Scholar]
- Walter, F., & Brinks, E. 1999, AJ, 118, 273 [NASA ADS] [CrossRef] [Google Scholar]
- Walter, F., Neeleman, M., Decarli, R., et al. 2022, ApJ, 927, 21 [NASA ADS] [CrossRef] [Google Scholar]
- Witstok, J., Jones, G. C., Maiolino, R., Smit, R., & Schneider, R. 2023, MNRAS, 523, 3119 [NASA ADS] [CrossRef] [Google Scholar]
Appendix A: Comparison between the resolved Band 6 and Band 9 continuum observations
Due to page limits for the main body of the Letter, we present in Fig. A.1 a comparison between the resolved Band 6 continuum data (Walter et al. 2022) and Band 9 continuum observations presented in Sect. 2.
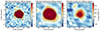 |
Fig. A.1. Resolved continuum measurement of J2348–3054. Left: Observed-frame 250 GHz continuum map reproduced form Walter et al. (2022). Middle: 250 GHz continuum map, convolved to the new Band 9 beam. Right: New Band 9 continuum map at observed-frame 670 GHz. In the three panels, the solid (dashed) contours show the positive (negative) contours at +(−)3σ levels, increasing in power of |

Appendix B: Impact of the dirty beam and residuals
In this appendix, we consider the impact of the dirty beam pattern on the dust temperature map inferred from the 250 GHz and 670 GHz. Indeed, the final “cleaned" image produced by tclean is the sum of the model emission convolved with the clean beam and the residuals below 2σ, which still contain the dirty beam pattern. This leads to ill-defined units, a well-known problem which we address using residual-scaling for the integrated fluxes (e.g., Jorsater & van Moorsel 1995; Walter & Brinks 1999; Novak et al. 2019). In this process, we aimed to check that the dirty beam imprinted in the residuals does not drive the temperature fluctuations reported in this paper.
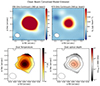 |
Fig. B.1. Top row: Model components (convolved by the clean beam) of the emission in the continuum maps at 250 and 670 GHz. The color scales are the same as in Fig. 1. Bottom row: Corresponding maps of the dust temperature (top left) and dust optical depth (top right). The color scales are the same as in 2. We observe a similar dust temperature and opacity gradient, confirming our results in Fig. 2 are not driven by the beam of the Band 6 or 9 observations. |
To do so, we subtracted the residual maps from the cleaned image to obtain the model emission convolved with the clean beam at 250 GHz and 670 GHz. Such maps are thus free of any dirty beam imprints from the residual. We then rescaled the flux in these maps to match the aperture-integrated residual-scaled fluxes reported in Walter et al. (2022) and this work. We then proceeded to fit each individual one, as done in the main body of this work. We show the model-only continuum emission and the inferred dust temperature and opacity maps in Fig. B.1. We find that the dust temperature and opacity maps are consistent with what is observed when including the residuals, confirming that the gradients are real and not driven by the different dirty beams of the 250 GHz and 670 GHz continuum observations.
Appendix C: Impact of the optically thick and thin assumption on the observed SED and inference of the dust properties
In this appendix, we briefly highlight the different behaviour of optically-thin and -thick dust emission models with dust temperature and mass. This is of particular importance to the inference made when fitting the observed SED, especially with high-frequency observations.
In cases of optically thin emission, adjusting the dust temperature and dust mass parameters can arbitrarily change the peak of the emission and the overall amplitude of the signal to match the data. In turn, this requires a good sampling of the dust SED at various frequencies to constrain the dust properties. In the optically thick case, however, the emission is increasingly suppressed at high frequencies. The first consequence is that the dust SED peaks at lower frequencies than in the optically-thin case (see Fig. C.1, left) and the apparent slope is flatter. Additionally, the amplitude of the SED at high frequencies plateaus when the optical depth (or equivalently the dust mass in a fixed area) increases further. Thus the high-frequency observations better constrain the dust temperature in the optically-thick case, even with a smaller number of constraints on FIR SED (see Fig. C.1). This is what enables us to determine relatively accurate resolved dust temperatures with only two high-resolution images in Bands 6 and 9.
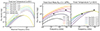 |
Fig. C.1. Illustrative plots showing the dust SED for various dust temperature and dust masses enclosed in an area equivalent to the central beam of our Band 9 observations. The black datapoints show the measured fluxes in the central beam (see Table D.1). Right: Optically thin versus optically-thick SED for various dust masses. Center and left: Optically thick dust SED for varying dust temperatures and dust masses. Under optically-thick conditions, higher dust masses do not translate to higher fluxes at higher frequencies, making Band 8-10 observations sensitive probes of the dust temperature. |
Appendix D: Averaged dust properties in radial annuli
In this appendix, we detail the fitting procedure for the resolved and integrated FIR SED in J2348-3054, and present the resulting dust properties as a function of radius. The simultaneous fit to the resolved and integrated continuum observations was carried out as follows. We first assume that the AGN hot dust torus emission is unresolved at 360 pc resolution, and solely located at the peak of the Band 9 continuum observation. We then extract the fluxes in the central beam, and 3 annuli spanning up to  . For each annuli, we assume that the emission can be reproduced by an optically-thick dust emission model, and for the central resolution element we combine the dust emission with the hot dust torus emission. The total unresolved FIR SED is modeled with the sum of the four individual models detailed above. The total log-likelihood we aim to maximize is then simply the sum of the log-likelihoods for the model of each annuli compared to the resolved data, to which we add the likelihood of the global SED. As we assume errors are gaussian and i.i.d, the log likelihood is simply the sum of the χ2 for each annuli and the integrated SED. We fit the data at hand for each 1920 SKIRTOR models (Stalevski et al. 2012, 2016) with nearly face-on inclination i = 10° (given that J2348-3054 is a luminous quasar but not a blazar), and select the model with the highest likelihood.
We show the parameter posterior distribution in Fig. D.1, with most parameters being well constrained. The dust mass and temperature (and the hot dust torus contribution in the case of the central beam) are correlated for each annuli and the central beam, although correlation for parameters across radii are not significant. We then summarize the inferred dust temperatures, masses and FIR luminosities for each annuli in Table D.1. For completeness we also present the same parameters inferred for independent fits to the each annuli where only the Band 6 and Band 9 data is considered, without the constraints from the total unresolved SED and without an AGN contribution.
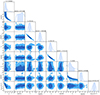 |
Fig. D.1. Parameter posterior distribution of the simultaneous fit to the resolved and integrated FIR observations. The index c denotes the central beam, whilst the indices i = 1, 2, 3 indicate the annuli at increasing radii. The last parameter is the renormalisation of the SKIRTOR model. |
Inferred average dust properties as a function of galactocentric radius in J2348–3054.
All Tables
Inferred average dust properties as a function of galactocentric radius in J2348–3054.
All Figures
|
Fig. 1. New resolved continuum map at |
| In the text | |
|
Fig. 2. Maps of the dust temperature (top left) and dust optical depth (top right), obtained from our best-fit optically-thick dust SED models to the 360 pc resolution Band 6 and Band 9 continuum observations. We only fit pixels where the continuum is detected at S/N > 3 in both bands. The median uncertainty in the dust temperature is |
| In the text | |
|
Fig. 3. FIR SED of J2348–3054. We show the constraints from ALMA, ACA and Herschel/PACS (Venemans et al. 2017; Walter et al. 2022) in black as well as our Band 9 integrated measurement in red. The dashed grey line show the single optically-thin emission model of (Walter et al. 2022) which does not reproduce the Band 9 continuum. The 360 pc resolved 250 and 670 GHz continuum fluxes are present in colored diamonds. The total SED, composed of the sum of the individual annuli SED and the SKIRTOR torus (shaded lines), is shown in dashed red and shaded area. Further ALMA Band 10 (resolved) observations could constrain the properties of the dust torus, which would contribute |
| In the text | |
|
Fig. 4. Comparison between our observations and simulations by Di Mascia et al. (2021). We show the simulated profiles for the most luminous source in the simulations in dashed lines and the average profile of all sources in the simulation with full lines. We show the constraints from the matched-resolution (360 pc) ALMA Band 9 and Band 6 data in full datapoints, as well as the central limits on the inner r < 110 pc region with an open square (see further text). Left: Radially averaged dust temperature profile. We indicate the dust temperature inferred from the simultaneous fit in full circles, and that from independent fit not taking the total FIR SED into account with open circles (see Appendix D). Middle: Mass fraction as a function of the dust temperature. Right: Total IR luminosity (8–1000 μm) fraction as a function of the dust temperature. |
| In the text | |
|
Fig. A.1. Resolved continuum measurement of J2348–3054. Left: Observed-frame 250 GHz continuum map reproduced form Walter et al. (2022). Middle: 250 GHz continuum map, convolved to the new Band 9 beam. Right: New Band 9 continuum map at observed-frame 670 GHz. In the three panels, the solid (dashed) contours show the positive (negative) contours at +(−)3σ levels, increasing in power of |
| In the text | |
|
Fig. B.1. Top row: Model components (convolved by the clean beam) of the emission in the continuum maps at 250 and 670 GHz. The color scales are the same as in Fig. 1. Bottom row: Corresponding maps of the dust temperature (top left) and dust optical depth (top right). The color scales are the same as in 2. We observe a similar dust temperature and opacity gradient, confirming our results in Fig. 2 are not driven by the beam of the Band 6 or 9 observations. |
| In the text | |
|
Fig. C.1. Illustrative plots showing the dust SED for various dust temperature and dust masses enclosed in an area equivalent to the central beam of our Band 9 observations. The black datapoints show the measured fluxes in the central beam (see Table D.1). Right: Optically thin versus optically-thick SED for various dust masses. Center and left: Optically thick dust SED for varying dust temperatures and dust masses. Under optically-thick conditions, higher dust masses do not translate to higher fluxes at higher frequencies, making Band 8-10 observations sensitive probes of the dust temperature. |
| In the text | |
|
Fig. D.1. Parameter posterior distribution of the simultaneous fit to the resolved and integrated FIR observations. The index c denotes the central beam, whilst the indices i = 1, 2, 3 indicate the annuli at increasing radii. The last parameter is the renormalisation of the SKIRTOR model. |
| In the text | |
Current usage metrics show cumulative count of Article Views (full-text article views including HTML views, PDF and ePub downloads, according to the available data) and Abstracts Views on Vision4Press platform.
Data correspond to usage on the plateform after 2015. The current usage metrics is available 48-96 hours after online publication and is updated daily on week days.
Initial download of the metrics may take a while.