Fig. A.1.
Download original image
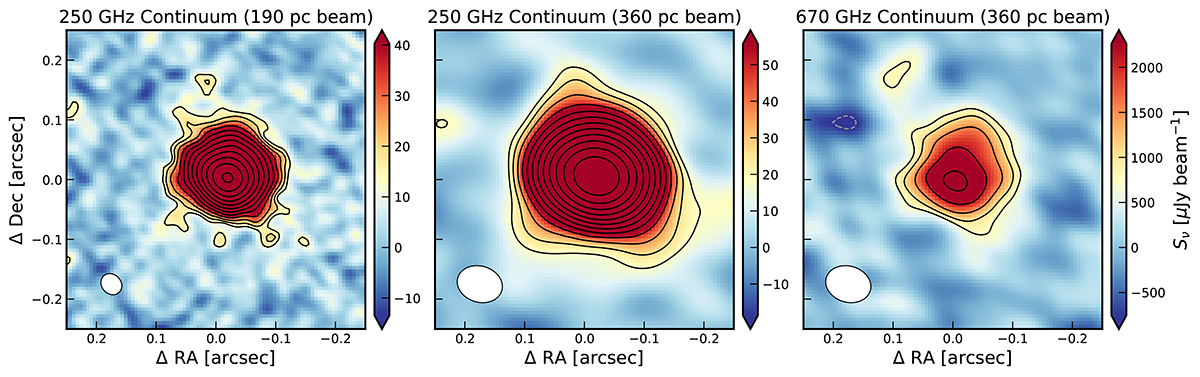
Resolved continuum measurement of J2348–3054. Left: Observed-frame 250 GHz continuum map reproduced form Walter et al. (2022). Middle: 250 GHz continuum map, convolved to the new Band 9 beam. Right: New Band 9 continuum map at observed-frame 670 GHz. In the three panels, the solid (dashed) contours show the positive (negative) contours at +(−)3σ levels, increasing in power of ![]() . The beam is shown in the lower left corner in white.
. The beam is shown in the lower left corner in white.
Current usage metrics show cumulative count of Article Views (full-text article views including HTML views, PDF and ePub downloads, according to the available data) and Abstracts Views on Vision4Press platform.
Data correspond to usage on the plateform after 2015. The current usage metrics is available 48-96 hours after online publication and is updated daily on week days.
Initial download of the metrics may take a while.