Open Access
Fig. 1.
Download original image
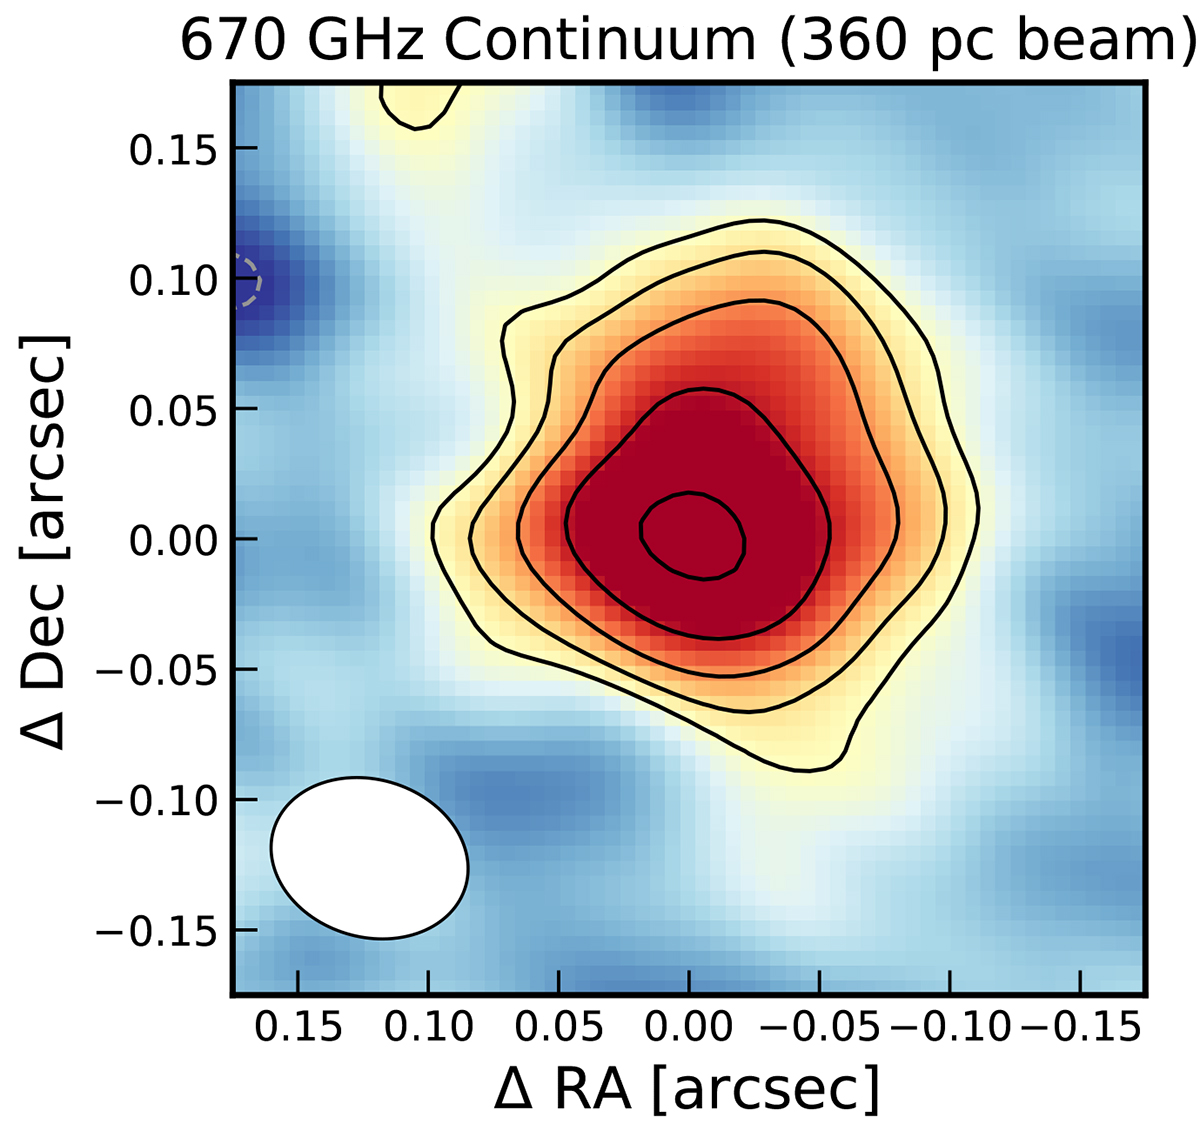
New resolved continuum map at ![]() of J2348–3054. The solid (dashed) contours show the positive (negative) contours starting at +(−)3σ levels, and then increasing in
of J2348–3054. The solid (dashed) contours show the positive (negative) contours starting at +(−)3σ levels, and then increasing in ![]() factors. The beam is shown in the lower left corner in white. A comparison to the
factors. The beam is shown in the lower left corner in white. A comparison to the ![]() continuum map can be found in Appendix A.
continuum map can be found in Appendix A.
Current usage metrics show cumulative count of Article Views (full-text article views including HTML views, PDF and ePub downloads, according to the available data) and Abstracts Views on Vision4Press platform.
Data correspond to usage on the plateform after 2015. The current usage metrics is available 48-96 hours after online publication and is updated daily on week days.
Initial download of the metrics may take a while.